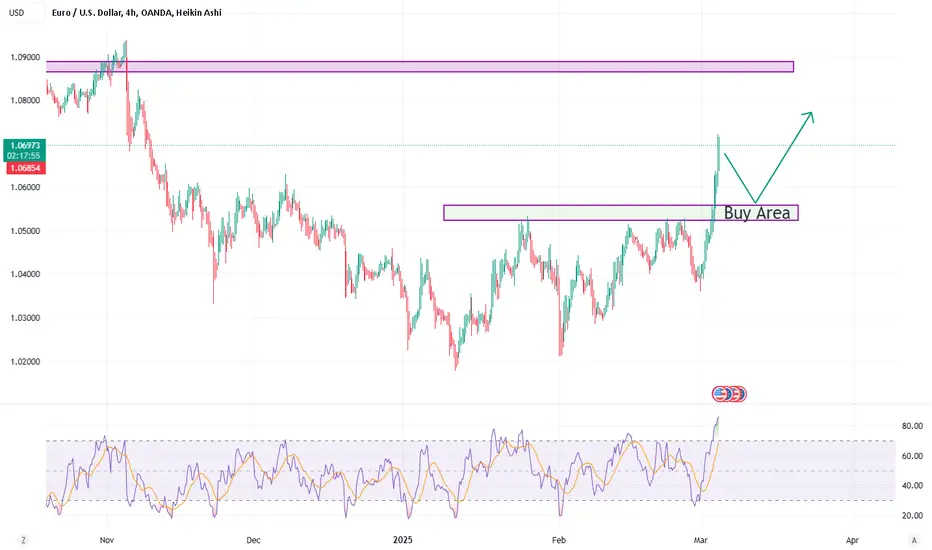
EURUSD Buy TradeEURUSD breaks the Lower High on 4hr time frame, upon retesting the breakout region we can take but trade.
Mange your risk according to account size!
Eurusdtrade
EUR/USD Market Update: Bullish Momentum in Play
CAPITALCOM:EURUSD
We just updated our analysis according to the latest price action. Today's move gave us solid confirmation of the bullish trend. The market pulled back to 1.04276, touched our support level perfectly, and then bounced back up—just as expected. We've adjusted our star pattern while keeping the same key levels intact.
Chart Analysis:
Current Situation: The price is currently hovering around 1.04878, showing good strength after the bounce.
Support Level: 1.04276 proved itself as a solid support. The price respected this level, giving us more confidence in our bullish bias.
First Target: Our immediate target is 1.05415. This level lines up nicely with both our geometric grid and historical resistance. If the price keeps this momentum, it shouldn't take long to reach it.
Key Levels to Watch:
1.06440: This is the next resistance level. If we break through 1.05415, this is where we’ll focus.
1.07469 and 1.08626: These are more ambitious targets but definitely possible if the bullish momentum continues.
1.10834: This would be a real win, indicating a strong shift in the overall trend.
What the Chart Tells Us:
The updated chart shows how our geometric grid aligns with price action. The white "star" pattern gives us a roadmap, and the red dashed lines highlight important time pivots. These intersections often guide the price, so I’m keeping a close eye on them.
The recent "choch 4h" at 1.03738 marks a change of character on the 4-hour chart. It’s a good sign that the bearish phase might be behind us, and we’re in a new bullish cycle.
Bottom Line:
We’re on track toward 1.05415, and if the market keeps this pace, higher targets could be in play. I’ll be watching how the price reacts around our geometric intersections and adjusting as needed. The plan is simple: ride the bullish wave but stay ready in case the market throws us a curveball.

EUR USD Trade Setup 4 hour timeframe EUR USD has formed a break and retest pattern on the 4 hour timeframe turning support into resistance.
So we will be looking for selling opportunities from the lower timeframe'
EUR/USD 1.0600 target hit and cleared. Possible Danger Ahead...Mid week update on the EUR/USD trade: The target has been hit out of the descending broadening pattern and a 343 pip gain at 1.06220 has been locked in.
The EUR/USD made a very strong bullish move today which enabled an exit in the trade however, I am now keeping a very close eye on the possible bearish opportunity coming up if price begins trading around 1.07000 at that upper trend-line.
Both the MACD and the RSI are displaying a continuation divergence (otherwise known as a "Hidden" divergence") and that could spell very bad news for the bulls.
I have done some analysis on the weekly and monthly chart and it further gives me a reason that the bears could be lurking around the corner. I will include that analysis in my next weekly pre market preview video.
For the previous analysis on the EUR/USD and Stock Market down move, refer to my previous video posted.
Update you all soon.
Good Luck & Trade Safe.

EURUSD Will Keep Growing!
HI,Traders !
EURUSD broke the key
Horizontal level of 1.05153
While trading in an uptrend
And the breakout is confirmed
So we are bullish biased and
After a potential correction
And a retest of the new support
We will be expecting a
Further bullish move up !
Comment and subscribe to help us grow !

EUR/USD holds firm above 1.0400EUR/USD remains above 1.0400 in European trading on Monday, supported by Europe’s renewed peace efforts in Ukraine and positive Chinese PMI data, which bolster risk sentiment. This situation puts pressure on the US Dollar as the pair awaits EU inflation data.


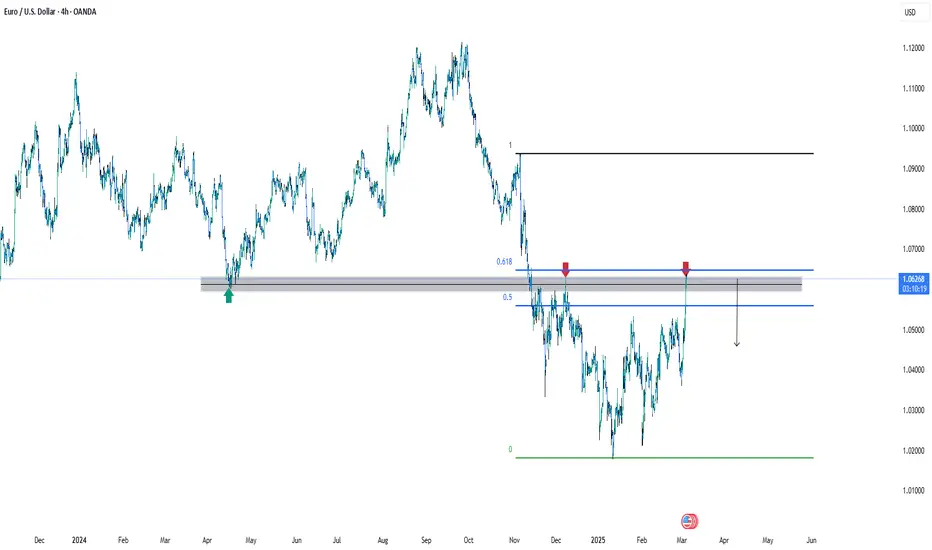
EURUSD| H4Euro to Dollar analysis for the upcoming week:
If the current support zone, where the price is above, is broken, we could see a drop to the 1.02020 level. However, if the support holds and the price continues to rise, I expect a drop at the resistance zone of 1.06794.

EUR/USD Potential Rebound – Short-Term Buy Opportunity?Analysis & Description:
The EUR/USD pair has experienced a strong bearish move, pushing the price down to a key support zone near the lower Bollinger Band. A potential bounce-back scenario is forming, as indicated by the setup.
Key Observations:
✅ Bollinger Band Support: Price touched the lower band, suggesting a possible short-term reversal.
✅ Recovery Setup: The chart outlines a bullish recovery with a target around 1.04128 - 1.04169.
✅ Risk-Reward Setup: Stop-loss positioned below the recent low to manage risk effectively.
Trading Plan:
📈 Bullish Scenario:
A successful hold of the support zone could lead to a move toward 1.04169, marking a possible short-term bullish opportunity.
⚠️ Bearish Risk:
If the price breaks below the recent low, the bullish idea could be invalidated, leading to further downside.
Final Thought:
EUR/USD might see a temporary relief rally after the recent drop. A cautious long entry near support could be an opportunity, but traders must manage risk carefully! 🚀📊

EURUSD Poised for a Pullback—Possible Sell Opportunity Incoming!Watching EURUSD, a potential retrace into the imbalance today and into Monday could present a selling opportunity between Monday and Tuesday. I’ll aim to follow up with a video over the weekend or on Monday. For now, be cautious—avoid selling at this level, as price is trading into a key support zone.

EURUSD Correcting – Another Fall Ahead?Today I want to analyze EURUSD ( FX:EURUSD ) for a 15-minute time frame and whether EURUSD is ready to fall or not.
EURUSD is moving in a Heavy Resistance zone($1.0537-$1.04500) . It also moves in the descending channel in the 15-minute time frame.
According to the theory of Elliott waves , it seems that EURUSD has completed its 5 downward waves , and we should wait for corrective waves . I expect corrective waves to end either in a descending channel or eventually at a Resistance zone($1.0493-$1.0480) .
I expect EURUSD to attack the Support lines in the coming hours, and if the Support lines break , we should expect a decline to at least 100_SMA(4-hour) .
Note: If EURUSD breaks the Resistance line, we can expect more pumps.
Please respect each other's ideas and express them politely if you agree or disagree.
Euro/U.S.Dollar Analyze (EURUSD), 15-minute time frame.
Be sure to follow the updated ideas.
Do not forget to put Stop loss for your positions (For every position you want to open).
Please follow your strategy and updates; this is just my Idea, and I will gladly see your ideas in this post.
Please do not forget the ✅' like '✅ button 🙏😊 & Share it with your friends; thanks, and Trade safe.

EUR/USD Technical Outlook: Key Levels & Trade Setup (Feb 27)📌 Hello traders! FuInvest here, bringing you today’s OANDA:EURUSD technical breakdown. The market never sleeps, and neither should your trading edge! Let’s dive into the price action and key levels for February 27.
📊 Market Overview
Current Price: 1.04783
Market Session: 📍 European Session (Transitioning into New York soon)
Indicators Used: EMA 34 (Gray), EMA 89 (Yellow), EMA 200 (Pink)
Volatility Check: 🔥 Volume picking up, suggesting potential breakouts ahead!
📉 Price Action & Trend Analysis
The EUR/USD pair has been oscillating around the 1.0480 level, showing a recent rejection from the EMA 89 (Yellow) and approaching the long-term EMA 200 (Pink). The short-term trend is mixed, but price action suggests a possible pullback before further movement.
🔹 Bullish Scenario: If buyers regain strength and push above 1.0490, we could see momentum targeting 1.0515 – 1.0530.
🔹 Bearish Scenario: If price fails to hold 1.0470, a downside test towards 1.0450 – 1.0430 is likely.
🛒 Trade Setup & Recommendations
Based on price structure and EMA confluence, here’s our trade idea:
📌 Buy Entry: 1.0470 – 1.0475
🎯 Take Profit (TP): 1.0515, 1.0530
🛑 Stop Loss (SL): 1.0450
📌 Sell Entry: 1.0495 – 1.0500
🎯 Take Profit (TP): 1.0455, 1.0430
🛑 Stop Loss (SL): 1.0515
🚀 Key Takeaways & Trading Plan
✅ The 1.0470 – 1.0490 range is a battleground for price action. A break and close above 1.0490 could signal further upside, while rejection could offer a selling opportunity.
✅ EMA alignment suggests a cautious bullish bias, but confirmation is key!
✅ Volatility is increasing as the New York session approaches – expect bigger moves soon!
🔔 Stay tuned for more updates and real-time insights! Follow FuInvest for daily market breakdowns and discover how to build passive income through smart trading strategies! 🚀

EURUSD Intraday Move -LO Liquidity grab
-61.8 Retraement
-HTF divergence
-LL LH - Change in structure!
Looking to exit preferably before the NY Session
ADR LOW coincides with VPOC (TP) heavy support area with resting liquidity.

EUR/USD at a Crossroads: Will Trade Tensions Push It Lower? EUR/USD has been struggling to maintain momentum above the 1.0500 mark, facing renewed selling pressure as macroeconomic and geopolitical factors influence sentiment. With the US Dollar regaining strength and concerns about European economic stagnation growing, the pair remains vulnerable to further downside.
Technical Analysis:
Resistance Levels: 1.0532 (January 27 high), 1.0629 (December peak), 1.0744 (200-day SMA).
Support Levels: 1.0405 (55-day SMA), 1.0282 (February 10 low), 1.0209 (February 3 low), and 1.0176 (January 13 YTD low).
Indicators: The Relative Strength Index (RSI) is near 55, indicating modest momentum, while the Average Directional Index (ADX) remains around 15, suggesting a weakening trend.
Moving Averages: The 200-day SMA at 1.0744 serves as a key dynamic resistance, while the 55-day SMA at 1.0405 acts as interim support.
Fundamental Analysis:
Several key fundamental factors are exerting downward pressure on EUR/USD:
Trade Policy Uncertainty: While US tariff tensions have temporarily eased, lingering trade disputes, including a 10% duty on Chinese imports and potential EU-targeted tariffs, keep investors cautious.
Diverging Central Bank Policies: The Federal Reserve remains firm on keeping interest rates elevated, while the European Central Bank has begun rate cuts, signaling weaker economic confidence in the Eurozone.
Economic Growth Divergence: The US economy continues to show resilience with robust labor markets and stable inflation, while the Eurozone faces stagnation and potential contraction, particularly in Germany.
European Political Risks: Uncertainty in Germany and wider Eurozone economic struggles add to the Euro’s bearish outlook, making it less attractive compared to the US Dollar.
The EUR/USD pair is at a critical juncture, with key support levels in focus. Trade policies, central bank divergence, and economic growth disparities continue to drive market sentiment. This week is pivotal for the Eurozone, with key economic data releases culminating in Friday’s PMI figures, which could determine the pair’s next major move. Traders should remain cautious and closely monitor both technical and fundamental developments.
Note: Please remember to adjust this trade idea according to your individual trading conditions, including position size, broker-specific price variations, and any relevant external factors. Every trader’s situation is unique, so it’s crucial to tailor your approach to your own risk tolerance and market environment.

EUR/USD (30M) – Waiting for a BreakoutHi Traders ! ,The price is ranging between 1.04688 and 1.04819. I'm waiting for a clear breakout to enter:
Buy (long): If it breaks 1.04730 and confirms, it could target 1.04819 and then 1.05050.
RSI is currently at 52.73, showing neutral momentum. A push above 60 would strengthen a bullish setup.
Sell (short): If it drops below 1.04688, it could reach 1.04557 and 1.04400.
If RSI falls below 40, it would confirm bearish momentum.
I prefer to wait for confirmations before taking a position.
Disclaimer: This analysis is for educational and informational purposes only. It is not financial advice. Always do your own research and manage risk before making any trading decisions.

Is it time to buy the US dollar?With US inflation rising, the US economy performing well, and rates higher for longer (well, I wouldn't be surprised to see the Fed hike rates by the end of 2025), the USD continues to be an obvious buy.
The TVC:DXY is currently testing key horizontal support (previously resistance) and is nearing the weekly moving averages. This could be the time to buy the dollar.
I'm personally looking to short OANDA:EURUSD OANDA:GBPUSD and OANDA:NZDUSD and buy OANDA:USDCAD and OANDA:USDCHF

EURUSD: holds steady above 1.0400 amid US tariff threatsEUR/USD holds steady above 1.0450 in the European trading hours on Thursday. Broad US Dollar underperformance supports the pair. However, tariff threats from US President Donald Trump and geopolitical tension might cap its upside. US data and Fedspeak remains in focus.
EUR/USD Technical Overview
Technically, the bullish outlook of EUR/USD remains intact as the major pair holds above the key 100-period Exponential Moving Averages (EMA) on the 4-hour chart. However, the Relative Strength Index (RSI) is located below the midline, near 42.85, suggesting that further downside cannot be ruled out.
The first upside barrier for EUR/USD emerges near 1.0461, the high of February 19. The key resistance level to watch is the 1.0500-1.0505 zone, representing the psychological level and the upper boundary of the Bollinger Band. A decisive break above this level will see a rally to 1.0533, the high of January 27.

EUR/USD Market Analysis – Bearish Reversal from Key ResistanceThe EUR/USD pair has formed a bearish Bat harmonic pattern , completing near the 0.886 Fibonacci retracement level. Price action has reacted strongly at this resistance, indicating a potential reversal. The first target (T1) is around 1.0394 , while the second target (T2) is near 1.0325 , aligning with key Fibonacci levels. If the resistance holds, a bearish move towards these targets is likely. However, a sustained break above the high may invalidate the bearish setup. Traders should monitor price action closely for confirmation.

EURUSD ShortNice corrective short possibility, before another impulse high, with 40 pip target 7 pip sl

EURUSD and GBPUSD Top-down analysis Hello traders, this is a complete multiple timeframe analysis of this pair. We see could find significant trading opportunities as per analysis upon price action confirmation we may take this trade. Smash the like button if you find value in this analysis and drop a comment if you have any questions or let me know which pair to cover in my next analysis.

EUR/USD – Breakout or Fakeout? Key Levels to Watch!Hello again
EUR/USD has been pushing higher, testing a key resistance zone. The question is will it break through or get rejected?
📌 Here’s what I’m watching:
1.0541 is the key level price is hovering around. A clean break could push us towards 1.0644 & 1.0747.
If it fails to hold, we might see a retest of 1.0450 and 1.0427.
👀 My Take:
If price stays above 1.0541, we could see bullish continuation. But if we drop below 1.0450, then this might have just been a fakeout before heading lower.

EURUSD ShortHave some short with low SL high reward, if it breaks out above i willl start changing my bias and look for long opportunities

EURUSD Analysis Today Hello traders, this is a complete multiple timeframe analysis of this pair. We see could find significant trading opportunities as per analysis upon price action confirmation we may take this trade. Smash the like button if you find value in this analysis and drop a comment if you have any questions or let me know which pair to cover in my next analysis.
