EUR/USD Outlook: Bullish Trend Intact, Next Target 1.06?In my post last week about EUR/USD, I argued that the pair could rise to 1.05 and that dips around 1.03 should be seen as buying opportunities.
Indeed, after briefly dipping below 1.03, the pair reversed to the upside and reached my 1.05 target.
Currently, the pair is undergoing a small correction and is trading at 1.0460 at the time of writing. However, my bullish outlook remains unchanged. Dips around 1.04 should once again be considered buying opportunities.
The next target for bulls could be the 1.06 resistance zone.
Disclosure: I am part of Trade Nation's Influencer program and receive a monthly fee for using their TradingView charts in my analyses and educational articles.
Eurusdtrade


EURUSD Shor-term SellMy Analysis on EURUSD
Based on my technical evaluation of this currency pair, the price action appears to be retesting the key resistance level within the current market structure. This phase is critical, as resistance zones often act as barriers where selling pressure may intensify.
To optimize risk-reward dynamics, I recommend exercising patience and awaiting confirmation of a bearish reversal signal—such as a rejection candlestick pattern, loss of momentum, or a decisive close below the resistance line I’ve identified. A validated bounce from this zone could serve as a high-probability sell signal for traders looking to capitalize on a potential downward move. Additionally, monitoring volume trends and broader market context would further strengthen the conviction in this setup. As always, prudent risk management, including stop-loss placement above the resistance, remains essential.
What are your thoughts, everyone? Does this align with your technical outlook, or are there alternative factors you’d consider in this scenario?

EURUSD Loong!Based on the previous analysis (the daily bias), I am anticipating that this pair might continue with the bullish momentum after a slight pullback.
Entry @ 1.0486, Stop Loss at 1.047 and targets at 1.051, 1.05335

EURUSD Daily BiasThis pair has been on a bullish momentum for the past few days, and I do anticipate that the price might continue being higher and higher.
I was anticipating that the price will reach the OTE at 1.043, but it seems it might continue, leaving behind a FVG.
The target is towards the buyside liquidity at 1.05335. For the entry position, there is a follow up analysis using a 5 min post where I have indicated the entry and stop loss.

EURUSD Long Another long opportunity low stop loss as usual high reward, manage your own trade risk management is key in this game

EURUSD and AUDUSD Top-down analysis Hello traders, this is a complete multiple timeframe analysis of this pair. We see could find significant trading opportunities as per analysis upon price action confirmation we may take this trade. Smash the like button if you find value in this analysis and drop a comment if you have any questions or let me know which pair to cover in my next analysis.

EURUSD Weekly BiasThe bias for this pair is bullish and I do anticipate that the price might be drawn towards buyside liquidity zones at 1.05335 & 1.063, and maybe extend towards the weekly FVG formed at 1.072.
My optimum trade entry would be around the 1.043 and I will use a shorter timeframe (4H) to confirm the entry.

Scenario on EURUSD 12.2.2025On the EURUSD market, I would see the following scenarios. I think that if a floor were to be established, then the sfp at the price of 1.02424 should follow, from here the price could rebound upwards. If the market does not react to this level, then we have the last option and that is the sfp at the price of 1.01958. Then we only have the monthly level, which if it does not hold, I would look for an entry into the long until somewhere below this level, otherwise I see short positions first around the price 1.04650 and then around the monthly level at the price of 1.05795.

EURUSD and GBPUSD Top-down analysis Hello traders, this is a complete multiple timeframe analysis of this pair. We see could find significant trading opportunities as per analysis upon price action confirmation we may take this trade. Smash the like button if you find value in this analysis and drop a comment if you have any questions or let me know which pair to cover in my next analysis.

Strong Sell on EURUSD starting from today. Strong Sell on EURUSD as $$$ is getting its strength back. Enjoy the swing trade on EURUSD

BEARISH SWING SETUP ON EU The last setup I posted was bullish and did give a good reaction that I took as confirmation however the trade did not play out. This then caused a bearish choch on the daily and price has since pulled back and is now showing bearish structure.
Both swing and internal structure on the 4H timeframe and above are bearish so that is the direction I'm following right now.
Fractal structure on the 4H is currently bearish and I will continue trading in that direction targeting January's low.

Eurusd shortI am liking this idea of short with 6 pip sl and a 57 pips take profit if it doesn’t make the move means the bull will take over and I will change my market biased

EURUSD Analysis for ShortsWe have a strong resistance level on daily and 4H time frame
expecting a drop from the range drawn


EURUSD and GBPJPY Top-down analysis Hello traders, this is a complete multiple timeframe analysis of this pair. We see could find significant trading opportunities as per analysis upon price action confirmation we may take this trade. Smash the like button if you find value in this analysis and drop a comment if you have any questions or let me know which pair to cover in my next analysis.

EURUSD Selling OpportunitiesDaily swing Structure = Bearish
Daily Internal Structure = Bearish
Narrative
We are pro-trend which means sell EURUSD. All structures are in alignment.
4Hrs
Swing structure = Bullish
Internal Structure = Bearish
What we can observe is that daily swing, daily internal and 4hrs internal are all in alignment.
We now know that the demand zones created as the market was in the pullback phase are reaction points and that the supply zones should hold if the bearish internal trend is to hold.
Given the 2 facts, we should continue selling Targeting the internal weak low as the low hanging fruit.
Also, it is important to note that we are creating some sorta supply chain, which further cements idea of a strong selling pressure coming into the market. So any pullback into the marked supply orderblock should give us a chance for entry.

EURUSD is planning for a swing bearish waveEURUSD is Bearish for another week or two to come. Catch it up and make profits

EURUSD Will Fall!
HI,Traders !
EUR-USD made a retest
Of the key horizontal
Resistance level of 1.04478
From where we are
Already seeing a bearish
Reaction and we will
Be expecting a
Further bearish move down !
Comment and subscribe to help us grow !

XAUUSD Analysis todayHello traders, this is a complete multiple timeframe analysis of this pair. We see could find significant trading opportunities as per analysis upon price action confirmation we may take this trade. Smash the like button if you find value in this analysis and drop a comment if you have any questions or let me know which pair to cover in my next analysis.

EURUSD SHORTAs higher TF are in strong bearish status, pullback on lower TF gives a good opportunity to join in.. And i look to make entry around the marked AOI and sell all the way to the first and second TP... Fingers crossed

''EUR/USD 4H | Elliott Wave Playbook"
The pair appears to be carving out a textbook 5-wave Elliott structure. Here’s the breakdown:
- **Wave 1, 2, and 3** are in the books, and Wave 4 is now developing, testing the **38.2%-50% retracement zone** (highlighted in orange).
- **Wave 5 Target**: Eyeing **1.0100-1.0090** as the likely destination for the final push lower.
**Trade Plan:**
- Monitoring the sell zone at **1.0373-1.0466**, which aligns with the Wave 4 retracement.
- Any rejection here provides a short setup, with stops above **1.0466** and targets down to **1.0100**.
- R:R is solid, making this a high-probability play for the disciplined trader.
**Market Context:**
- Structural resistance and Fibonacci confluence strengthen the case for shorts.
- Patience is key—waiting for confirmation of Wave 4 completion before entry is paramount.
**Reminder:** This is an analytical outlook, not financial advice. Manage risk diligently.
---
Would this work for your audience, or shall I refine it further?

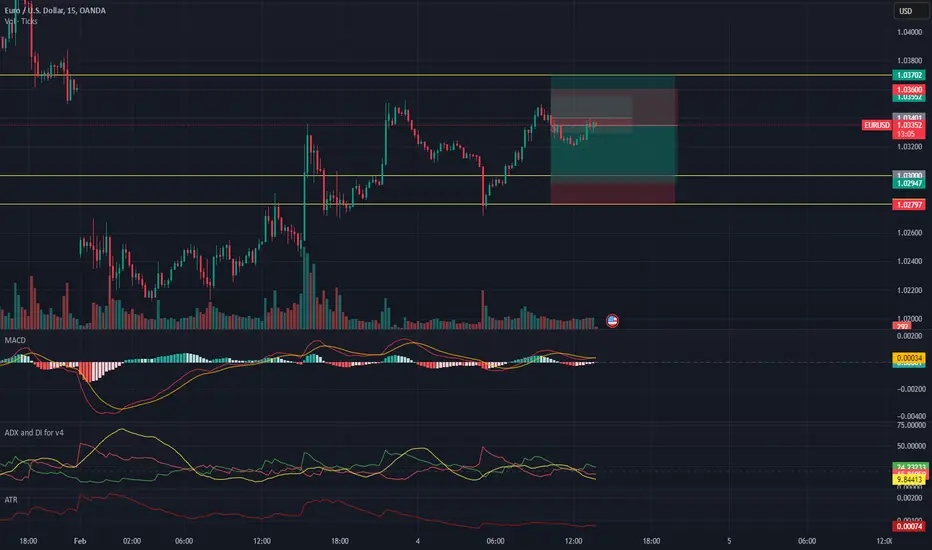
EUR/USD Trading Outlook: Mixed Signals Amid Inflation, Jobs DataFrom a technical perspective, the EUR/USD pair shows mixed signals across different timeframes, creating an interesting setup for traders. On the 4-hour chart, the broader trend remains bearish, with clear break-of-structure (BOS) events marking lower lows, reinforcing downside momentum. However, the 15-minute chart shows a sign of recovery as the price forms higher lows, though it's still confined within a range.
Indicators reflect this indecision. MACD is flat across all timeframes, suggesting a lack of momentum, while ADX values between 17 and 22 confirm weak trend strength with no clear directional bias. ATR remains low, signalling reduced volatility. Volume analysis shows spikes at key support and resistance levels, but tapering volume during consolidations hints at market hesitation.
From a macro perspective, while sentiment may be moderately volatile outside of Trump's tariff talks, the Eurozone continues to experience sticky inflation figures, as seen in Monday's CPI print. The JOLTS and ADP reports would likely be distorted against the current backdrop of uncertainty that would develop from tariffs the U.S. imposes on others.
Trade Idea.
Bull Case (scalping)
Entry Trigger: 1.0340 breakout above weak high
Stop Loss: 1.0330
Target: 1.0355 (which is the scalping resistance)
Risk-Reward Ratio: ~1:2
Bull Case (Swing)
Entry Trigger: Enter long near 1.0300
Stop Loss: 1.0280
Target: 1.0370 (4H High)
Risk-Reward Ratio: ~1:3
Bearish Case (scalping)
Entry Trigger: 1.0335 (Enter short)
Stop Loss: 1.0355
Target: 1.0310
Risk-Reward Ratio: ~1:2
Bearish Case (Swing)
Entry Trigger: 1.0300
Stop Loss: 1.0315
Target: 1.0260
Risk-Reward Ratio: ~1:3
In conclusion, the Eurozone's CPI print will be a key factor driving short-term momentum. A higher CPI print would significantly impact the market. Alternatively, weaker job figures could continue the EUR's short-term momentum. Conversely, stronger JOLTS and ADP figures keep the Fed on the current rate trajectory, spurring a price reversal in the EUR's momentum.
Due to the volatility, scalping might not pose the most favourable strategy this week.