EURUSD Forming Bullish Continuation SetupEURUSD is currently retesting a key breakout zone that previously acted as resistance and is now serving as strong support around the 1.1620–1.1630 area. After a healthy bullish impulse in recent weeks, the pair is pulling back in a controlled manner, likely forming a bullish continuation setup. I entered from earlier levels and remain confident in a further upward move, with the structure showing signs of a new bullish wave forming.
From a fundamental perspective, the euro is gaining strength as the European Central Bank (ECB) continues to signal a more cautious stance on rate cuts compared to the Federal Reserve. US inflation data released last week came in softer than expected, increasing speculation that the Fed could start its rate-cutting cycle as early as September. This shift in monetary policy outlook has weighed on the US dollar, opening up room for EURUSD to push higher.
Additionally, eurozone macro data is showing early signs of recovery, especially in Germany, where industrial production and sentiment indicators are slowly improving. As inflation in Europe trends lower but remains sticky, the ECB has fewer reasons to rush into easing, which adds strength to the euro over the medium term. This divergence is a critical driver of the current bullish sentiment in EURUSD.
Technically, the market is respecting a clean demand zone, with momentum indicators starting to flatten after the recent correction. With the trend structure intact and fundamentals aligned, I'm targeting the 1.2180–1.2200 zone as the next leg of this bullish cycle. Price action remains favorable, and the broader sentiment on TradingView is also increasingly bullish, confirming my conviction in this setup.
Eurusdtrade

EURUSD Under Pressure After Hot CPI – More Downside Ahead?Today, the US released key inflation figures :
Core CPI m/m: 0.2% (vs 0.3% forecast)
CPI m/m: 0.3% (as expected)
CPI y/y: 2.7% (vs 2.6% forecast, up from 2.4%)
Fundamental Analysis ( EURUSD ):
The slightly lower Core CPI suggests some easing in underlying inflation pressures. However, the headline CPI y/y came in hotter than expected at 2.7%, reinforcing the idea that the Fed is not yet ready to ease policy aggressively.
This combination supports the US dollar, as sticky inflation could delay rate cuts.
EURUSD is likely to remain under pressure in the short term unless the ECB signals a more hawkish stance or US data starts showing broader weakness.
Now let's move on to the technical analysis of EURUSD ( FX:EURUSD ) on the 4-hour timeframe .
EURUSD is trading in a Heavy Resistance zone($1.1802-$1.1602) , having simultaneously managed to break the Support lines and the lower line of the Descending Channel , and is also trying to break the Support zone($1.1642-$1.1578) .
I expect EURUSD to continue its downtrend and decline to the Support zone($1.1549-$1.1520) at the first target .
Second target : $1.15043
Third target : $1.1464
Note: Stop Loss(SL)= $1.1660
Please respect each other's ideas and express them politely if you agree or disagree.
Euro/U.S. Dollar Analyze (EURUSD), 1-hour time frame.
Be sure to follow the updated ideas.
Do not forget to put a Stop loss for your positions (For every position you want to open).
Please follow your strategy and updates; this is just my Idea, and I will gladly see your ideas in this post.
Please do not forget the ✅' like '✅ button 🙏😊 & Share it with your friends; thanks, and Trade safe.

Market Analysis: EUR/USD Pares GainsMarket Analysis: EUR/USD Pares Gains
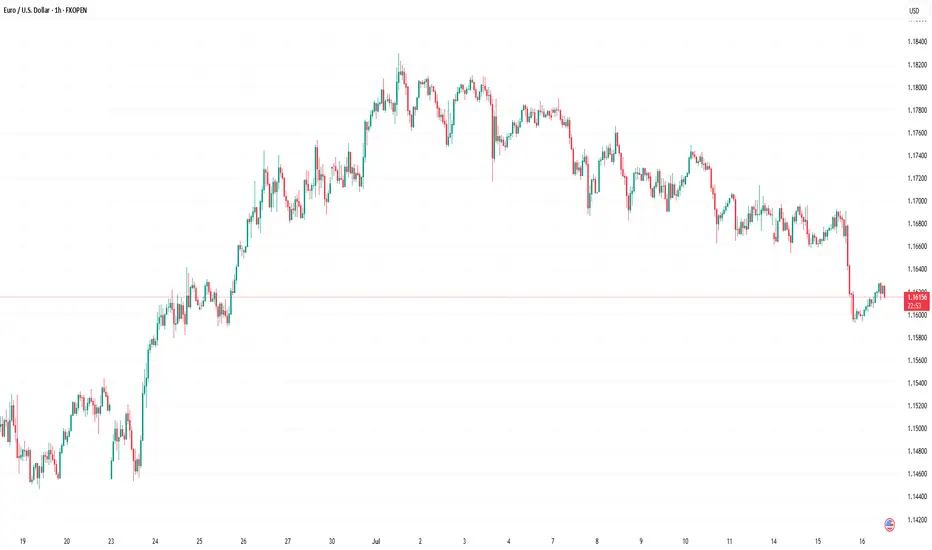
EUR/USD declined from the 1.1750 resistance and traded below 1.1650.
Important Takeaways for EUR/USD Analysis Today
- The Euro started a fresh decline after a strong surge above the 1.1720 zone.
- There is a connecting bearish trend line forming with resistance at 1.1660 on the hourly chart of EUR/USD at FXOpen.
EUR/USD Technical Analysis
On the hourly chart of EUR/USD at FXOpen, the pair rallied above the 1.1720 resistance zone before the bears appeared, as discussed in the previous analysis. The Euro started a fresh decline and traded below the 1.1660 support zone against the US Dollar.
The pair declined below 1.1620 and tested 1.1590. A low was formed near 1.1592 and the pair started a consolidation phase. There was a minor recovery wave above the 1.1610 level.
EUR/USD is now trading below the 50-hour simple moving average. On the upside, it is now facing resistance near the 1.1630 level. It is close to the 23.6% Fib retracement level of the downward move from the 1.1749 swing high to the 1.1592 low.
The next key resistance is at 1.1660 and the 50% Fib retracement level. There is also a connecting bearish trend line forming with resistance at 1.1660.
The main resistance is near the 1.1690 level. A clear move above it could send the pair toward the 1.1720 resistance. An upside break above 1.1720 could set the pace for another increase. In the stated case, the pair might rise toward 1.1750.
If not, the pair might resume its decline. The first major support on the EUR/USD chart is near 1.1590. The next key support is at 1.1550. If there is a downside break below 1.1550, the pair could drop toward 1.1520. The next support is near 1.1485, below which the pair could start a major decline.
This article represents the opinion of the Companies operating under the FXOpen brand only. It is not to be construed as an offer, solicitation, or recommendation with respect to products and services provided by the Companies operating under the FXOpen brand, nor is it to be considered financial advice.
GBPUSD and EURUSD Analysis todayHello traders, this is a complete multiple timeframe analysis of this pair. We see could find significant trading opportunities as per analysis upon price action confirmation we may take this trade. Smash the like button if you find value in this analysis and drop a comment if you have any questions or let me know which pair to cover in my next analysis.

EUR/USD : US Dollar Strengthens Following Inflation ReportEUR/USD Analysis: US Dollar Strengthens Following Inflation Report
Yesterday, the US Consumer Price Index (CPI) report was released, showing an increase in consumer prices. According to Forex Factory, annual CPI rose from 2.4% to 2.7%, exceeding analysts' expectations of a 2.6% rise.
As reported by Reuters, the data supports the stance of Federal Reserve Chair Jerome Powell, who has repeatedly stated that the anticipated inflationary pressure—driven in part by tariffs—is a reason to refrain from further interest rate cuts.
However, President Donald Trump interpreted the data differently. On his Truth Social platform, he posted that consumer prices remain low and called for an immediate rate cut.
The market responded with a stronger US dollar—indicating that participants believe interest rates are likely to remain at current levels in the near term. Notably, the EUR/USD exchange rate fell to the 1.1600 level for the first time since late June (as indicated by the arrow).
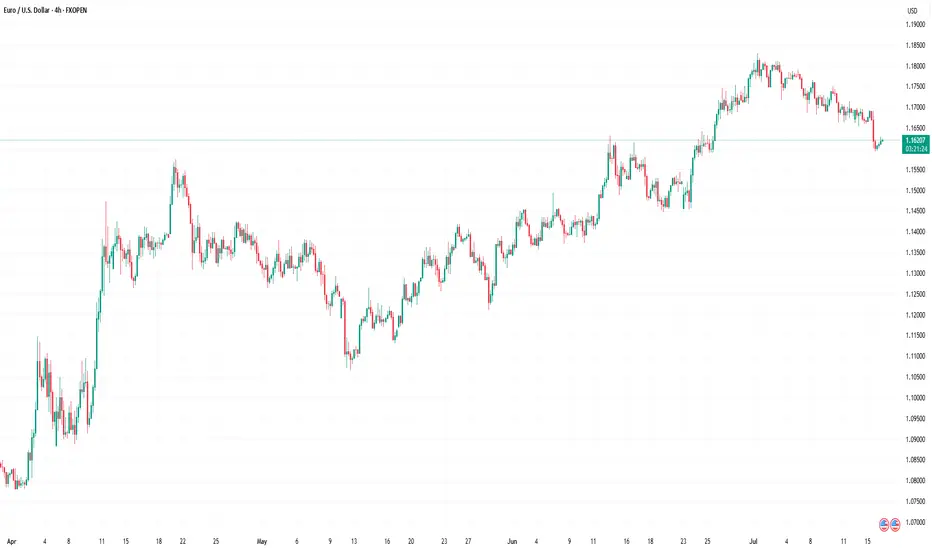
Technical Analysis of the EUR/USD Chart
Analysing the EUR/USD chart as of 7 July, we identified:
→ A long-term ascending channel
→ A potential downward trajectory (marked by red lines)
Since then, the pair has followed the outlined path and declined by more than 1%.
It is worth noting that today, the EUR/USD price is near the lower boundary of a key trend channel, which may offer significant support — traders may look for a technical rebound from this level.
Additionally, attention should be paid to the upcoming release of the US Producer Price Index (PPI) at 15:30 GMT+3. These figures carry particular weight in light of potential renewed inflationary pressures. This and other upcoming data may prove decisive for the near-term direction of EUR/USD.
This article represents the opinion of the Companies operating under the FXOpen brand only. It is not to be construed as an offer, solicitation, or recommendation with respect to products and services provided by the Companies operating under the FXOpen brand, nor is it to be considered financial advice.
EURUSD(20250715) Today's AnalysisMarket news:
Sources said that after Trump's latest trade tax threat, the European Central Bank will discuss a more negative scenario next week than expected in June. The ECB is still expected to keep interest rates unchanged at its meeting on July 24. Discussions on rate cuts are still postponed to September.
Technical analysis:
Today's buying and selling boundaries:
1.1671
Support and resistance levels:
1.1714
1.1698
1.1687
1.1654
1.1644
1.1628
Trading strategy:
If it breaks through 1.1671, consider buying in, the first target price is 1.1687
If it breaks through 1.1654, consider selling in, the first target price is 1.1644

EURUSD(20250714) Today's AnalysisMarket news:
① Fed's Goolsbee: The latest tariff threat may delay rate cuts. ② The Fed responded to the White House's "accusations": The increase in building renovation costs partly reflects unforeseen construction conditions. ③ "Fed's megaphone": The dispute over building renovations has challenged the Fed's independence again, and it is expected that no rate cuts will be made this month. ④ Hassett: Whether Trump fires Powell or not, the Fed's answer to the headquarters renovation is the key.
Technical analysis:
Today's buying and selling boundaries:
1.1689
Support and resistance levels:
1.1738
1.1719
1.1707
1.1670
1.1658
1.1640
Trading strategy:
If the price breaks through 1.1689, consider buying in, with the first target price of 1.1707
If the price breaks through 1.1670, consider selling in, with the first target price of 1.1658

EURUSD Short re entry, 14 JulyHTF Downtrend with Clean LTF Setup
Bias remains bearish with HTF downtrend, W imbalance resting above, and 4H 50EMA close to our zone.
📉 Confluence:
Textbook LTF structure, expecting LH → LL
DXY reacting from 15m POI + Asia low to fill
15m Extreme OB + 5m OB as entry zone
Clean 1m BOS confirming sellers stepping in → add another 50%
🎯 Entry: 50% tap of 5m OB after 1m BOS
🛡️ SL: Above LH structure
📌 TP: At least 1:3 RR down to Asia low
⚠️ Minor risk with W imbalance above, but strong trend and confirmations to support the trade.
3 hours ago
Trade active
We got an 1mBOS from the 15m POI
Got 2 entry points now : The one from the 5m OB marked out on the photo and one at the lower 5m that created the break. Will see what happens

EURUSD Short, 14 JulyHTF Downtrend with Clean LTF Setup
Bias remains bearish with HTF downtrend, W imbalance resting above, and 4H 50EMA close to our zone.
📉 Confluence:
Textbook LTF structure, expecting LH → LL
DXY reacting from 15m POI + Asia low to fill
15m Extreme OB + 5m OB as entry zone
Clean 1m BOS confirming sellers stepping in → add another 50%
🎯 Entry: 50% tap of 5m OB after 1m BOS
🛡️ SL: Above LH structure
📌 TP: At least 1:3 RR down to Asia low
⚠️ Minor risk with W imbalance above, but strong trend and confirmations to support the trade.

Long Opportunity for EURUSDEURUSD is currently in a retracement within a bullish trend with clear Bullish market structures in place.
Price is currently approaching the break and retest level at 1,16285... a potential pivot point which acted as a resistance level in the past. On the 4-hour timeframe, price is trading below the 21 and 50 SMA due to the slow nature of the retracement and we are seeing bearish momentum on the RSI.
Need to see the Bulls stepping in with clean bullish momentum on the 4 hour chart to confirm the bullish market directionality before looking to take a long position. will also be observing the bearish trendline break as an additional point of confluence to take the long trade

EURUSD and GBPUSD Analysis todayHello traders, this is a complete multiple timeframe analysis of this pair. We see could find significant trading opportunities as per analysis upon price action confirmation we may take this trade. Smash the like button if you find value in this analysis and drop a comment if you have any questions or let me know which pair to cover in my next analysis.

EUR/USD Sells from 1.17200 back downWeekly Outlook: EUR/USD (EU)
This week, my bias on EUR/USD is similar to GBP/USD, as both pairs have been following a consistent bearish trend. Based on this structure, I’ll be watching to see if price begins a retracement back into an area of supply.
I’ve marked out the 8-hour supply zone, which sits at a premium level and was responsible for the last break of structure to the downside. If price retraces into this zone, I’ll look for potential sell confirmations on the lower time frames.
If price doesn’t tap into the supply zone first, I’ll then shift my focus to the 8-hour demand zone below. In that case, I’ll watch closely for signs of accumulation and a bullish reaction from this level, which could signal the start of a rally.
Confluences for EUR/USD Sells:
✅ Bearish trend has been consistent for the past few weeks.
✅ Breaks of structure have formed new supply zones to trade from.
✅ Liquidity exists below current price, which may be targeted first.
✅ The lower demand zone remains unmitigated, suggesting further downside movement.
📌 On the way down toward demand, I expect price to form another break of structure to the downside. The plan is to ride the sells down into demand, then look for potential buy opportunities if price begins to accumulate and react.
Let’s stay sharp and disciplined — have a solid trading week, everyone! 📊

Ready to Swipe the Pips? | EUR/USD Heist Blueprint Unlocked🏴☠️💸 EUR/USD "Fiber Heist Plan" – Thief Trader Style 💸🏴☠️
The Vault is Open – Swipe the Bullish Bags! 🚀📈💰
🌟Hi! Hola! Ola! Bonjour! Hallo! Marhaba!🌟
Welcome, Money Makers & Market Robbers! 🤑✨
Here’s the latest masterstroke based on our Thief Trading Style™—a tactical breakdown of EUR/USD primed for a bullish breakout robbery. We’re targeting the red zone 🎯—where the weak hands panic, and the real players win.
🔓 Entry Plan (Buy Setup):
🟢 "The vault is wide open!" — We’re planning bullish entries using 15m–30m timeframe swing levels.
✅ Buy Limit Orders: Plot them smartly around most recent swing lows/highs.
⚠️ Chart Alert Suggested: Eyes on the prize, don’t miss the break-in.
🛑 Risk Guard (SL Setup):
💼 Stop-Loss: Set at nearest 30-min swing low (based on your risk appetite).
Remember, it’s about preserving your loot, not just grabbing it.
🎯 Target Area:
🎯 Primary Target: 1.19000
🎯 Optional Trailing SL: Ride the wave, lock the profits as price moves.
🧲 Scalpers' Notice:
Only scalp long. Got big pockets? Jump in. Smaller bags? Swing along.
💡 Trailing stop advised—don’t let the market steal your gains.
💹 Current Market Outlook:
EUR/USD is moving bullish—supported by technical signals, macro news, COT insights, and intermarket vibes.
🧠 Use all tools: Fundamental 📊 + Sentiment 🧭 + Quant + Bias Score 📈.
📎 Want the full breakdown? Check the 👉.Liinkk.🔗
(Keep updated, conditions shift fast!)
⚠️ News Risk Alert:
🚨 Stay alert during news drops—avoid fresh trades then.
Use trailing SLs to lock profits & guard against reversal raids.
💖 Support the Robbery Plan!
💥 Hit that Boost Button 💥 if you're riding with the Thief Team!
We steal smart, we trade sharp — every day’s a new heist in this market.
See you on the next plan! Stay legendary 🐱👤💸🤑🔥

EURUSDEURUSD still have more correction before the impulse to the upside starts.
Disclosure: We are part of Trade Nation's Influencer program and receive a monthly fee for using their TradingView charts in our analysis.

EURUSD NEW HIGHS?The 1h timeframe reminds me of this book, LIQUIDITY AND MANIPULATION.
"The markets need to generate liquidity in order to move, so if liquidity isn´t
already there, it will be created. So when new traders come in to forex and
learn about it for the first time, what they usually do is gonna be retail based
trading.
So support and resistance, chart patterns which are extremely popular in the
industry, and things of that nature.
So what some brokers do is they offer free education for their clients once we
start trading. Now this education will usually be retail methods support and
resistance. "
Thanks for this idea.
here is the chart relative to this, see the price above it will clear?
I have more on this kind of idea.
This is not a financial advice.
Follow for more .
trade it or see it.
Goodluck

EUR/USD Holding the Line: Bullish Channel Setup!Hi traders! Analyzing EUR/USD on the 30-min timeframe, price is currently reacting near the bottom of a well-defined ascending channel, signaling a potential bullish continuation within the trend:
🔹 Entry: 1.17071
🔹 Take Profit: 1.17423
🔹 Stop Loss: 1.16825
After a corrective move downwards, price tapped into a key trendline support, aligning with prior structure and psychological level near 1.1700. The RSI is showing a bullish divergence near oversold levels, adding confluence to a possible reversal.
As long as price holds above the lower boundary of the channel, bulls may look to target the mid-to-upper region of the range, aligning with previous highs and dynamic resistance.
🟢 The trend remains intact as long as higher lows are respected.
⚠️ DISCLAIMER: This is not financial advice. Every trader is responsible for managing their own risk and strategy.

EUR/USD Testing Support — Will Buyers Step In Again?Hi Everyone,
Since our last update, EUR/USD is currently testing the 1.16680 support level. We’re watching for buying interest to emerge above the key 1.16450 zone; if price can stabilise here, we could see a retest of the highlighted resistance area around 1.17450.
Our broader outlook remains unchanged: as long as price holds above 1.16450, we continue to look for the pair to build momentum for another move higher in the coming sessions. A decisive break above last week’s high could attract fresh buying interest, paving the way for a push towards the 1.19290 area and ultimately 1.20000.
We'll be watching closely to see if this recovery gains traction and whether buyers can sustain the move above resistance. The longer-term view remains bullish, provided price continues to respect the key support zone.
We’ll keep updating you through the week as the structure unfolds and share how we’re managing our active positions.
Thanks again for all the likes/boosts, comments and follows — we really appreciate the support!
All the best for the rest of the week. Trade safe.
BluetonaFX

EURUSD Bearish SMC Setup | Premium Supply Rejection + CHoCH +FVGPair: EUR/USD
Timeframe: 4H
Price reacted strongly from a Premium Selling Zone, forming multiple CHoCH (Change of Character) and BOS (Break of Structure) confirmations.
🔻 Red Zones indicate strong institutional selling
🔺 Weak High is now likely to remain protected
Market structure has shifted bearish, and price is targeting imbalances (IMB) and Fair Value Gaps (FVG) below.
⸻
✅ Entry: Taken from the premium supply rejection
🎯 Target 1: 1.16000 – Minor imbalance fill
🎯 Target 2: 1.15000 – Mid-level demand
🎯 Final Target: 1.14500 – Major liquidity zone
❌ Invalidation: Clean break above 1.18000
⸻
📉 Smart Money Confirmation Setup:
• Premium Supply
• CHoCH
• BOS
• FVG & IMB below
🔄 Missed the entry? Wait for a pullback into lower OB or supply zone.
#EURUSD #SmartMoney #SMC #CHoCH #BOS #FVG #OrderBlock #Forex #LiquiditySweep #SupplyDemand

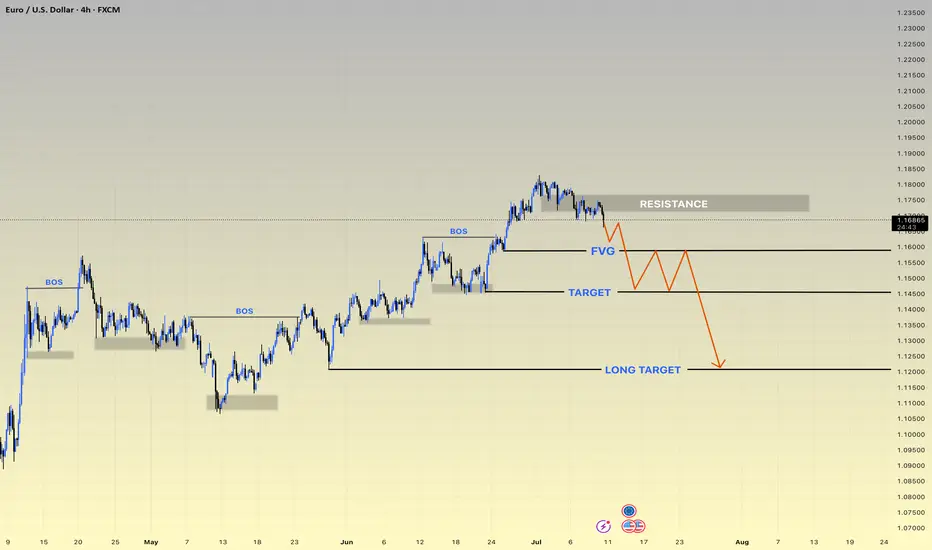
EURUSD h4 update ⚠️ Current Outlook: Reversal Zone Hit
• Price tapped into the strong RESISTANCE zone (~1.1800), failing to break higher.
• Market structure BOS (Break of Structure) confirms bearish intent.
• FVG (Fair Value Gap) likely to act as a short-term liquidity trap.
📍 Disrupted Bearish Flow:
1. Price rejects resistance aggressively ✅
2. Pullback into FVG may trigger a liquidity hunt 🧲
3. Fake bounce → Smart Money re-entry expected 👀
4. Target levels:
• 🥅 TARGET: 1.1550 zone (first major support)
• 🎯 LONG TARGET: 1.1200 zone (high probability zone for HTF buyers)
🔁 Bear Trap Setup Possibility:
• After hitting the LONG TARGET, price could reverse sharply.
• Watch for accumulation signs and deviation below key levels.
⸻
🔥 Key Zones to Watch:
• 🔳 Resistance: 1.1790–1.1820
• 🟦 FVG Retest Zone: 1.1630–1.1660
• 📉 Target Zone: 1.1500–1.1550
• 🚨 Long-Term Demand Zone: 1.1180–1.123
EURUSD Will Keep Growing!
HI,Traders !
#EURUSD is trading in an
Uptrend and the pair broke
The key horizontal level
Of 1.16370 and the breakout
Is confirmed so after a potential
Retest of the support cluster
Of the rising and horizontal
Support lines below we will
Be expecting a bullish continuation !
Comment and subscribe to help us grow !

EURUSD Looking for a retest of potential SupportWe have seen more USD weakness since the ceasefire in the MIddle East as the threat of Global inflation caused by higher Oil prices lowers, raising hopes of future rate cutes by the FED
EURUSD has broken out cleanly from a previous resistance zone, and can act as support on any retests of the 1.1616-1.1636 zone
Stops would need to be below 1.1611
Targets to be around 1.1670-1.1685

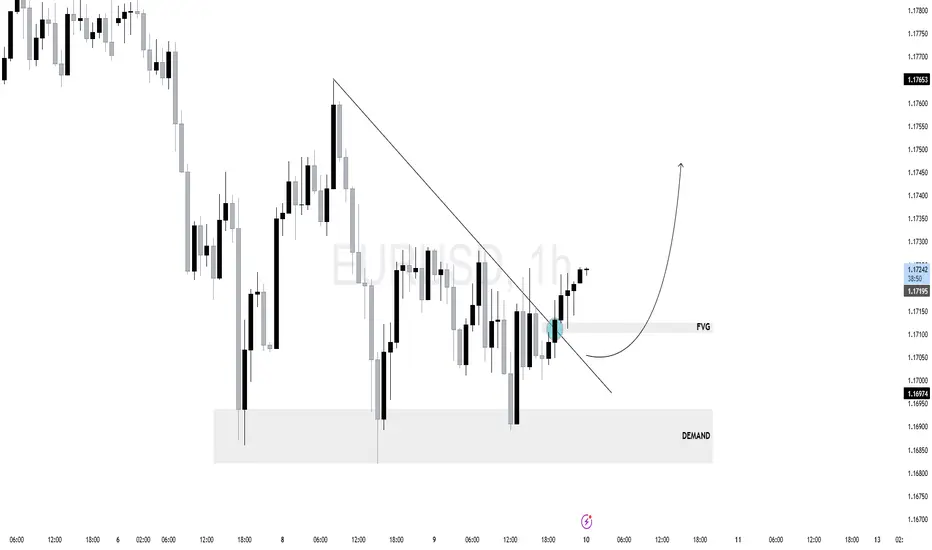
$EU (EURUSD) 1HPrice has been in a short-term downtrend with lower highs and lower lows. Recently, price tapped into a clear demand zone (marked gray at the bottom), showing strong bullish rejection and mitigation.
A clean break of the descending trendline confirms a potential shift in market structure.
Price has now retraced into a Fair Value Gap (FVG) after the breakout — a bullish continuation setup.
As long as price holds above the FVG and demand zone, expect a continuation toward external liquidity above - Demand Zone (1.16700–1.16950)
If price breaks back below the FVG and especially under the demand zone, the bullish scenario weakens
EurUsd - This is the deadly breakout!EurUsd - FX:EURUSD - is about to fly:
(click chart above to see the in depth analysis👆🏻)
EurUsd has been rallying about +15% over the past couple of months. Additionally the breakout at the current resistance trendline is about to be confirmed. Subsequently EurUsd is setting up for another major move higher, which will be painful for all European traders.
Levels to watch: $1.23, $1.11
Keep your long term vision🙏🙏
Philip (BasicTrading)
