EURUSD Analysis week 32Fundamental Analysis
EUR/USD gained on Friday after the Greenback was weakened by the poor US Non-Farm Payrolls (NFP) data.
With the US economic data turning sour, investors extended their losses for two days on growing concerns about a broader recession in the domestic US economy, triggering a flight from risk assets and sending equity indices sharply lower.
Next week, the US will see the ISM Manufacturing Purchasing Managers’ Index (PMI) for July on Monday. Euro-wide retail sales for the year ending June are scheduled for release early Tuesday. This will give us a clearer picture of the current stage of the currency market.
Technical Analysis
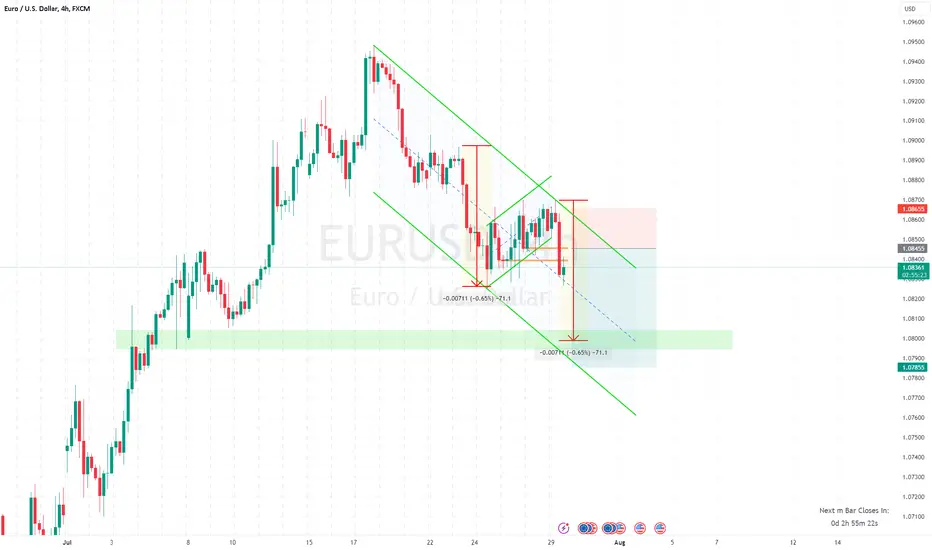
GBPUSD formed a wide range after the NF release with the nearest support resistance in the range of 1.094 and 1.082. On the H4 timeframe, EMA 34 is looking to surpass EMA 89 to escape the short-term downtrend of the past week. Specifically, it proves that the price line has broken out of the downtrend line. The uptrend may face the highest resistance at 1.098 when the price breaks out of the immediate resistance at 1.094. On the other hand, recovery is necessary in an uptrend. The price trend may retest the broken trend zone around 1.083 after some investors take profit. If the downtrend is established, the strong support zone next week will be 1.075.
Resistance: 1.094-1.098
Support: 1.083-1.075
Trading Signals
BUY EURUSD zone 1.075-1.073 Stoploss 1.071
SELL GBPUSD zone 1.098-1.100 Stoploss 1.102
Eurusdtrade

EURUSD Technical Analysis and Trade Idea 👉🔍In this video, we closely examine EURUSD. Recently, the EURUSD has experienced a strong bullish rally but now appears overextended and has reached a key resistance level. Given this overextended move, I'm looking for a buy opportunity on a Fibonacci retracement.
In the video, I share my insights on price action, market structure, and the trend. Remember, this content is for educational purposes only and not financial advice. Trading carries significant risk, so it's important to use responsible risk management strategies. 📊✅

EURUSD- Elliott Wave CountEurusd- Elliott Wave Count
FX:EURUSD OANDA:EURUSD FOREXCOM:EURUSD FOREXCOM:EURUSD FX_IDC:EURUSD PEPPERSTONE:EURUSD ICMARKETS:EURUSD CAPITALCOM:EURUSD
Elliott Wave Count!

EURUSD Trading signalsBUY EURUSD now zone 1.08300-1.08100
↠ Stoploss 1.07900
→ Take Profit 1 1.08600
→ Take Profit 2 1.09300
EURUSD pair price is at the upper boundary of the price range.
After some CPI data released, the pair has a tendency to break the resistance level and close the m30 candle above the trendline resistance area.
The pair is still creating Dow to break out of the price range and form a short-term uptrend.

Buy EURUSD towards 1st & 2nd Target EURUSD is in the up trend on Weekly basis & it has just tested its daily order block today.
So we can expect the upside movement towards 1st & 2nd Target in coming days keeping SL just below order block
Good Luck :)

EUR/USD H4 Potential Sell SetupMy view on potential sell setup and market projection on H4 timeframe based on Technical Analysis. Good luck and trade wisely.

EUR/USD Trade Setup on the Daily TimeframeEUR/USD pair is currently moving sideways on the daily timeframe, forming an ascending channel characterized by higher highs and higher lows. It recently broke out and found support at the 1.08000 level.
We are now looking for buy entries at this support level. Let's scale down to the lower timeframes to identify potential buy patterns and entry confirmations.

EURUSD → Trade Analysis | SELL SetupEURUSD is moving in a descending channel under the trend lines.
The price has fallen under the dynamic support, which now acts as resistance.
We expect the decline to continue after testing the lower boundary of the channel.
Hello Traders, here is the full analysis.
I think we can soon see more fall from this range! GOOD LUCK! Great SELL opportunity EURUSD
I still did my best and this is the most likely count for me at the moment.
-------------------
Traders, if you liked this idea or if you have your own opinion about it, write in the comments. I will be glad 🤝

EUR/USD H1 Potential Sell SetupMy view on potential sell setup and market projection on H1 timeframe based on Technical Analysis. Good luck and trade wisely.
1-hour chart GBP/USDVisit fourtrades website for more active insights
On the 1-hour chart, GBP/USD is consolidating within a range between 1.2840 and 1.2800. The price recently tested the lower boundary of this range and the descending channel support. A bullish breakout from this range could see the price targeting the 1.2940 resistance level. Conversely, a bearish breakout could lead to a continuation of the downtrend towards 1.2750.
Conclusion
The GBP/USD pair is at a critical juncture, testing significant support levels on multiple timeframes. Traders should watch for a breakout from the current descending channel and the 1.2820 support level. A bullish breakout could offer long opportunities targeting 1.2940 and 1.3000. On the other hand, a break below 1.2820 could see the price moving towards 1.2750 and 1.2650, providing potential short opportunities.

7 Dimension Sell setup for EURUSDCore Analysis Method: Smart Money Concepts
😇7 Dimension Analysis
Time Frame: 15M
1: Swing Structure: The market has formed a bearish BOS after taking inducement. Now, the focus is on the corrective swing move as a pullback. The internal structure also supports a bullish corrective move toward the external POI, OB & BB with proper FVG and LIQ resting area in the discounted zone. We are using one regular entry module for this.
2: Pattern
🟢 CHART PATTERNS:
Reversal: Triple top is already formed at the top of the swing.
🟢 CANDLE PATTERNS:
We will check at the POI zone.
3: Volume:
🟢 Fixed range indicates full bearish control at the POI.
🟢 Volume during correction is almost dry.
4: Momentum RSI:
🟢 In strong bearish zone with proper bearish range shift and classic.
🟢 Grandfather-Father-Son entries based on H4 TF are intact and formed.
5: Volatility Bollinger Bands:
🟢 About to break after contraction, possible squeeze breakout in the lower band. Walking on the band is also expected here.
6: Strength: Based on ADX, bears fully control the market at this level.
7: Sentiment: Strong bearish.
✔️ Entry Time Frame: 15 min
✅ Entry TF Structure: BOS Bear
☑️ Trend line breakout: Awaited
💡 Decision: Sell limit
🚀 Entry: 1.08475
✋ Stop loss: 1.08580
🎯 Take profit: 1.07601
😊 Risk to reward Ratio: 7RR
🕛 Expected Duration: 2 days
SUMMARY: Analysis supports a sell position based on Smart Money Concepts methodology, with strong bearish signals from structure, volume, momentum, volatility, strength, and sentiment.

EUR/USD - STRENGTH RETURNS TO THE DOLLARThe dollar is showing strength against the Euro. Macro favors shorts.

EURUSD Euro / U.S. Dollar 1D-TIMEFRAME ANALYSIS💥EURUSD Euro / U.S. Dollar 1D-TIMEFRAME ANALYSIS
💗Hello ladies and gentlemen
This is my new idea for 💥EURUSD
I hope my idea is clear
Support me by like and share thank you
Stay Safe💯💲💲💲
Good luck💰😍

EURUSD Trade Idea👉 My bias for EURUSD is bearish according to this 4H chart. We can clearly see lower highs and lower lows, along with a break in market structure to the downside, accompanied by significant displacement with the candle above the break. As always, trading involves risk. This is not intended as financial advice, and it's wise to trade responsibly with consistent and conservative risk management.

EURUSD Pair : EURUSD ( Euro / U.S Dollar )
Description :
Completed " 12345 " Impulsive Waves
Symmetrical Triangle as an Corrective Pattern in Short Time Frame
Break of Structure and Retracement
RSI - Divergence
Fibonacci Level - 38.20%


EURUSD trading signals✨EUR/USD is trading highs near 1.0850 during the European session on Thursday. The pair ignored risk-on market sentiment and dismal German IFO data, finding support from US dollar weakness. Traders are now looking to US Q2 GDP data for fresh guidance.
✨Technically EURUSD is in an uptrend. Our BUY signal is in the critical zone of the EMA combined with the Fibonacci 0.5 retracement level. The starting point of wave 5 of the Elliot wave model with the expectation that the currency pair will reach the resistance level at 1.1000 coincides with Fibonacci 1.272.
BUY EURUSD now zone 1.08500-1.08300
↠ Stoploss 1.08000
→ Take Profit 1 1.08800
→ Take Profit 2 1.09500

Eurusd Outlook As we Can See in Higher time frame Eu is Bullish, 1.083 is OB area and Also Fib Level 0.5 So We could Expect To Fly ✈️

EUR/USD Sell SetupThe current technical analysis supports a bearish outlook on EUR/USD. By carefully monitoring key resistance levels and using proper risk management, this sell setup aims to capitalize on the expected downtrend while minimizing potential losses. Always stay informed about market conditions and be prepared to adjust your strategy as necessary.

EUR/USD Trade SetupThe EUR/USD pair has broken a major key level.
We are currently waiting for a retest of the broken structure to enter a sell position.

EUR/USD Short ideas from 1.09100 or 1.09300My bias for EU is similar to GU, as I am mainly looking for sell opportunities. Last week’s price distribution across higher time frames has left promising zones to watch, specifically the 4-hour and 17-hour supply zones. If these zones are mitigated, I will look for redistribution within them.
If the price continues to drop, I will look for counter-trend trades to catch retracements, possibly from the 11-hour demand zone I’ve marked or the 5-hour demand zone if the price goes deeper.
Confluences for EU Sells:
Newly created supply zones near the UTAD show promising selling opportunities.
There is significant liquidity to the downside in the form of Asia lows and imbalances that need filling.
The dollar is bullish, aligning well with the bearish bias for EU.
This is a pro-trend trade on the higher time frame.
P.S. I will wait to see how the price action unfolds, as the current price is somewhat distant from my points of interest (POIs), but I expect the price to keep dropping.

EURUSD analysis new weekFundamental analysis
Broad market hopes for a faster pace of interest rate cuts from the US Federal Reserve (Fed) peaked on Friday despite producer price index (PPI) wholesale inflation. of the United States increased significantly. The Fiber index extended its third straight weekly gain as investors' risk appetite was kept at a ceiling.
US Retail Sales figures will be released next Tuesday and Euro traders will have to wait for the European Central Bank's (ECB) latest interest rate call next week, which is expected takes place early next Thursday. The ECB recently delivered a quarter-point rate cut in early June, but further cuts appear unlikely and markets are generally forecast to cautiously leave rates unchanged in July.
Technical analysis
EUR/USD notched a third straight weekly gain, closing Friday slightly above 1.0900. The pair is up 2.3% from its late-June lows and the day's price action is preparing for a clash with the next technical resistance around 1,097. Beyond this peak, EURUSD will continue to move towards the previous year's high at 1,112. In the pullback the direct support level is at the point where investors fought a lot before choosing the winning BUY side at the 1.082 price zone, which is the same zone supported by the two EMAs. In a trend reversal next week's low could reach around 1,068.
Support: 1,082-1,068
Resistance: 1,097-1,112
SELL EURUSD zone 1.082-1.084 Stoploss 1.085
SELL EURUSD zone 1.112-1.114 Stoploss 1.115
BUY EURUSD zone 1.082-1.080 Stoploss 1.079
BUY EURUSD zone 1.068-1.066 Stoploss 1.065

EURUSD - Long idea !!Hello traders!
‼️ This is my perspective on EURUSD.
Technical analysis: Here we are still in a bullish market structure from 4H timeframe perspective, so I look for a long position. We have hidden divergence, also price can reject from liquidity zone and on H1 we have regular divergence, so after breaking 1.08940, I will open a long.
Like, comment and subscribe to be in touch with my content!
