EURUSD Analysis todayHello traders, this is a complete multiple timeframe analysis of this pair. We see could find significant trading opportunities as per analysis upon price action confirmation we may take this trade. Smash the like button if you find value in this analysis and drop a comment if you have any questions or let me know which pair to cover in my next analysis.
Eurusdtrade

EURUSDEURUSD getting ready for another push up, it needs some more correction before heading for the top.
Disclosure: We are part of Trade Nation's Influencer program and receive a monthly fee for using their TradingView charts in our analysis.

EURUSD LIVE TRADEHello friends
Since the price has reached the specified important resistance, a correction in the price is expected. Therefore, you can enter the position with capital and risk management and move with it to the specified goals.
*Trade safely with us*

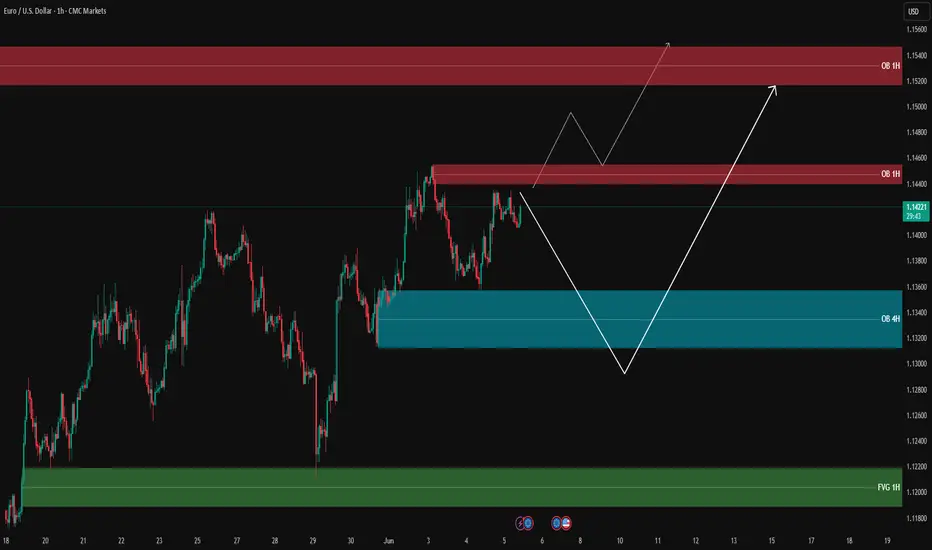
EUR/USD Analysis – Possible Scenarios🔹 Price is currently trading around 1.1421, consolidating between key supply and demand zones.
🔴 Supply Zone (Order Block 1H): 1.14360 – 1.14590
📌 Strong bearish reaction from this resistance area. First scenario: rejection from this OB and a move downward.
🔵 Demand Zone (Order Block 4H): 1.13050 – 1.13430
✅ If price fails to break the resistance, we could see a retracement to this OB. Bullish reaction here may offer long opportunities.
🟢 Fair Value Gap (FVG 1H): 1.11800 – 1.12220
📉 If OB 4H fails to hold, price could drop into this FVG area – a high-liquidity zone for potential reversal.
📊 Possible Scenarios:
1️⃣ Break and hold above OB 1H → price may extend toward next OB zone at 1.15150 – 1.15400
2️⃣ Rejection from OB 1H → pullback to OB 4H → possible long setup if confirmed
3️⃣ Break below OB 4H → deeper move into FVG 1H
‼️ Avoid premature entries – wait for valid confirmations.
🔍 Insight by ProfitaminFX
If this outlook aligns with your bias, or if you see it differently, feel free to share your perspective in the comments. Let’s grow together 📈
EURUSD - Look for Short (SWING) 1:2.5!Price has formed an ascending channel on the higher time frame, currently consolidating before potentially entering a distribution phase. A breakout could occur in either direction, but if the chart pattern plays out as expected, we may see a break below the key support level. Let’s aim for at least TP1.
Disclaimer:
This is simply my personal technical analysis, and you're free to consider it as a reference or disregard it. No obligation! Emphasizing the importance of proper risk management—it can make a significant difference. Wishing you a successful and happy trading experience!

EURUSD Analysis – Short Bias Builds on Key Resistance RejectionEURUSD pair is currently testing a critical resistance zone around 1.1495–1.1500, with bearish rejection beginning to form on the 4H timeframe. The technical setup suggests a potential lower high forming within the context of a broader downtrend, supported by a confluence of horizontal resistance and bearish risk catalysts.
🔍 Technical Overview:
Resistance Zone: 1.1495–1.1575 (multi-timeframe key levels)
Support Levels to Watch: 1.1234 (range base) and 1.1086 (swing low)
Price Action: After a sustained rally, price is showing exhaustion near previous highs, and a rejection pattern is emerging, suggesting selling interest.
Risk Management: Stop placed above 1.1575 high, with downside targets near 1.1234 and extended toward 1.1086.
🧠 Fundamental Backdrop:
ECB Policy Outlook: Lagarde recently warned that a stronger euro and higher tariffs may hurt EU exports. This dovish tone could weigh on EUR sentiment in the medium term.
US Dollar Strengthening: The latest US labor market data (ADP, JOLTS) beat expectations, showing continued resilience in employment and wage growth. This supports the Fed's data-dependent approach, favoring a stronger USD.
Macro Tensions: Global trade concerns (Trump’s tariffs, weak China demand, Germany’s slowing job market) are adding pressure to EUR while supporting safe-haven USD flows.
ECB Consumer Expectations Survey (April): Highlights persistent inflation fears and deteriorating economic confidence.
⏳ Scenario Outlook:
✅ Bearish Bias Preferred below 1.1500 with confirmation of rejection.
🎯 Target Zone 1: 1.1234 – Strong structure & demand zone.
🎯 Target Zone 2 (Extended): 1.1086 – Major low from mid-May.
❌ Invalidation: A breakout and close above 1.1575 would neutralize the bearish outlook and open up higher targets toward 1.17.
Conclusion: The EURUSD pair presents a compelling short opportunity, with both technical resistance and macro pressure aligning for a retracement or reversal. Short setups are favored unless bulls reclaim and hold above the 1.1575 handle.

ECB Cuts Rates. EUR/USD Spikes to 1.5-Month HighECB Cuts Rates. EUR/USD Spikes to 1.5-Month High
Yesterday, as widely expected, the European Central Bank (ECB) cut interest rates for the eighth time since May 2024. According to ForexFactory, the main refinancing rate was lowered from 2.40% to 2.15% (having stood at 4.50% in May 2024).
According to Reuters:
→ ECB President Christine Lagarde stated that interest rates are now at a “good level”, despite the extremely high uncertainty caused by tariff threats from President Donald Trump.
→ Following the press conference, markets interpreted the message as a sign that the ECB is unlikely to cut rates again at its next meeting in July.
In response to the ECB's decision, the EUR/USD rate jumped to its highest level in a month and a half, but later retreated (as indicated by the arrow) back to previous levels.
Technical Analysis of the EUR/USD Chart
Four days ago, while analysing the EUR/USD chart, we:
→ drew an ascending channel;
→ suggested that bullish momentum could push the EUR/USD rate up to the psychological level of 1.1500 during the current week.
In fact, at yesterday’s peak, the rate came very close to 1.1500. However, a candlestick with a long upper shadow had formed on the EUR/USD chart, by the end of the day. Additionally, this morning, the 1.1450 level has acted as a resistance zone.
This suggests bearish activity, which could pull the rate down towards the lower boundary of the local channel (outlined in black), and possibly even attempt a breakout below it.
This article represents the opinion of the Companies operating under the FXOpen brand only. It is not to be construed as an offer, solicitation, or recommendation with respect to products and services provided by the Companies operating under the FXOpen brand, nor is it to be considered financial advice.

EURUSD(20250606) Today's AnalysisMarket news:
The European Central Bank cut three key interest rates by 25 basis points. Lagarde hinted that the rate cut cycle will end, and the market is no longer fully pricing in another 25 basis point rate cut this year.
Technical analysis:
Today's buying and selling boundaries:
1.1447
Support and resistance levels
1.1537
1.1503
1.1481
1.1412
1.1391
1.1357
Trading strategy:
If the price breaks through 1.1447, consider buying, and the first target price is 1.1481
If the price breaks through 1.1412, consider selling, and the first target price is 1.1391

EUR/USD Awaits ECB Decision Near 1.1400 Amid Rate Cut BetsCMCMARKETS:EURUSD FX:EURUSD EUR/USD is consolidating above the 1.1400 psychological level as markets brace for the European Central Bank’s monetary policy announcement. The ECB is widely expected to cut its Deposit Facility Rate by 25bps to 2.00%, marking its seventh consecutive rate cut since June 2024.
Technically, the pair continues to trade within a well-defined ascending channel, reflecting a broader bullish structure. Current price action is facing a minor resistance near 1.1421, which is the top of the short-term range and also a key trendline rejection zone. A clean breakout above this area could expose the monthly resistance near 1.1557.
However, if OANDA:EURUSD EUR/USD fails to breach this level initially, a pullback toward 1.1366 (channel base support) is possible before bulls regain control. The bullish setup remains valid as long as price holds above this support zone.
Traders should monitor the ECB press conference for signals on whether the central bank may pause further easing later this year.
Resistance : 1.1421 , 1.1557
Support : 1.1366 , 1.1250

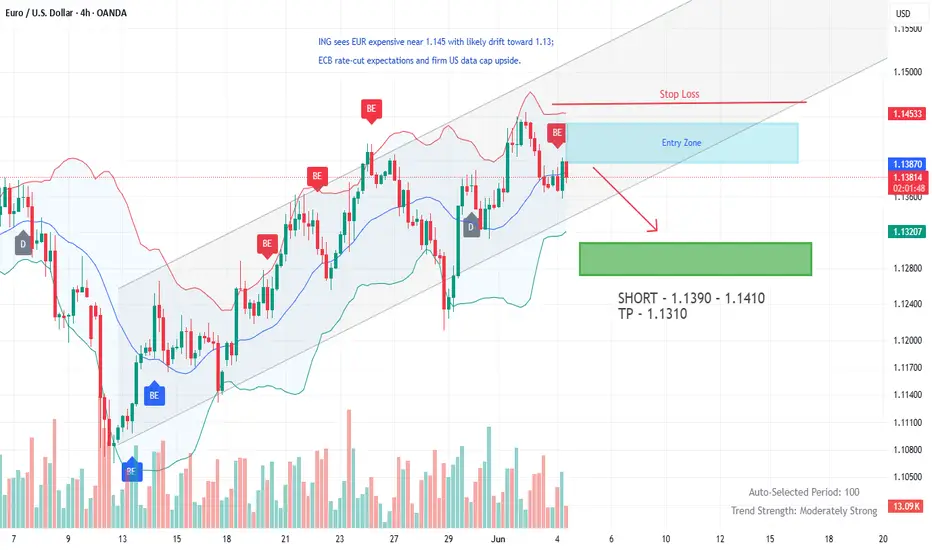
EUR/USD Short IdeaEUR/USD Short Idea [ /b]
ING sees EUR expensive near 1.145 with likely drift toward 1.13; ECB rate‑cut expectations and firm US data cap upside.
Softer euro-area CPI and tomorrow’s ECB meeting keep rate-cut
expectations alive, capping EUR/USD rallies.
Lingering tariff tension, diverging central-bank paths and
well-defined chart levels combine to drive the current high-conviction plays:
euro softness after a below-target CPI print and Thursday’s looming ECB rate
cut meet still-solid U-S data, making EUR/USD ripe for a fade from 1.14.
EURUSD and GBPUSD Breakout?Hello traders, this is a complete multiple timeframe analysis of this pair. We see could find significant trading opportunities as per analysis upon price action confirmation we may take this trade. Smash the like button if you find value in this analysis and drop a comment if you have any questions or let me know which pair to cover in my next analysis.

Market Analysis: EUR/USD Trims GainsMarket Analysis: EUR/USD Trims Gains
EUR/USD started a downside correction from the 1.1450 resistance.
Important Takeaways for EUR/USD Analysis Today
- The Euro struggled to clear the 1.1450 resistance and declined against the US Dollar.
- There was a break below a key bullish trend line with support at 1.1395 on the hourly chart of EUR/USD at FXOpen.
EUR/USD Technical Analysis
On the hourly chart of EUR/USD at FXOpen, the pair gained pace for a move above the 1.1300 zone, as mentioned in the previous analysis. The Euro tested the 1.1450 resistance and recently corrected gains against the US Dollar.
The pair dipped below 1.1400. There was a break below a key bullish trend line with support at 1.1395. It even traded below the 23.6% Fib retracement level of the upward move from the 1.1209 swing low to the 1.1454 high.
The pair is showing some bearish signs, and upside potential might remain limited. Immediate resistance is near the 50-hour simple moving average at 1.1395.
The next major resistance is near the 1.1450 zone. An upside break above the 1.1450 level might send the pair toward the 1.1500 resistance. Any more gains might open the doors for a move toward the 1.1550 level.
On the downside, immediate support on the EUR/USD chart is seen near the 50% Fib retracement level of the upward move from the 1.1209 swing low to the 1.1454 high at 1.1330. The next major support is near the 1.1300 level. A downside break below the 1.1300 support could send the pair toward the 1.1210 level.
This article represents the opinion of the Companies operating under the FXOpen brand only. It is not to be construed as an offer, solicitation, or recommendation with respect to products and services provided by the Companies operating under the FXOpen brand, nor is it to be considered financial advice.

EURUSD Trade Setup: Heres My Trade Plan!📈 EUR/USD Trade Outlook: Bullish Trend in Focus 🇪🇺💵
I'm currently watching EUR/USD, and it’s holding a strong bullish trend — with clear higher highs and higher lows across the board 🔁. On the 4-hour timeframe, price has pulled back into equilibrium, and I’m eyeing a potential buy opportunity if the structure continues to hold 🛒.
📚 Looking at historical price action, this setup has played out reliably in the past. That said, it's important to acknowledge that deeper pullbacks can occur — often sweeping liquidity below previous lows before resuming the trend 💧.
⚠️ This is a real risk, so consider conservative position sizing and always manage your risk appropriately.
💬 Drop a comment below if you're watching this setup too — I’d love to hear your take!
❗️Disclaimer: This is not financial advice. The content shared is for educational and informational purposes only. Please do your own analysis and trade responsibly.

Euro Pulls Back – Eyes on ECB and Tariff TurmoilCMCMARKETS:EURUSD FX:EURUSD EUR/USD pulled back from a six-week high of 1.1454 to trade near 1.1379, down 0.52% on Tuesday, as strong U.S. labor market data and revived trade tensions lifted the dollar. April JOLTS job openings rose to 7.39M, beating expectations, signaling a resilient U.S. economy despite a 3.7% drop in factory orders.
In parallel, Trump’s announcement to double tariffs on steel and aluminum has reignited trade war concerns. Markets are also watching for a potential Trump–Xi call later this week.
Meanwhile, the Euro lost ground after May HICP inflation in the Eurozone fell to 1.9%, below the ECB’s 2% target. With core inflation slowing as well, markets have priced in a 25 bps rate cut at Thursday’s ECB meeting.
Technically, OANDA:EURUSD EUR/USD is still trading within a rising channel but rejected key minor resistance zone just below the descending trendline. A confirmed breakout above this area could open the path toward monthly resistance near 1.1559. On the downside, Support Zone 1 (around 1.1375) must hold to maintain the bullish bias; further weakness may expose Support Zone 2 (around 1.1338)
Resistance : 1.1445 , 1.1559
Support : 1.1375 , 1.1338

EURUSD is looking for price reactionEURUSD is facing the support zone of 1.138. The price reaction of the buyers is jumping into the market, you think this is a nice BUY signal.
You can set up a BUY signal for the pair towards the target of 1.141 in the short term.
In case the h1 candle closes below 1.138, you have to wait for the next BUY zone around 1.134 to be able to BUY and aim for the original target

EURUSD on 3rd May 2025By looking at EURUSD in 4h timeframe, it is trading on very strong zone as it became support now due to yesterday breakout. Also there is uptrend trendline which is acting as strong support, if it breaks our next target will be down to 1.12490 and 1.12930. if this support holds then price may surge in upward direction. Need to wait till breakout in downward.
Key point.
Support - 1.14190, 1.13600, 1.13152
Resistance - 1.14906, 1.15440
If you like it do follow and share.
Any Query Reach Us or comment down.
Follow for more updates.
Rudra Vasaikar Wishes You A Great And Very Amazing Trading Life. Trade Safe, Trade Right.
RISK WARNING 🔴 🔴 🔴
There is high risk of loss in Trading Forex, Crypto, Indices, CFDs, Features and Stocks. Choose your trade wisely and confidently, please see if such trading is appropriate for you or not. Past performance is not indicative of future results. Highly recommended - Information provided by Pro Trading Point are for Educational purpose only. Do your investment according to your own risk. Any type of loss is not our responsibility.
HAPPY TRADING.

EURUSD Back to 8H Support ZoneFollowing the bullish breakout of the trendline on the 4-hour timeframe and the subsequent pullback to the mentioned level, along with confirmations on lower timeframes, we expect the price to retrace toward the 8-hour support zone to gather momentum for a potential continuation of the upward trend.
While a precise touch of the support level is not guaranteed, based on the current setup, it remains a likely scenario.
A possible entry zone could be around the highlighted orange area. Based on this setup, I anticipate a potential drop of approximately 4% in EUR/USD, targeting the 1.095 level.
Disclaimer: You are responsible for your own trades. Do not risk more than 2% of your account on a single setup.

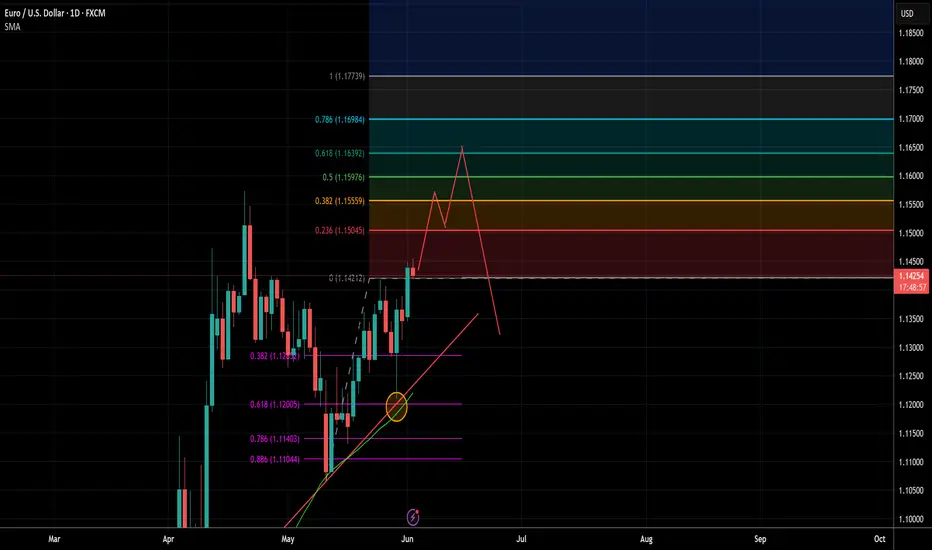
EURUSD - Swing Short Potential OpportunityEURUSD may potentially retest the previous high and trade between fib extension levels 38.2% and then range potentially in that level before pushing higher to the 61.8% extension level retesting and breaking out for a liquidity grab and stop hunt for retails before pushing back down trending back to the mean and retesting previous floor. The 1.1550 & 1.1650 are key historic levels where there has been lots of EURUSD previous action. Expect price to bounce around these areas and trap longs what I think has a high probability of happening per my prediction.
EURUSD Sell – June 2, 2025 (Re-entry)Still maintaining the same HTF bearish bias – daily OB + D trend direction, with liquidity above W/D highs already swept.
After initial stop-out, price offered a cleaner entry: reacting from a 15m POI, followed by a clear BOS on the 1m timeframe.
Plan is to enter on the retest of the 1m OB left behind after the break.
First TP at 1:3 RR, with extended targets below Asia lows if momentum continues.

EUR/USD Rises to 4-Week HighEUR/USD Rises to 4-Week High
As shown on the EUR/USD chart today, the euro rose to a 4-week high against the US dollar this morning.
The euro's strength relative to the US dollar is supported by traders’ expectations ahead of the ECB's interest rate decision, scheduled for Thursday at 15:15 GMT+3.
This upcoming event is notable not only because the ECB is expected to cut rates from 2.40% to 2.15% (for the seventh consecutive time), but also due to the broader context shaped by ECB President Christine Lagarde’s recent remarks on the euro’s status as a reserve currency.
At the same time, the US dollar is weakening amid growing trade concerns—on Friday, the US President Donald Trump announced plans to double tariffs on steel and aluminum to 50%. He also accused China of breaching the recent trade truce.
Technical Analysis of the EUR/USD Chart
Seven days ago, when analysing the EUR/USD chart, we:
→ observed bullish sentiment;
→ highlighted the importance of the 1.1400 resistance level;
→ suggested that bears might attempt to strike back.
Since then, the price has pulled back from the mentioned level (as indicated by the arrow), but found support at the lower boundary of the ascending channel. The current bullish momentum could push EUR/USD towards the psychological level of 1.1500 during the week ahead.
This article represents the opinion of the Companies operating under the FXOpen brand only. It is not to be construed as an offer, solicitation, or recommendation with respect to products and services provided by the Companies operating under the FXOpen brand, nor is it to be considered financial advice.

EURUSD Long Setup Brewing – Here's My Trade Plan!Keeping an eye 👀 on EURUSD – price has just broken market structure 📈 to the upside, and we're seeing clear higher highs 🔼 and higher lows 🔽 forming on the 4H timeframe 🕓.
Price has now rallied into a premium zone 💰, and i'm watching for a retracement 🔁 into my Fibonacci 61.8% 📐✨ point of interest for a potential long entry 🟢.
✅ Entry criteria?
Wait for price to pull back ⬅️ and then give us a break of market structure again 💥.
I'll be looking for confirmations on the 30min or 15min ⏱️ timeframes.
🚫 Not financial advice ✌️

FROM THE HIGHS ! - EURUSD SHORT FORECAST Q2 W23 D2 Y25EURUSD SHORT FORECAST Q2 W23 D2 Y25
🔥👀QUICK SCOPE TECHNICAL REVERSAL HOT PICK
Professional Risk Managers👋
Welcome back to another FRGNT chart update📈
Diving into some Forex setups using predominantly higher time frame order blocks alongside confirmation breaks of structure.
Let’s see what price action is telling us today!
💡Here are some trade confluences📝
✅1 hour order block
✅15' order block
✅Intraday bearish breaks of structure
✅Tokyo ranges to be filled
🔑 Remember, to participate in trading comes always with a degree of risk, therefore as professional risk managers it remains vital that we stick to our risk management plan as well as our trading strategies.
📈The rest, we leave to the balance of probabilities.
💡Fail to plan. Plan to fail.
🏆It has always been that simple.
❤️Good luck with your trading journey, I shall see you at the very top.
🎯Trade consistent, FRGNT X

EUR/USD Update: Bullish Outlook Towards 1.14190 and BeyondHi Everyone,
As we projected in our analysis last week, EUR/USD corrected throughout the week and approached a retest of the 1.12000 level.
We expect the price to potentially retest 1.12000 and confirm it as support before advancing further to challenge the May 26 high of 1.14190. This would further reinforce our outlook for a potential long-term bullish trend.
Of course, the price could also challenge the 1.14190 high without a second retracement, should there be strong buying pressure early in the week. A successful breach of this level would likely drive the price higher towards the 1.15240 level.
We will provide further updates on the expected path for EUR/USD should the price reach this target.
The longer-term outlook remains bullish, with expectations for the rally to extend toward the 1.2000 level, provided the price holds above the key support at 1.10649.
We will continue to update you throughout the week with how we’re managing our active ideas and positions. Thanks again for all the likes/boosts, comments and follows — we appreciate the support!
All the best for the week ahead. Trade safe.
BluetonaFX
