EURUSD SHORT FORECAST Q2 W20 D14 Y25EURUSD SHORT FORECAST Q2 W20 D14 Y25
Professional Risk Managers👋
Welcome back to another FRGNT chart update📈
Diving into some Forex setups using predominantly higher time frame order blocks alongside confirmation breaks of structure.
Let’s see what price action is telling us today!
💡Here are some trade confluences📝
✅Weekly order block rejection
✅Gap fill
✅Intraday 15' order blocks
✅Tokyo ranges to be filled
🔑 Remember, to participate in trading comes always with a degree of risk, therefore as professional risk managers it remains vital that we stick to our risk management plan as well as our trading strategies.
📈The rest, we leave to the balance of probabilities.
💡Fail to plan. Plan to fail.
🏆It has always been that simple.
❤️Good luck with your trading journey, I shall see you at the very top.
🎯Trade consistent, FRGNT X
Eurusdtrade

Bearish AB=CD - Sell at Current Price!FX:EURUSD has broken its bullish support and formed a bearish AB=CD pattern. AB=CD is a bearish continuation pattern which aligns with the overall price action.
I am shorting EURUSD at current market price and expecting retracement until Point D to complete the pattern!

EUR/USD consolidates ahead of US CPICMCMARKETS:EURUSD EUR/USD holds above the 1.1110 area ahead of key US inflation data. The pair rebounded modestly after finding support near the breakout zone (1.1046-1.1100), but upward momentum is capped by minor resistance at 1.1127. A failure to break above this level may expose the 1.1046 support. Technically, the broader trend remains under pressure, as the pair trades below trendline resistance and recent breakdown levels. The upcoming US CPI release could trigger volatility and provide directional confirmation.
Resistance: 1.1127, 1.1212
Support: 1.1046, 1.0960

EURUSD SHORT FORECAST Q2 W20 D13 Y25EURUSD SHORT FORECAST Q2 W20 D13 Y25
Professional Risk Managers👋
Welcome back to another FRGNT chart update📈
Diving into some Forex setups using predominantly higher time frame order blocks alongside confirmation breaks of structure.
Let’s see what price action is telling us today!
💡Here are some trade confluences📝
✅Weekly order block rejection
✅Gap fill
✅Intraday 15' order blocks
✅Tokyo ranges to be filled
🔑 Remember, to participate in trading comes always with a degree of risk, therefore as professional risk managers it remains vital that we stick to our risk management plan as well as our trading strategies.
📈The rest, we leave to the balance of probabilities.
💡Fail to plan. Plan to fail.
🏆It has always been that simple.
❤️Good luck with your trading journey, I shall see you at the very top.
🎯Trade consistent, FRGNT X

EURUSD breakdown?Hello traders, this is a complete multiple timeframe analysis of this pair. We see could find significant trading opportunities as per analysis upon price action confirmation we may take this trade. Smash the like button if you find value in this analysis and drop a comment if you have any questions or let me know which pair to cover in my next analysis.

EUR/USD sell target/buy orderPrice went down and hit a previously marked level at 11083.6 and bounced. However I believe there is still strong selling pressure and the trend will continue to the downside.
There is another high volume area waiting below at 10996.5, Confluence here as this area was the volume point of control on the 10th April.
Usually would trade this as a buy when the level is reached, but I have the confidence that this will continue to drop, so selling down to this level.

EUR/USD Bearish Setup: Supply Zone Rejection Toward1.0900 Target(Swing Trade Setup)
📉 Trendline + CHoCH Confirmation
🔻 Downtrend marked by a falling blue trendline.
🔄 CHoCH (Change of Character) shows a bearish market structure shift, confirmed by a lower low.
🟦 Supply Zone (Sell Zone)
💥 Strong seller reaction previously occurred between:
1.12956 – 1.13896
🔹 Wait for price to retrace into this zone.
🎯 Ideal for short entries.
🎯 Entry & Stop-Loss
🔵 Entry Point: Around 1.12956 – 1.13005
(below supply zone and EMA)
🛑 Stop Loss: 1.13896 – 1.13929
(above the last high + supply zone)
🟦 EMA 70 (Purple Line)
📈 Currently at 1.13051
Acts as dynamic resistance — strengthening the short setup.
🏁 Target Zone
🎯 Main Target: 1.09000
Marked as TARGET POINT 1.0900
🟦 Support Levels Inside Target Zone:
1.09229
1.09150
1.08814
✅ Summary of Trade Idea
📍 Short Position
⬆️ Entry: ~1.13000
🛑 Stop Loss: ~1.13900
⬇️ Take Profit: ~1.09000
⚖️ Risk-to-Reward: ~1:3+ potential

EUR USDHello Traders. I want to share my weekly analysis for EURUSD with you. We have a channel from July 2008 to April 2025. Currently, it has made a breakout and I hope it will continue the bullish scenario.
I am not a professional trader and I would be happy if you share your views regarding EURUSD.

EURUSD SHORT FORECAST Q2 W20 D12 Y25EURUSD SHORT FORECAST Q2 W20 D12 Y25
Professional Risk Managers👋
Welcome back to another FRGNT chart update📈
Diving into some Forex setups using predominantly higher time frame order blocks alongside confirmation breaks of structure.
Let’s see what price action is telling us today!
💡Here are some trade confluences📝
✅Weekly order block rejection
✅Weekly imbalance
✅Intraday 15' order blocks
✅Tokyo ranges to be filled
🔑 Remember, to participate in trading comes always with a degree of risk, therefore as professional risk managers it remains vital that we stick to our risk management plan as well as our trading strategies.
📈The rest, we leave to the balance of probabilities.
💡Fail to plan. Plan to fail.
🏆It has always been that simple.
❤️Good luck with your trading journey, I shall see you at the very top.
🎯Trade consistent, FRGNT X

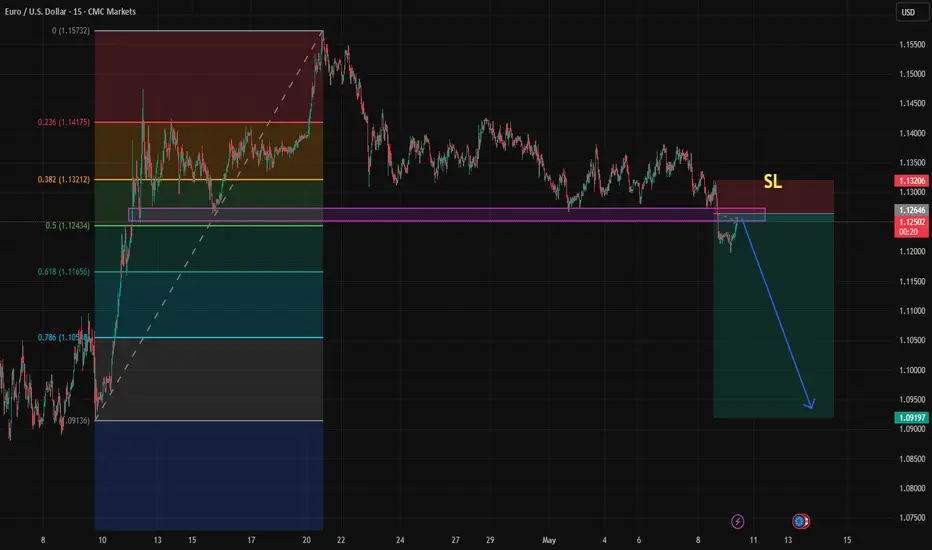
1. EUR/USD Buy Setup1. Entry Point:
Marked at: 1.12243
This is the suggested price level to enter a long (buy) trade.
2. Stop Loss:
Set at: 1.11542
Placed below a support zone, it limits the downside risk if the trade moves against the position.
3. Target Points:
EA Target Point One: 1.13891
EA Target Point (Final): 1.15929
These levels are profit-taking zones, with the first being a conservative target and the second being a more extended move.
4. Technical Indicators:
Moving Averages:
A red shorter-term moving average (possibly 20 EMA)
A blue longer-term moving average (possibly 200 EMA)
Price is currently below both, indicating bearish momentum, though the long setup is anticipating a reversal.
5. Support/Resistance Zones:
Purple Zones: Highlighted as key demand and supply areas.
The lower purple zone supports the entry and stop-loss area.
The upper purple zones mark resistance areas aligning with the target levels.
6. Current Price:
Around 1.12459, slightly above the entry zone.
Conclusion:
This setup is a bullish trade idea with a clearly defined:
Entry (1.12243),
Stop-loss (1.11542), and
Two take-profit levels (1.13891 and 1.15929).

EUR/USD Bearish Setup: QM + Breakout Play Targeting Demand Zone!Hello guys!
I think eurusd is bearish! why?
A Range: Market consolidated in a tight horizontal range before breaking out.
QM Pattern: A lower high and lower low structure indicates potential for a trend reversal.
Neckline Break: Bearish confirmation with a strong break and close below neckline support.
Retest Zone: Price is now revisiting the QM supply zone, offering a high-probability short setup.
Bearish Projection: The next expected move is a drop toward the S&D (Support & Demand) zone between 1.12640 and 1.11900, which aligns with historical demand and previous accumulation.
________________________
🎯 Bearish Target Zone:
First TP: 1.12640
Final TP: 1.11900 - 1.12080 (Demand Zone)

SELL EURUSD !!!HELLO TRADERS
As i can see eurusd break support zone and now its a resistence area As we can see s strong $ and Good NFP data this week with strong jobs and Trump trade Deal with UK its a clear sign as fundamental too and tecnically its showing a broken support trade with your own risk not a financial advice We love ur comments and support Stay tune for more updates
Market Analysis: EUR/USD Trims GainsMarket Analysis: EUR/USD Trims Gains
EUR/USD extended losses and traded below the 1.1250 support.
Important Takeaways for EUR/USD Analysis Today
- The Euro struggled to clear the 1.1380 resistance and declined against the US Dollar.
- There is a key bearish trend line forming with resistance at 1.1240 on the hourly chart of EUR/USD at FXOpen.
EUR/USD Technical Analysis
On the hourly chart of EUR/USD at FXOpen, the pair failed to clear the 1.1380 resistance. The Euro started a fresh decline below the 1.1300 support against the US Dollar.
The pair declined below the 1.1250 support and the 50-hour simple moving average. Finally, the pair tested the 1.1200 level. A low was formed at 1.1196 and the pair is now consolidating losses. The pair is showing bearish signs, and the upsides might remain capped.
There was a minor increase toward the 23.6% Fib retracement level of the downward move from the 1.1381 swing high to the 1.1196 low. Immediate resistance on the upside is near the 1.1240 level.
There is also a key bearish trend line forming with resistance at 1.1240. The next major resistance is near the 1.1290 zone and the 50-hour simple moving average or the 50% Fib retracement level of the downward move from the 1.1381 swing high to the 1.1196 low.
The main resistance sits near the 1.1335 level. An upside break above the 1.1335 level might send the pair toward the 1.1380 resistance. Any more gains might open the doors for a move toward the 1.1420 level.
On the downside, immediate support on the EUR/USD chart is seen near 1.1200. The next major support is near the 1.1165 level. A downside break below the 1.1165 support could send the pair toward the 1.1120 level.
This article represents the opinion of the Companies operating under the FXOpen brand only. It is not to be construed as an offer, solicitation, or recommendation with respect to products and services provided by the Companies operating under the FXOpen brand, nor is it to be considered financial advice.

EURUSD SHORT FORECAST Q2 W19 D9 Y25EURUSD SHORT FORECAST Q2 W19 D9 Y25
Professional Risk Managers👋
Welcome back to another FRGNT chart update📈
Diving into some Forex setups using predominantly higher time frame order blocks alongside confirmation breaks of structure.
Let’s see what price action is telling us today!
💡Here are some trade confluences📝
✅Weekly order block rejection
✅Weekly imbalance
✅Intraday 15' order blocks
✅Tokyo ranges to be filled
🔑 Remember, to participate in trading comes always with a degree of risk, therefore as professional risk managers it remains vital that we stick to our risk management plan as well as our trading strategies.
📈The rest, we leave to the balance of probabilities.
💡Fail to plan. Plan to fail.
🏆It has always been that simple.
❤️Good luck with your trading journey, I shall see you at the very top.
🎯Trade consistent, FRGNT X

EURUSD Will it go up or continuously go down?3 week long consolidation period of price action finally over after breaking out below the consolidation reaching the weekly FVG . Will it be get respected? Or will it turns out to be an IFVG.

EURUSDThe third and final trade of the day will be on EURUSD.
Following the significant depreciation of the Euro during the U.S. and Asian sessions yesterday, I expect this downward trend to continue today as well. That’s why I’m opening a sell trade on the 15-minute chart (as always, using a short-term timeframe).
🔍 Criteria:
✔️ Timeframe: 15M
✔️ Risk-to-Reward Ratio: 1:2
✔️ Trade Direction: Sell
✔️ Entry Price: 1.12932
✔️ Take Profit: 1.12743
✔️ Stop Loss: 1.13028
🔔 Disclaimer: This is not financial advice. It's a trade I’m taking based on my own system, shared purely for educational purposes.
📌 If you're also interested in systematic and data-driven trading strategies:
💡 Don’t forget to follow the page and subscribe to stay updated on future analyses.

EUR/USD Elliott Wave Forecast: Preparing for Wave 5 RallyIn the daily timeframe of EUR/USD, the third wave of the larger Elliott Wave structure appears to have been completed. Within this third wave, we can also observe that the subwave 3 of wave 3 has concluded, and currently, Wave 4 is unfolding.
Wave 4 is presently developing and is likely to retrace toward the 1.10683 level or potentially form a supportive close above it. This zone corresponds to both the subwave 4 of Wave 3 and the main Wave 4 correction, which indicates a critical area of confluence and potential completion of the corrective structure.
Once Wave 4 is confirmed to be complete near this region, the chart suggests that we may enter the beginning of Wave 5, providing a favorable long trade opportunity.
Entry Trigger: Sustained price above 1.10719
First Target: 1.12900
Second Target: 1.13837
Stop-Loss: 1.09518 (below the corrective Wave 4 low to protect the setup)

Range-Bound EUR/USD: Sell Setup Pending Dollar StrengthI'm currently watching the EUR/USD currency pair, and it appears to be under pressure while trading within a range 📉. If you check out the chart in the video 📊, you’ll see what I mean. I’m on the lookout for a potential sell opportunity, but only if the upcoming data release signals strength for the US dollar 💵. In that case, I’d be watching for a break and retest of the current range low—(BoS). My targets would be set two levels below, aiming to close the position by the end of the New York session 🗽. Please note, this is not financial advice! 🚫

EURUSD Is Ready to Break Resistance LinesEURUSD ( FX:EURUSD ) is trying to break the Resistance lines , it has tried several times in the past few days but failed. Will EURUSD succeed this time?
In terms of Elliott wave theory , it seems that EURUSD has completed the main wave 4 near the Support zone($1.1300-$1.1160) and Support line , and we should wait for impulsive waves . Breaking the Resistance zone($1.1480-$1.1420) can confirm the end of the main wave 4 . Otherwise , the main wave 4 can have other forms.
I expect EURUSD to break the Resistance lines in this attack and rise to at least $1.1384 , and the next target can be around $1.1437 .
Note: If EURUSD can break below $1.1272(the worst Stop Loss(SL)), we can expect more dumps.
Please respect each other's ideas and express them politely if you agree or disagree.
Euro/U.S. Dollar Analyze (EURUSD), 1-hour time frame.
Be sure to follow the updated ideas.
Do not forget to put a Stop loss for your positions (For every position you want to open).
Please follow your strategy and updates; this is just my Idea, and I will gladly see your ideas in this post.
Please do not forget the ✅' like '✅ button 🙏😊 & Share it with your friends; thanks, and Trade safe.

EURUSDHello everyone.
I'm here to share a new EURUSD signal and also explain the reasoning behind this trade.
Normally, this strategy is designed for mid- to higher-timeframe trading. However, I noticed a signal from this strategy aligning perfectly with my own system on the 15M chart, which made the setup appear twice as strong.
That said, there's one caveat: the delta value is currently positive, which adds a bit of risk to this trade. Please take that into consideration.
🔍 Criteria:
✔️ Timeframe: 15M
✔️ Risk-to-Reward Ratio: 1:2
✔️ Trade Direction: Sell
✔️ Entry Price: 1.13636
✔️ Take Profit: 1.13473
✔️ Stop Loss: 1.13717
🔔 Disclaimer: This is not financial advice. It's a trade I’m taking based on my own system, shared purely for educational purposes.
📌 If you're also interested in systematic and data-driven trading strategies:
💡 Don’t forget to follow the page and subscribe to stay updated on future analyses

EURUSD – Quiet but Building for a Break?Unlike the wild volatility in Gold, EURUSD has been relatively calm over the past two weeks.
After a sharp spike above 1.1500, reaching a high near 1.1570, the pair corrected and settled into a tight consolidation, fluctuating within just 1%.
Current Setup:
• Price recently reversed from the 1.1280 support and is now pushing towards the 1.1420 resistance.
• Bulls can watch for a breakout above this resistance, which could open the door for a retest of the 1.1570 high.
• As long as 1.1280 holds, the strategy is to buy the dips.
For now, the range is tight, but a breakout could offer some opportunities.
Disclosure: I am part of Trade Nation's Influencer program and receive a monthly fee for using their TradingView charts in my analyses and educational articles.

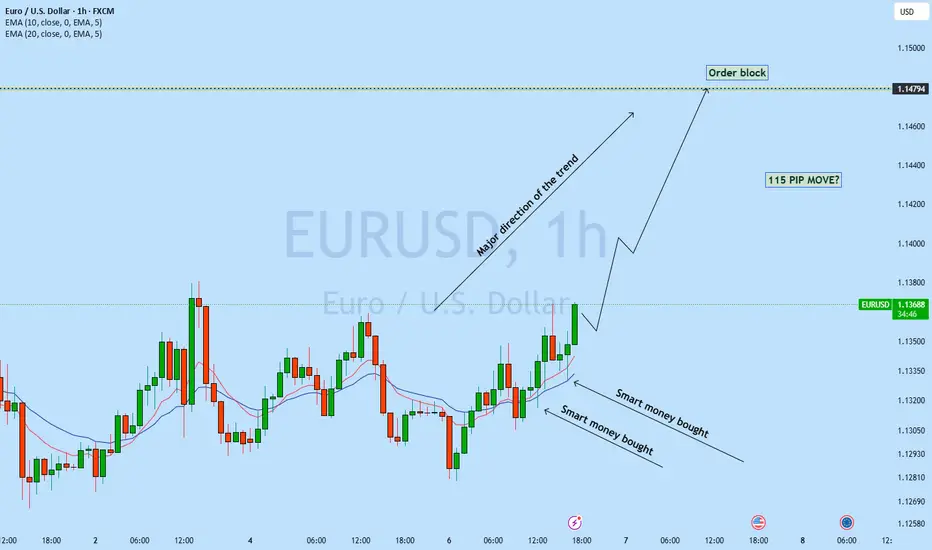
EURUSD is set to move up?EURUSD 1h back to back 2 candle has got rejected from the support level with long wick which is smart money bullish order flow showing potential move back to the resistance line. As Daily trend is bullish we may see EURUSD continue to bounce back to the resistance with newly develop uptrend.
A buy trade is high probable
May 6, 2025 - EURUSD Sell📉 Bias: Bearish | Risk: 0.5% (+0.5% potential add-on) | 🎯 Targets: 1:3 (75% off), final TP > 1:8
🧠 Reasoning:
Price reacted from Daily Orderblock, broke structure on 15m ⛓️.
Refined entry from 15m OB → 5m OB for more precision on the tap entry🎯.
2x Asia lows below = high-probability targets 🔻.
Looking to add 0.5% if 1m BOS + retracement OB confirm.
⚠️ Note:
There’s unmitigated Asia High & 15m OB above, but too far to affect today’s bearish idea.
