EURUSD: The USD is quiet with low trading volumeThe dollar was weak in early European trading on Monday as traders weighed the possibility of an early interest rate cut by the Federal Reserve and a U.S. holiday slowed trading volume.
At 4:35 p.m. ET (9:35 p.m. Japan time), the dollar index, which tracks the U.S. dollar against a basket of six other currencies, was trading 0.1% higher at 102.242 as the holiday began. Martin Luther King Jr.
Data released on Friday showed the U.S. producer price index unexpectedly fell in December, increasing traders' expectations that the Federal Reserve will start cutting interest rates as early as this year.
According to the CME FedWatch tool, the market now has a 78% chance that the Fed will start cutting interest rates in March, compared to a 68% chance a week ago.
This week's US statistical calendar is quiet, with the focus on retail sales figures scheduled to be released on Wednesday. Investors will be closely watched for signs that consumer spending, a key driver of economic growth, remains resilient despite rising interest rates.
Retail sales are expected to increase by 0.4% in December, following a 0.3% increase in November.
Investors will also have the opportunity to hear from several Fed officials, including Fed President Christoper Waller, Atlanta Fed President Rafael Bostic, and San Francisco Fed President Mary Daley.
The value of the euro rose even though Germany's GDP fell
In Europe, the euro/USD pair edged up to 1.0953, even as data showed the eurozone's largest German economy contracted by 0.3% in the final quarter of the year. Last year and he will decrease by the same amount throughout 2023. But despite this weakness, recent inflation data largely confirms the European Central Bank's current thinking, meaning rate cuts are not on the table in the short term, said ECB chief economist Philippe. Lane said Friday.
Eurozone inflation rose to 2.9% in December from 2.4% in November.
Eurusdtradeidea

EUR/USD Analysis: Targeting a breakout to the downside? EUR/USD Analysis: Targeting a breakout to the downside?
The EUR/USD currency pair seems poised for a technical breakout.
Analysing the 8-hour chart reveals a consolidation phase since the start of the year, following a decline below 1.1000, with this mark acting as a resistance level on two occasions since then.
Currently, EUR/USD is resembling a triangle/flag pattern, suggesting a potential technical breakout. The looming question is: Which direction will the pair break out? There are arguments to be made for both sides of the equation, but perhaps the case for a break to the downside is more convincing?
Traders are pricing in an ~80% probability of a Fed rate cut in March. Simultaneously, an European Central Bank (ECB) rate cut for April is also on the horizon.
While both central banks might fail to meet these expectations, the likelihood that the Fed pushes back might be lower than that of the ECB.
According to Governing Council member Robert Holzmann, speaking at the World Economic in Davos, the prospect of ECB rate cuts in 2024 appears highly unlikely. At the same time, he emphasized the persistent threat of geopolitical conflicts, such as those in the Middle East, which pose a risk to Euro supply chains and energy markets. This ongoing uncertainty could exert pressure on consumer prices, creating a challenging environment that might interfere with any potential rate cuts from the ECB.

EURUSD Technical Analysis and Trade IdeaIn this video we take a close look at the EURUSD currency pair. We can see that this has been bullish on the higher time frame. We can see that it has traded into resistance, has also been range-bound since Friday and we are looking for a potential trade opportunity if market conditions are favourable. In the video we discuss price action, market structure, the trend and other important aspects of technical analysis. As always this information is for educational purposes only and not to be construed as financial advice.

EURUSD Longs from 1.08000 back upCurrently, EURUSD has been in a prolonged range, gathering significant liquidity. Given the current state of equilibrium, I am not actively seeking trades at this moment. However, I anticipate a potential move to unfold, continuing the bullish trend. For now, I will be patiently waiting for a breakout before considering any trading opportunities.
There is another plausible scenario where price breaks above to mitigate the 10-hour supply zone, leading to a bearish reaction. This possibility is valid, considering the imbalances just below that need filling and liquidity that requires sweeping.
My confluences for EURUSD buys are as follows:
- A 10-hour demand zone below triggered a new CHOCH to the upside.
- The overall short-term trend is bullish, aligning with this idea.
- Imbalance above the demand signals a favourable reaction at my POI.
- Abundant liquidity above, including trend lines and untouched Asian highs.
- Price needs to dip to a significant demand level for an upward rally to persist.
- I also expect the dollar to keep dropping indicating that EU will keep going up.
P.S. As price is still considerably distant from any nearby Points of Interest (POI), I am content to wait patiently and refrain from taking any immediate action until price triggers one of the levels I am monitoring.
Have a great trading week ahead!

EURUSD: Swing Sell Coming in| have a patience for it to happen|FX:EURUSD overall EU remain bearish after it rejected at previous high, EURO failed to gain control even after DXY plummeted, looking at the chart in 2 hour time frame, we expected price to rise up to fill the liquidity void and in that area we think there is huge amount of interest from sellers side.
what do you think of EURUSD do you think it will drop? Please like and comment your views let's discuss different bias.

EURUSD END-WEEK ANALYSIS 2 UPDATE 08/10/2023 Market Update: A Shift in EUR/USD Sentiment
As anticipated, we witnessed a small pullback in EUR/USD, hinting at a bearish trend resumption. However, the market structure has taken an unexpected turn. Heading into next week, I'll be shifting my focus towards long positions. Stay flexible, adapt to changing conditions, and, as always, manage risk diligently. 🚀💹 #EURUSD #Forex #TradingView #TradingStrategy
THIS IS THE SAME FOR ALL THE OTHER MAJOR PAIRS

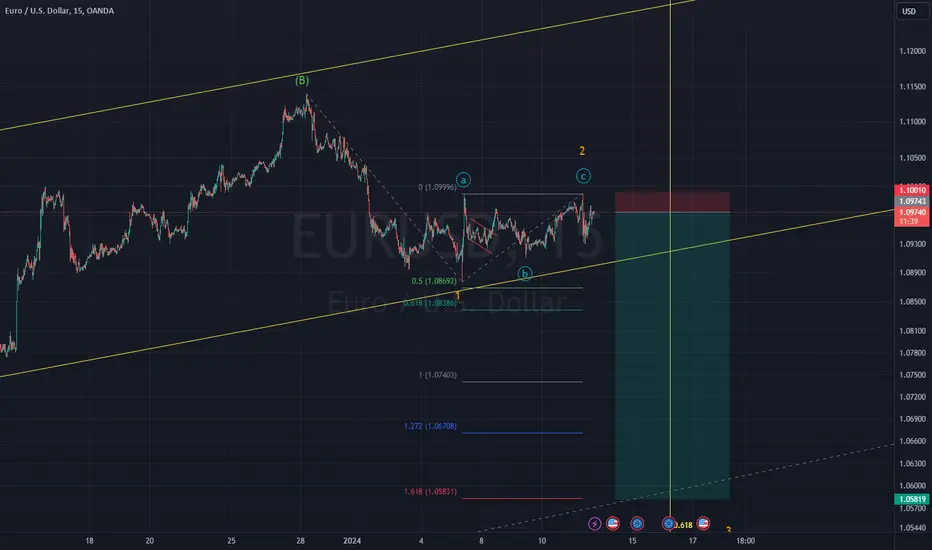
Short on the EURUSD I think wave 1 and 2 has already completed for the down trend so I'm taking a 14RR gamble to short from here.
EURUSD 11/01Pair : EURUSD ( Euro / U.S Dollar )
Description :
Completed " 12345 " Impulsive Waves at Previous Strong Resistance and making its " A - wxy " Corrective Wave. Bullish Channel as an Corrective Pattern in Long Time Frame and Consolidation Phase in Short Time Frame , Wait for the Breakout and Retracement

EURUSD What to expectThat's my view for EURUSD. Clean trendline, i am just waiting for a break and retest of it before considering to enter short. Opportunity looks good for entering now, but i prefer to wait. Invalidation will be above recent accumulation zone

EURUSD Technical Analysis and Trade IdeaWe can see that the EURUSD has traded into a strong resistance level after a bullish rally. In the video we take a quick look at the trend, market structure, price action and we discuss a possible trade idea. As always this is not to be construed as financial advice.

Will EUR/USD go to 1.1250? A detailed analysisHello traders and the entire Tradingview community! Previously on my EUR/USD
analysis from last week, I opened EURUSD long@1.0880 level when price dipped
during Friday's data release.
Currently, EUR/USD is well above the 1.09 level. From the chart, you can see that
price is consolidating at the lower trend line of the ascending price channel.
So, based on the price action , I believe EUR/USD is likely to go towards 1.10. A sustained
move above 1.10 will take the price towards 1.1250. My plan is to buy the dips
in EUR/USD.

EURUSD Weekly Bias - 07/01/2024After rallying to the 50% of the FVG last friday thanks to the NFP, I believe the break of structure on the Daily chart is confirmed. So we're going lower, first at the FVG around 1.085 then maybe the Order Block at 1.08.

EURUSD Longs from 1.09200 or @1.08000 Back upEURUSD shares a similar bias with GU, but the price exhibits more imbalances and liquidity at greater distances. While there is a 50-minute demand zone near the current price, I anticipate only a minor reaction from it. My primary buying opportunities are within the 10-hour demand zone, which offers a more discounted price.
Alternatively, there's a possibility that price continues its upward movement, reaching the 10-hour supply zone above. This represents a promising Point of Interest (POI) for me, where I expect price to undergo distribution before a potential sell-off. However, at the moment, I'm patiently waiting for price to accumulate within either of my demand zones to capture buying opportunities along this temporary bullish trajectory.
Confluences for EURUSD buys are as follows:
- Bullish pressure weakens, evident in a CHOCH and confirmed by a BOS
- A 11hr demand zone below triggered a break of structure to the upside.
- The market trend is bullish, aligning with this idea.
- Imbalance above the demand signals favourable reaction at my POI.
- Abundant liquidity above, including trend lines and untouched Asian highs.
- Price needs to dip to a significant demand level for an upward rally to persist.
- Lots of imbalances lying below that need filling before price continues to ascend.
P.S. Although my long-term outlook for this market remains bearish, I will be actively seeking buying opportunities for EURUSD as the dollar continues to exhibit a bearish trend.

EUR/USD needs to break this key level for further uptrendHello traders and the Tradingview community! Previously we had a great profit
by selling EUR/USD@1.1120 last week. Our target of 1.0940 was hit yesterday generating
more than 180 pips profit.
Currently, EUR/USD is consolidating around the mid 1.09 levels. The direction of the
next move will be determined by how price behaves around the 1.0965 mark.
If we see a strong bullish candlestick that breaks the key 1.0960 level, we can expect
1.10 and 1.11 very soon.
Currently, I have a couple of buys in EUR/USD from 1.0910 and 1.0930 levels. I will continue
to update the idea when I have a new entry.

💡 EURUSD: Forecast January 3The buyers were unable to hold the 1.10 resistance zone as the selling pressure rapidly increased, penetrating this resistance with a very strong force. It is likely that the price will continue to go down with these developments, the target is The next step will be around the lower border of the rising price channel. Trend followers patiently wait. If there is a notable price increase signal in this area, then they should consider entering new buying positions.

Analyzing the EUR/USD: Anticipating a Bearish Move Towards 1.07 In the current market scenario, there's a keen interest in the EUR/USD pair as it exhibits a potential bearish move. The price trajectory is notably approaching the crucial 1.07 level, following the formation of a distinctive right shoulder pattern.
Traders and analysts are closely monitoring this pair, anticipating and analyzing any forthcoming downside movements in the coming days. Stay tuned for insights and updates as the market dynamics unfold.

EURUSD 02/01Pair : EURUSD ( Euro / U.S Dollar )
Description :
Rising Wedge as an Corrective Pattern in Long Time Frame and Short Time Frame with the Breakout of Lower Trend Line. Completed " 12345 " Impulsive Waves and making its " A " Corrective Wave

EUR/USD breaks out! Real or another false breakout?Hello traders, EUR/USD has finally broken out of the resistance level
around 1.1020. In fact, as of now, price has breached the 1.1101 level as well.
However, keep in mind that this is a low-volume trading session due to the
Holidays. So, it could be a false breakout as well.
A week later when normal trading volumes come back, we might see EUR/USD
falling back below 1.10 again. I am watching out for potential sell entries
in EUR/USD. Technically, the next major resistance lies around the 1.1267 level

EURUSD: Another Bull Run Towards 1.1200?Dear Traders,
Happy Holidays,
EURUSD recently had some short of correction and now there is sign that price may push towards 1.1200 price area before the NFP next week. A proper risk managed entry can give you around 150 pips.
good luck and trade safe:
all the best for new year 2024 , may this year fulfil all your trading goals.

EURUSD: The fate of the USD depends on the Fed's 2024 movesThe US dollar has been relatively stable this year, having strengthened significantly following the Fed's rate hike in 2022, but could face downward pressure in 2024 if the Fed cuts rates as expected. . The dollar has fallen only 2% against other major currencies this year, its first annual decline since 2020, supported by strong U.S. economic growth and the Federal Reserve's efforts to keep borrowing costs high. Ta.
The Fed's surprising shift in stance came at its December meeting, when Chairman Jerome Powell suggested a sharp rate hike cycle that would send interest rates soaring to multi-decade highs was likely. It ended due to falling inflation. This has led to expectations for a 75 basis point (bp) rate cut next year, with the dollar weakening as lower interest rates generally make U.S. assets less attractive to profit-seeking investors. There is a possibility that Strategists are expecting a weaker dollar next year, but the possibility of an earlier rate cut could accelerate the dollar's weakness. But the strong U.S. economy could pose a challenge for those betting on the dollar. Kit Jacks, chief currency strategist at Société Générale (OTC:SCGLY), said aggressive monetary policy and growth stimulus in the US led to strong dollar strength. La, just like in the 1980s. Impending policy changes could eliminate some of these gains. The development of the dollar is particularly important given its central role in global finance. A weaker dollar could benefit the United States by making exports more competitive and increasing multinational corporations' profits when converting foreign earnings into dollars. According to FactSet, about a quarter of S&P 500 companies (INDEXSP: INX companies) derive more than half of their revenue from international markets.
A December survey of 71 foreign exchange strategists predicted the dollar would weaken against G10 currencies in 2024, with most of the decline occurring in the second half of this year. The outcome will likely depend on the relative performance of the US economy and the speed with which central banks around the world adjust their policies. The European Central Bank is resisting pressure to cut interest rates to fight inflation as the euro zone struggles with a deepening economic downturn. The euro has appreciated more than 3% against the dollar this year. In contrast, Neuberger Berman's Thanos Baldas remains bullish on the dollar over the next 12 months, citing continued weakness in economies outside the United States.


EURUSD Longs from 1.09600 up towards 1.11000My forecast for this week aligns with my plan for GU as anticipated, with some minor adjustments. The concepts remain consistent, but the positioning is extended due to the trend line liquidity near the current price. I expect this liquidity and the Asian low to be taken out, leading price down towards the 5hr demand zone.
Upon the formation of a Wyckoff accumulation pattern, I plan to initiate buy positions, targeting a move back up towards the 10hr supply zone located at the psychological level of 1.11000. This pair is currently favourable for me, exhibiting ideal price structure and aligning with a pro-trend perspective.
Confluences for EURUSD Buys are as follows:
- Unmitigated 5hr Demand zone has been left which caused a major BOS to the upside.
- Temporary trend is also bullish as price has broken structure once again.
- DXY is still looking bearish meaning that EURUSD is expected to rise.
- Trend line on top of demand is a good sign as price will sweep liquidity before entering.
- In order for price to continue in its bullish course, it must ideally react off a demand level.
P.S. While I anticipate an initial drop to mitigate the demand, I acknowledge the possibility of remaining upside. This could lead price to react off the 10hr supply, subsequently eliminating the trendline liquidity below.
HAPPY NEW YEARS TO ALL OF YOU AND HOPE THIS YEAR BRING EVERYONE PROFITABILITY AND CONSISTENCY. LETS CATCH THESE PIPS!

GBPUSD: - A Detailed Analysis of Market Structure and FibonacciWelcome to my TradingView profile! In this article, we will embark on a journey together to explore the intriguing prospects of EURUSD, guided by the fundamental principles of market structure and Fibonacci retracement. I invite you to join me in analyzing one of the most traded currency pairs.
Our primary instruments will be market structure, the identification of the trend direction, and the application of Fibonacci levels. We will delve into how these factors can provide meaningful insights for making informed trading decisions.
he inclusion of detailed charts and illustrations will aid in visualizing the discussed concepts. We will explore key Fibonacci retracement levels and how they interact with the overall market structure.
This will be an informative article, focusing on understanding the market context and applying fundamental concepts of technical analysis. The goal is to provide a clear perspective and stimulate critical thinking within our trading community.
If you find this analysis valuable, I encourage you to subscribe to stay updated on my latest posts and market analyses. This is just the beginning, and subscribing will allow you to be among the first to receive updates and trading ideas.
Feel free to make any adjustments or let me know if there's anything specific you'd like to modify!
