EURUSD Longs from 1.07000 up to 1.08800This week's forecast for the EURUSD aligns with the breakdown observed in GBPUSD, indicating a positive correlation between these pairs. In the case of EURUSD, I anticipate further downward movement to reach a 19-hour demand zone. Following this, I expect a bullish reaction, propelling the price upward towards a more favorable supply zone for a potential sell-off.
Additionally, there is significant liquidity positioned above the current price, providing an additional rationale for a retracement. Given the recent bearish trend, I foresee an impending pullback, which I anticipate will occur during this week.
Confluences for EURUSD Buys are as follows:
- Price entering a 19hr demand zone that caused a broke of structure to the upside on HTF.
- There lots of liquidity lying above in the form of Asian highs and trendline liquidity.
- Price has been moving bullish the last couple of weeks and I consider this a pro-trend trade.
- The DXY (Dollar) is also temporarily bearish which means I'm expecting this pair to keep going up.
- The imbalances that were left previously have now been filled so price could be ready to retrace.
P.S. Although I am currently seeking buying opportunities in the demand area just below the current price, it wouldn't be surprising if the price decides to drop further to reach a more affordable zone. This adjustment could potentially result in an improved bullish position. Additionally, upon entering a supply zone, I anticipate the price to sustain a bearish trend, given the prevailing bearish sentiment in the overall market for the EURUSD.
Eurusdtradeidea

EURUSD - might fall off a cliffJust thought id share my big brain move.. could be completely wrong but here are my thoughts
EURUSD just did a massive retracement to its previous lows on the monthly
We can see there was a trendline break which signals the start of a down trend
And a closer inspection on the daily shows a structure break... will be interesting to see how this plays out

EURUSD resume uptrend?EURUSD's daily chart showcases a strong bullish momentum, with a notable opportunity for a sustained buy position identified at the highlighted demand level in blue. This level, signaling a concentration of unfilled orders, suggests significant underlying strength. The envisioned long-term target for this buy position aligns strategically with the supply zone at the chart's pinnacle.
Investors eyeing potential opportunities in the currency pair may find the current bullish trend compelling, with the highlighted demand level serving as a promising entry point. The anticipation of continued upward movement is supported by the concentration of unfilled orders at this level, reinforcing the potential for a sustained bullish trajectory with the long-term target aligned to the supply zone at the chart's upper extremity.

EURUSD Technical Analysis And Trade IdeaExploring the EURUSD currency pair's current dynamics, our analysis unveils a prevailing bullish trend across higher time frames, particularly evident on the monthly and weekly charts. Our focus shifts to the daily time frame, strategically aiming for an optimal entry point. At this juncture, the price has undergone a significant swing and is now undergoing a retracement phase.
Our keen attention is directed towards pinpointing a retracement within the 50% to 61.8% Fibonacci retracement zone – an area we favor for entry. We look at both a 1D and 4H timeframe scenario. This video meticulously breaks down price action, market structure, and overarching trends, shedding light on critical facets of technical analysis.
Throughout this presentation, we delve deeply into pivotal aspects such as market structure, nuances of price action, trend dynamics, and other indispensable technical analysis components. It's crucial to emphasize that this content is for educational purposes. However, it's imperative to avoid construing it as financial advice.

💡 EURUSD: Analysis on December 4OANDA:EURUSD Analysis on December 4
EURUSD is moving down in price, although the bottom has just been formed and the momentum is not really strong, but we can still watch for selling.
The nearest resistance area is around 1.0950. If the price returns to this area, we will look for opportunities to sell.

buy limit in eurusd minimo RR 1/3We have a change in structure in low times so it is likely that we will go to take liquidity up a mini-scalp

EURUSD - D1\H4EURUSD
D1 – The price has broken the trend line, which may indicate a potential downward movement, for this it is better to wait for a correction for confirmation and a three-wave structure to consider selling.
H4 – The price may continue to fall, we should also expect a correction when the trend line is broken, the target for the correction is 1.09615. The risks should also not increase for a corrective movement.
What can you expect?
You can consider entry from the level ~1.08759 – 1.08943 with further movement to the target 1.10026. Cancel the idea so as not to take increased risk at the idea levels beyond the end of the 2nd wave - 1.08495 or 1st wave - 1.08279.
Long
Targets 1.09080 – 1.09357 – 1.09615 – 1.10026

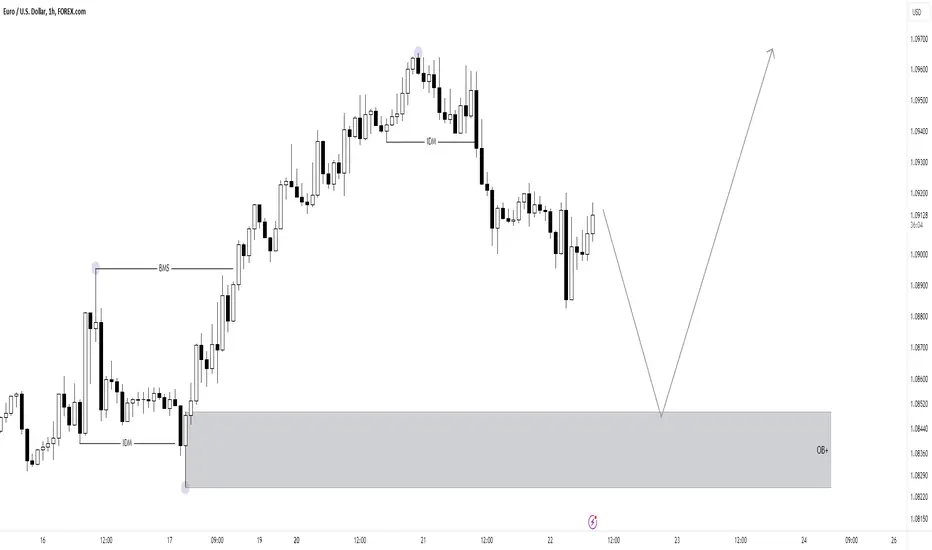
EURUSD Shorts from 1.09700 or 1.11000EURUSD presents an intriguing scenario as it recently responded to a 10-hour demand zone, potentially signaling another upward rally. Since clear buying opportunities are currently lacking, I'll be patient and wait for the price to enter a supply zone, providing a chance to catch a potential pullback. However, it's worth noting that these zones are not the most optimal due to the substantial liquidity present.
My preferred zone is the 8-hour supply at 1.11000, coinciding with the 0.78 Fibonacci range on a higher timeframe. Here, I anticipate a robust bearish reaction. At present, I will monitor the price for the completion of a Wyckoff distribution before considering sell positions. Alternatively, I'll await the establishment of a new demand level, providing a new buying opportunity in which we can take towards the marked supply (POIs).
Confluences for EURUSD shorts are as follows:
- Overall trend of the market is bearish on the higher time frames.
- Price approaching a very good key level of supply, anticipating a distribution to play out.
- Lots of liquidity below to target in the form of asian lows, equal lows and imbalances.
- DXY is also overall bullish long term despite the short term bearish trend.
- In order for price to push higher it needs to retrace from a level of supply.
P.S. won't dismiss the chance of this demand zone failing, considering that the price has mitigated the second time it has now created relative equal lows. Moreover, there's a direct imbalance below that price may seek to fill before initiating another decisive upward move. However, given the current state of the EU market, adaptability is crucial, given the presence of numerous liquidity areas and zones of lower quality.

my expectation of entries in eurusd for tomorrowFor me the EURUSD has risen quite a bit, what it should do is go down to take more liquidity, don't forget it is a matter of probability

EURUSD Top-down analysis Hello traders, this is a complete multiple timeframe analysis of this pair. We see could find significant trading opportunities as per analysis upon price action confirmation we may take this trade. Smash the like button if you find value in this analysis and drop a comment if you have any questions or let me know which pair to cover in my next analysis.

Eurusd November 23' ☄️Hey All. Thanks for stopping by to check out the Analysis.
Eurusd is approaching the top side of the range (1.1022) and so we must be aware, as we move out of November, that long orders from here may not be the best idea. I know there are traders who are long from the bottom of the range (1.05705) and you don't think they are thinking of taking a 300 pips profit? Anyways cheers and please leave youyr feedback below.

EURUSD possible buy zone!Recently, there was an anticipation of a pullback or correction in the EURUSD currency pair. This correction was expected if the current peak reached the level of 1.10000. However, the US dollar strengthened without a deceptive upward movement, compelling its major rivals to retreat. Despite this, an overshoot is anticipated, likely leading to the subsequent (deeper) downward correction.
Towards the end of this week, on Friday, significant economic data is set to be published. Special focus is on data from the United States, and, of course, the attention-grabbing speech by the head of the Federal Reserve.


EURUSD Possible buy zone!The EUR/USD currency pair is poised for significant developments in light of upcoming news and signals from the Federal Reserve indicating the possibility of interest rate reductions. This suggests that there could be notable shifts in the exchange rate between the Euro and the US Dollar in response to these factors.

EURUSD: Low valuations of euro zone bank stocks could hamper creThe European Central Bank (ECB) on Monday expressed concern about the low valuations of euro zone bank stocks, suggesting it could have a negative impact on future credit growth. Hybrid by imposing strict conditions on the borrower. Bank profits have increased significantly this year, thanks in part to higher net interest income due to higher ECB rates, but stock market valuations have not kept pace. Many banks appear to be trading at a discount to fundamentals.
The ECB has pointed out that this could lead to financial system instability in the long run. Banks that are undervalued by investors may struggle to raise new capital when they need it, the ECB said in its financial stability review report.
The central bank continued to insist that weak valuations directly lead to tighter financing conditions for the real economy. We find that banks' increased exposure to corporate credit risk and the perception of bank stocks as value stocks are major contributors to valuation stagnation.
However, the ECB also noted that these fundamentals do not fully explain current valuations. Increased uncertainty regarding future payments to shareholders may also be a factor. Meanwhile, some euro zone governments have introduced banking taxes and the ECB is considering raising interest-free reserve requirements, which could lead to lower revenues. The ECB argues that the tax risk on dividend income sources impacts valuations more than on growth stocks, whose cash flows are expected to be reinvested internally and returned to investors in the future. Far away.

Short Opportunity on EURUSD 1H wih +90 pips According to ABCD Paterne
According to Divergence
To CCI Level Below Zero Level

EURUSD Longs from 1.09000 up to 1.10000EURUSD is looking very good in terms of entering high quality POI's and it is following the temporary bullish trend very well. So from this we will try to catch pro trend trades up to the daily supply or ideally the 8hr supply zone on top of it. As of now, price has created a small BOS to the upside so I will be waiting for a small pull back to the 12hr demand in order to buy up.
As price Is near a decent amount of liquidity I would like to wait for a clean CHOCH and for a spring to take out any remainder asian lows for me to consider a buy opportunity. However, as there's major news this week like NFP, so I would approach any potential setup with caution and lower my usual risk size.
Confluences for EURUSD Buys are as follows:
- Temporary trend for EU is bullish and this follows the trend as well as the DXY bias.
- In order for price to make a bearish move it will have mitigate the daily above or the 8hr supply.
- There's asian high above that hasn't been taken which is liquidity that needs to get swept.
- Price keeps breaking structure to the upside and candles on HTF are very bullish.
- Momentum is starting to slow down as it has currently reacted to a 4hr supply.
- In order for price to continue going up it must come down in the form of a pullback so we can create a new leg to the upside.
P.S. The Wyckoff accumulation is still pending as I'm waiting for price to mitigate my zone, sweep liquidity and change character to the upside. I am also aware price could fall lower due to the ineffeciencies below and then tap into a cheaper zone for buys back up.

EURUSD I Pullback and more potential growthWelcome back! Let me know your thoughts in the comments!
** EURUSD Analysis - Listen to video!
We recommend that you keep this pair on your watchlist and enter when the entry criteria of your strategy is met.
Please support this idea with a LIKE and COMMENT if you find it useful and Click "Follow" on our profile if you'd like these trade ideas delivered straight to your email in the future.
Thanks for your continued support!


EURUSD: Potential to turn BEARISH!Thd D1 swing structure is bearish, having made a bearish BOS externally. Internally, price is bullish, having successive iBOSs to achieve the pullback to an internal LQ target.
Price has reached a premium supply zone, a high probability location to look for a shift
in the market from bullish to bearish, starting the next bear leg to make the HTF LL.
If you like the analysis, tap the LIKE or BOOST button.
If you want to see more free analysis, consider subscribing to my channel.
Thank you.
May profits be upon you.

EURUSD: 22/11/2023: It looks bullishYou can see all the important levels and zones on the chart.
If you have a question feel free to ask.
💡Wait for the update!
🗓22/11/2023
🔎 DYOR
💌It is my honor to share your comments with me💌
EURUSDPair : EURUSD ( Euro / U.S Dollar )
Description :
Impulse Correction Impulse , Completed " 123 " Impulsive Waves at Fibonacci Level - 61.80% or Daily Demand Zone and Rejecting with Strong Bearish Price Action with Divergence in RSI. If it Rejects then Sell after Retest
Entry Precautions :
Wait for the Breakout or Retracement
