EURGBP Long: EW Expanding Triangle to GartleyHey traders, potential expanding triangle here to complete potential Gartley pattern and continue the correction. The stop is tight, any drop below "e" could mean a deeper correction. Happy Trading!
EW

EURUSD Long: Using Elliott Wave Theory to Maximize R/RHey Traders! I wanted to publish an example of using EW theory to set a tight SL and maximize risk/reward. Here we have a potential correction off of a strong bearish impulse. There are a few possible scenarios lining up for the corrective structure that follows. Our preferred scenario in this case is if the last leg is in fact a b wave and the "c" will continue to complete the correction before continuing downward. If this is the case, a great TP level would be the Gartley completion and thus a stop below b will get us out quickly. Of course, with all predictive analysis, this could continue past our stop and complete wave ii which we will then re-analyze. The idea here is utilize the edge of R/R and size your trades accordingly.
Happy Trading!

Gold Going Bull? Waiting on 5th Wave Completion (still).Everything is in the chart. Complete 5th wave, correction to fib level. Turn upward in support of new bull. If correction is lower than 1303, bull is invalid. This is an update with larger timeframe of the earlier chart. Much is the same.
The unfinished legs are for reference. The values of correction are close, the time will be off. The values of the next impulse wave is just for reference of overall direction.

GBPJPY - No more long trades on this pair??May be there are no more long trades on this pair left for coming years. Although the retracement is little less than 61.8%, but on the other hand, red trendline is also broken but still there might be one pending leg up. IMHO, most probability goes for Bearish trend because there is nice bearish divergence on MACD as well.
(This is Monthly time frame chart, good for long term perspective only ! )

GOLD'S BIGGER PICTURE ON DAILY CHARTOverall, I still see EW taking us lower. We are currently in an intermediate upward cycle from 1315-8 to 1327-9 before it takes us to new lows.
I'll post lower timeframe charts below as we have a bull run until back on track for bear.
BULL: now, 1315/18 to 1327ish.
BEAR: after that target reached or close, we'll head back south 1310, first part of wave 5 complete.


AUDUSD: Short-term Elliott Wave AnalysisThere must be a comprehensive text, but I'm too lazy to write it.

USDJPY: Short-term Elliott Wave AnalysisThere must be a comprehensive text, but I'm too lazy to write it.

AUDUSD: Short-term Elliott Wave AnalysisThere must be a comprehensive text, but I'm too lazy to write it.

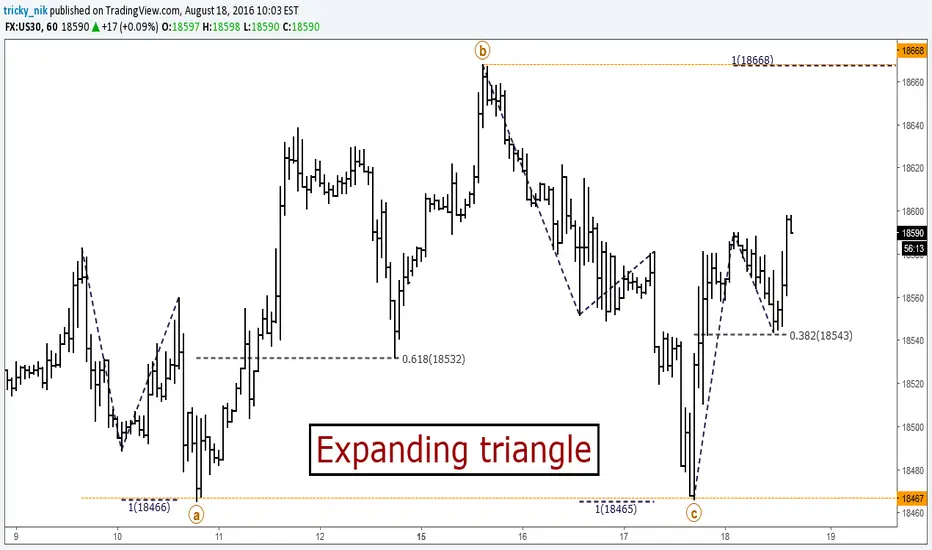
US30: Short-term Elliott Wave AnalysisThere must be a comprehensive text, but I'm too lazy to write it.

EURUSD: Short-term Elliott Wave AnalysisThere must be a comprehensive text, but I'm too lazy to write it.


Nat Gas Fast Move Down Continuation Nat Gas trend has been down for two years now, and the small corrective cycle in a bearish trend has ended.
Chart had a small corrective wave (last move truncated) and I'm targeting a fast move to $1.50 for my first target with a small bounce to near $2.0 support turned resistance and a final blow to $1.05.
Nat Gas fast move lower will effect oil prices.

EURUSD: Short-term Elliott Wave AnalysisThere must be a comprehensive text, but I'm too lazy to write it.

