$PFE sideways combo almost done. 5/15m tf swing long$PFE sideways combo almost done. 5/15m tf swing long
EWT

Energy Web Token + simple TA.Hello again, I like to bring you something from DeFi.
Today, it will be EWT, actually rank 52.
It's not yet listed at many exchanges with decent total supply.
EWT focuses on building core infrastructure and shared technology, speeding adoption of commercial solutions, and fostering a community of practice.
In 2019 EW launched the Energy Web Chain, the world’s first open-source, enterprise blockchain platform tailored to the energy sector. EW’s technology roadmap has since grown to include the Energy Web Decentralized Operating System (EW-DOS), a “blockchain-plus” suite of decentralized solutions.
If you make a deep DYOR, you can found strong fundaments and connections to Tesla, Berkshire Hathaway, Shell, and list going on...
TA
Since EWT listed on KuCoin. we have yet no too much price action history. So let's see, what could be find at 4H timeframe.
From the end of August, EWT created downtrend regression channel. Every test at the top of channel & MA50 was rejected.
Here isn't displayed the whole chart history of EWT. Strong rally was done from 0.80 usd to 12 usd. There is for sure a much more space to fall down. That's the reason, why my Fibo is reversed and I am staying neutral before something happen .
Energy token made few gaps. 8.26usd is filled, 11.64usd is above. From September 5, EWT started to create low highs and higher lows in symetrial triangle ( pink ) and target could be exactly around gap above at 11.64 usd. It's also near my 382 Fibo level.
For start some uptrend, conditions in a next days are:
- hold around 786 Fibo
- upside breakout from the pink triangle
-get about 50MA (red) = also matching with the golden fibo area
That's all. I will try to update.
*This is not a financial advice.

ESCORTS: TRACTOR has startedPLEASE SEE CHART FOR DETAILS
TARGET 1 : 1250
TARGET 1 : 1300
STOP LOSS : 1150
**These are my personal observations. Please trade at your own risk.**

$BTC $1,7xx lets gooo!!!! no triangle here (long term count)how often do you see hidden bearish divergence (weekly) after wave D of a wave 4 triangle? looks like a 5 wave structure to finish a flat.


Energy Web Token is something else!Energy Web Token (EWT) is one of the most interesting projects out there. It has been growing recently very well and i am expecting it to be in top 10 cryptocurrencies.
During next two weeks there is high possibility it will reach to fib 1.6. EWT showed great resistance to BTC bearish movements which means there is no interest selling EWT and people are just trying to accumulate more.

EWT Energy Web Token - Uptrend continuation?In an uptrend, showing signs of continuation.
Potential targets shown - not financial advice.

use stopless but... "ENERGY WEB NEXT LEG UP?!?!" Already has pumped 76% in 7 days but whos counting :P. I feel like there is some driving force of adoption or partnership I'm not seeing but with the way this baby skips across the 50 EMA all the time. I can't help but wonder if this graph shows this WOUND UP yet again. I am going to place a small wager with stop loss because I believe its ready to fire one more time before pull back. BE CAREFUL AND DYOR!!!

$ES/M2 - Correction Still in Play? Inspired by @HRXOLABS post LINK
i decided to apply EWT and I think we may have one more pullback before the monster rally.

✳️ Energy Web Token [EWT/BTC] on July 21 #EWT $EWT #EWTBTCEWT is moving in some pretty good patterns and preparing to breakout and rising to the 80000sts zone
In case EWT falls out of the support zone of 57000sts, you can considier buying when it returns to the 40000sts zone

$SLV SILVER LONG TERM VIEW ~5-10 years Elliot Wave Theory EWTconsidering how long the initial move down took, i'd think the last wave down before we complete the correction that began in 2011 may take just as long or longer? still think pivot at median line of channel and those fibs though.

XRP's EWT Count until EOY --> $0.8 TargetI believe XRP has bottomed in March 2020 capitulation and has begun its 1st wave out of 5 long-term bull market waves going into 2021-2022.
Wave 1 began in March and completes around EOY at around 80 cents.
Fibonacci extensions and Elliot Wave theory is used to predict levels and targets.
I present the subwaves of each of the 5 waves that comprise the macro Wave 1 ending EOY.
Cheers,
Leb Crypto

WMT - Likely Breakout to new ATHWMT has seen some serious bullish price action sparked by their recent announcement o a subscription service that puts them in somewhat direct competition with AMZN. This appears to have started a whole new wave of impulsive price action. It faced rejection today after reaching the previous all-time-high and barely breaking past it.
Price Point of Invalidation: $128-127 zone
Price target: $137.50

GSX - Impulse Almost CompleteGSX has had a run that has seemingly defied logic to some bearish investors, but the overall move it made after clearing the previous ATH was relatively healthy. Despite a massive bear campaign a few months back the stock has churned to massive new highs. However, all good (or bad if you're a bear) things come to an end. It is now due for a correction, and will likely find a topping point around the 71.21 level. This leaves the ideal opportunity for shorting.
Impulse price point (top): $70-$71.21
Overall corrective target: $49.14

NKLA - Corrective Wave Finished - New Impulse?NKLA has been coming down for sometime now, but the appropriate corrective wave has finished. We're now awaiting a new set of corrective waves before we can make new price target predictions. Very likely a quick scalp opportunity is here.
Price point of Invalidation: $40-$42 range
Quick Scalp Take Profit: $50-$52 Range


S&P500 Primary Elliot Wave count.Y wave went 0.618 to the tick.. w/ the hidden bullish divergence im leaning more bullish combined with the fact we didn't go 90%+ to meet the strong guideline for an X wave which would likely make this an expanded flat to complete 4 of the impulse that began in 2009.
still holding my $SNAP puts waiting to see how Monday plays out.

Part 2: GBPUSD, EWT Sell at Top at 3rd Wave. High Probability Trade Setup:
Sell at the Top 1.27989/1.28419 for targets 1.27048/1.26149/1.25842
Kindly, share your LOVE , by giving LIKES and Comments .


SP500 - Alternative path to 4100Earlier this week I posted how the SP500 will likely move sideways in a triangle for about a year before it starts the 5th and final wave of this historic bull market towards 4100+.
Today I'm posting my alternative wave count where the 5th and final wave is an Ending Diagonal. In both scenarios, I think we have a final wave up towards 4100 and both scenarios have choppy up and down action ahead. This scenario isn't my preferred scenario but it is another possibility.

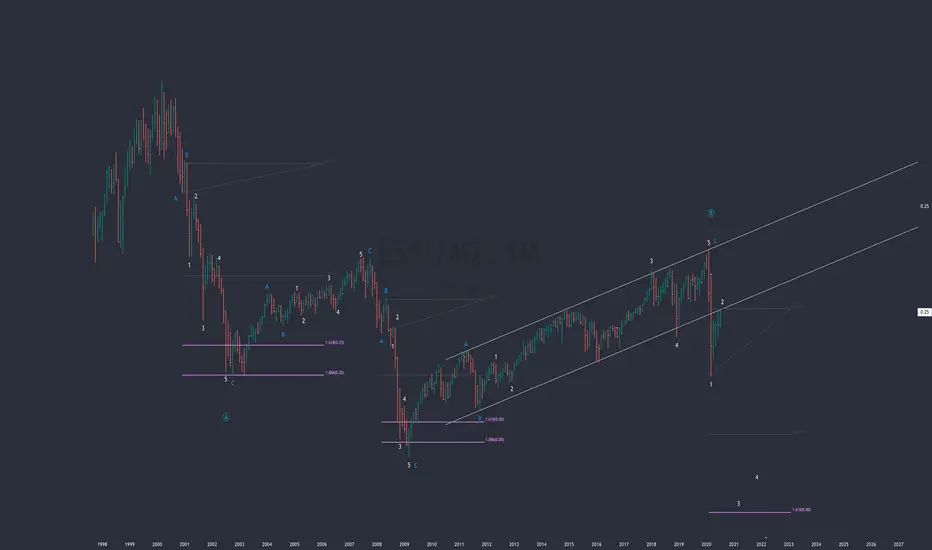
SP500 to 4100+ after a year of sideways movementAlthough my 2019/2020 target of 3200 was met, I do not like any impulsive interpretations of the rally in 2019. Therefore, I believe we are still in a major correction that started in 2018. According to the way the structure is playing out, my bet for 2020 is sideways movement through that large triangle that will eventually give way to a 5th wave rally to 4100+.
Of course, it is possible that we have perhaps completed the bull market and are starting a new bear market. However, the weight of the evidence at this point suggests the probability that we have started a new bear market is very low.

