Trend Line Tested Twice Is AUD/USD Ready to Rally?📈 AUD/USD Market Insight – Potential Bullish Breakout Ahead?
The AUD/USD pair has respected a key trend line, bouncing off it for the second time — a sign of potential strength. If the price revisits and successfully retests this trend line, we could see a bullish momentum (a pump) play out.
On the flip side, if the pair maintains its current trajectory without pulling back, focus shifts to the 0.65415–0.65455 resistance zone. A clean breakout above this range could open the doors for a move higher — potentially targeting swing highs and key liquidity zones.
🚀 Watch closely — the next move could be significant.
🔎 Always DYOR (Do Your Own Research). This is not financial advice.
Exchange

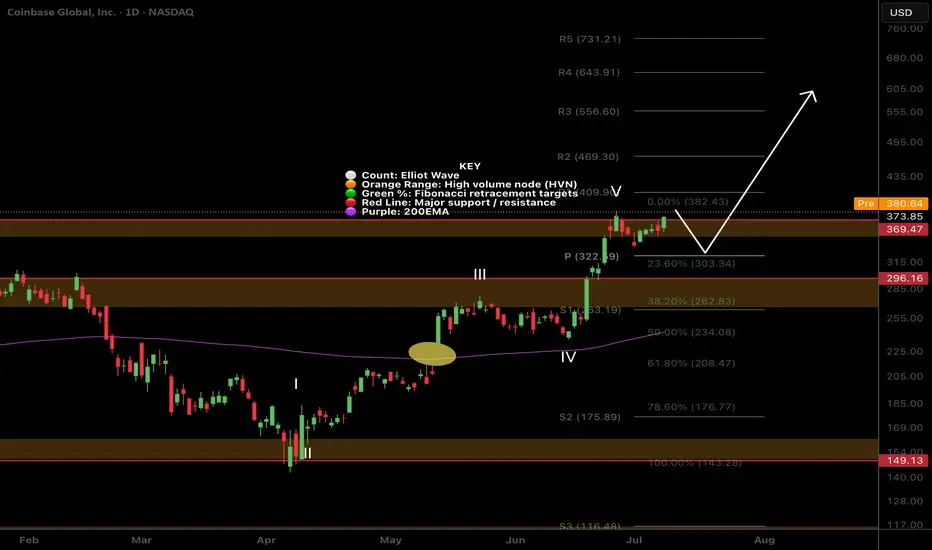
$COIN Price discovery?I was looking for a deeper pullback on NASDAQ:COIN but it appears to be heading into price discovery!
The pivot at $322 was my target but sentiment must be bullish if investors are impatient! Still... i wouldn't count out another sell off as a bear trap on a poke above the swing high.
Safe trading
Why? Because liquidity is building at this support zone.🚨 GBP/JPY Traders — Don’t Get Trapped! 🚨
GBP/JPY has just touched a major support level, and on the surface, it looks like a golden buying opportunity. But here’s the catch: this is exactly where most retail traders get trapped.
Why? Because liquidity is building at this support zone. Smart money knows retail traders have stop losses and pending orders sitting right below — and they’re coming for it. 🧠💰
Here’s what the market is likely to do next:
📈 Step 1: A small bullish bounce to lure retail traders in. Everyone starts thinking, “This is the reversal!”
🔄 Step 2: Boom — a sharp move down. Stop hunts. Fakeouts. Panic sells. The market dips below support, grabbing liquidity.
🚀 Step 3: Once liquidity is swept and BPR (Break Point Range) is hit, then the real move begins.
This is a classic setup — trap retail, feed institutional orders, and then drive the market in the true direction.
⚠️ Don’t fall for the bait. Stay patient. Let the trap spring before you strike.
📊 Watch structure. Watch liquidity. Watch price behavior. That’s where the edge is.
DYOR — Do Your Own Research. This isn’t financial advice — it’s a trader’s insight.
Trade smart. Trade sharp. 💼🔥

HOOD (Robinhood) - Price Above Bollinger Band and Shooting StarsHOOD (Robinhood) stock price has been in an uptrend since May 2025.
Recent fundamentals such as corporate earnings, EPS, Revenue, Acquisitions have been good in Q2 2025.
However currently, HOOD price has printed 2 shooting stars above the upper bollinger band and linear regression lines (blue arrow).
Potential selling and profit-taking could occur, especially if there is a significant bearish catalyst or news in the stock market.
A -4% or -8% move selloff could occur over time if the price gaps up to an overextended level too fast, such as $80 to $85.
Both the weekly and daily charts are starting to show bearish divergence so I am watching both the technicals and fundamentals this month.

Free signal todayHello friends
Given the good growth, now the price is correcting and we can buy within the support ranges with capital and risk management and move with it to the specified targets.
*Trade safely with us*

Czech Republic: A Dividend HeavenThe Prague Stock Exchange (PSE) PSECZ:PX is characterized by a concentration of mature, dividend-paying companies, particularly in sectors such as energy, banking, and heavy industry. Unlike growth-focused exchanges in the U.S. or Asia, the Czech market offers relatively few stocks with high reinvestment or expansion trajectories.
Preference for Payouts
Over the past two decades, Czech listed companies have consistently distributed a significant share of profits as dividends. This reflects both limited reinvestment opportunities in a relatively saturated domestic market and a shareholder preference for cash returns. For example, CEZ and Komercni banka have maintained payout ratios above 70% in most years.
Structural Support & Tax environment
The Czech Republic provides a structurally supportive environment for dividend-oriented investors. One key advantage is the tax framework. Czech residents are exempt from capital gains tax if they hold an investment for more than three years. This strongly favors long-term investing.
For non-residents, a 15% withholding tax on dividends applies—unless the investor resides in a country outside the EU/EEA that does not have a tax treaty or tax information exchange agreement with the Czech Republic.
Key Dividend-Paying Companies
CEZ (CEZ) PSECZ:CEZ
Industry: Energy (Electricity generation and distribution)
Dividend History (Gross per Share) / Dividend Yield (%)
2020: CZK 34 10.1%
2021: CZK 52 5.8%
2022: CZK 48 18.83%
2023: CZK 145 5.43%
2024: CZK 52 5.9%
Dividend Growth:
2020 to 2021: +52.9%
2021 to 2022: -7.7%
2022 to 2023: +202%
2023 to 2024: -64.1%
Komercni banka (KOMB) PSECZ:KOMB
Industry: Banking and financial services
Dividend History (Gross per Share) / Dividend Yield (%)
2020: CZK 23.9 3.63%
2021: CZK 99.3 10.62%
2022: CZK 60.42 9.22%
2023: CZK 82.7 11.41%
2024: CZK 91.3 10.76%
Dividend Growth:
2020 to 2021: +315.6%
2021 to 2022: -39.2%
2022 to 2023: +36.9%
2023 to 2024: +10.4%
Moneta Money Bank (MONET) PSECZ:MONET
Industry: Banking and financial services
Dividend History (Gross per Share) / Dividend Yield (%)
2020: CZK 0 (dividend suspended)
2021: CZK 3 10.67%
2022: CZK 7 10.53%
2023: CZK 8 12.82%
2024: CZK 9 8.08%
Dividend Growth:
2020 to 2021: N/A
2021 to 2022: +133.3%
2022 to 2023: +14.3%
2023 to 2024: +12.5%

CRO - Building Block!Hello TradingView Family / Fellow Traders. This is Richard, also known as theSignalyst.
Let’s keep it simple!
📈 Short-Term Bullish:
CRO is currently hovering around a key weekly support level. As long as the $0.07 support holds, we can look for short-term long opportunities.
With bullish momentum picking up, the next target/resistance is around $0.11 (marked in blue).
🚀 Long-Term Bullish:
For the bulls to fully take control and aim for the next major resistance at $0.163 (marked in red), a confirmed breakout above the $0.115 level is needed.
📚 Always follow your trading plan regarding entry, risk management, and trade management.
Good luck!
All Strategies Are Good; If Managed Properly!
~Rich

Trading opportunity for UNIUSDTBased on technical factors there is a Buy position in :
📊 UNIUSDT
🔵 Buy Now
🪫Stop loss 5.450
🔋Target 7.070
📏 R/R 2
💸RISK : 1%
We hope it is profitable for you ❤️
Please support our activity with your likes👍 and comments📝

OKBComprehensive OKB/USDT Analysis
🟢 Introduction:
The OKB token, native to the OKX exchange, is currently moving within a well-defined ascending channel. This analysis examines the price behavior within the channel and highlights Fibonacci targets. Precision in decision-making is crucial at this key juncture.
🔍 Technical Analysis:
1️⃣ Ascending Channel Status:
Current Movement:
The price, after hitting the midline of the ascending channel, has entered a correction phase and reached the daily support zone at $42.85 - $44.53.
Channel Significance:
The ascending channel is a critical structure for OKB. A breakout to the upside will face resistance but could trigger a strong bullish move if successful.
2️⃣ Possible Scenarios:
A. Bullish Scenario (Resistance Breakout):
Key Resistance Zone: $59.52 - $68.95
Fibonacci Targets in the Ascending Channel:
1.618 Level: $95.15 - $113.84
2.272 Level: $145.12 - $173.63
2.618 Level: $192.96 - $230.87
Sharp Movement:
A breakout above the channel could lead to a rapid and powerful move toward higher targets.
B. Bearish Scenario (Resistance Rejection):
If the price fails to break the red resistance zone, a decline toward the channel bottom and the gray support zone ($32.07 - $35.57) becomes likely.
3️⃣ Relative Strength Index (RSI):
Current Position: RSI is within a descending channel, sitting near its midline.
Bullish Potential: Support at this level could strengthen the move toward the channel’s top and higher targets.
📌 Recommended Entry Points:
Safest Entry: After a breakout above the red resistance zone ($59.52 - $68.95) and price consolidation above it.
Stop Loss: Below the gray support zone ($32.07 - $35.57).
Volume Confirmation: A valid breakout must be accompanied by an increase in buying volume. Breakouts without volume confirmation are likely to be false.
⚠️ Key Risk Management Tips:
Stop Loss: Ensure stop-loss orders are placed within the suggested zones.
Confirmation: Wait for a valid breakout and price stabilization before entering a trade.
Capital Management: Adjust trade size based on the sensitivity of the analysis to effectively manage risk.
✨ Final Conclusion:
Bullish Scenario:
If RSI support holds and buying volume increases during the resistance breakout, the price may move toward higher Fibonacci targets.
Bearish Scenario:
Failure to break the resistance could lead to a price drop toward the channel’s bottom and the gray support zone.
📊 Recommendation:
To minimize risk, only enter trades after observing a valid breakout and price stabilization in key zones. Decisions based on volume confirmation and breakout validations are crucial in this analysis.
🌟 Note:
This analysis is based on current market data and requires continuous monitoring for updates.

Reasonable purchase...hello friends
By examining the LDO currency, we came from the DEFI field.
This coin is generally in a range and by making its bottom it was able to experience an upward growth.
If you bought this currency in Polback to Gap, and you are now in profit, if you want to buy this currency, this is a logical step to enter.
If the market corrects, you can buy again.
But in case of successful failure of your limit, you can make another purchase in pullback.
Note that this currency has not yet started its growth...

Regular and principled...hello friends
We came up with FANTOM currency analysis.
This potential coin, which is active in the DEFI field, has been able to grow well by forming an upward channel.
Now we have specified the purchase limits for you in case of modification.
Now it is logical to buy one step, but in case of correction, we can wait until the specified areas and then make our purchase.
But in case of successful failure of the channel, we can still buy and move with the specified goals.
Note that this coin has a high growth potential....

Uniswap (UNI)UNI/USDT Analysis 📊
UNI is one of the significant assets in the cryptocurrency world, attracting considerable attention from investors due to its high trading volume and dynamic network. This analysis aims to examine UNI's price movement within an ascending channel and highlight potential trading opportunities:
⚖️ Current Status:
Recent Correction:
After hitting the top of the ascending channel, UNI has corrected towards the 0.5 Fibonacci level (between $11.5 and $11.1), which overlaps with the channel's middle line.
This overlap is significant for traders, as it confirms the strength of support and resistance in this range.
Key Supports:
Two grey zones at the bottom of the chart are considered vital support areas:
$5.2 to $6
$3.6 to $4
These zones are recognized as strong support areas due to the multiple reactions of the price in the past. In UNI's trading history, these levels have successfully prevented sharp declines and have created high demand in these ranges. Additionally, the presence of large buyers in these areas shows their credibility.
RSI and Divergences:
The RSI is currently in an ascending channel, but it recently reversed before reaching the top of the RSI channel, forming a negative divergence. In the past, such divergences have often led to temporary corrections or even trend reversals in UNI's price. These behaviors suggest that traders should pay close attention to these signals, as they could play a key role in trading decisions.
This divergence indicates that a temporary price correction may occur or even a signal for a broader trend change.
🔎 Potential Scenarios:
Bullish Scenario:
If the price manages to stabilize above the red resistance zone (weekly resistance):
Fibonacci targets become attainable:
1.618 Fibonacci: $22 to $24
2.272 Fibonacci: $37 to $41
2.618 Fibonacci: $49 to $61
Bearish Scenario:
If the price fails to stabilize above the red resistance zone:
A correction down to the 0.618 Fibonacci level (between $9.4 and $10.3) is likely.
If the Fibonacci levels break down, the price may drop towards the bottom of the ascending channel (between $7.2 and $8).
⚡️ Key Takeaways:
Price stabilization above the red resistance zone is crucial for continuing the upward trend. Factors like increasing trading volume while attempting to break this resistance and positive news regarding UNI or the crypto market could assist in breaking this level. Indicators to watch include the formation of strong bullish candlesticks, significant volume spikes, and positive divergence in technical indicators like RSI.
Pay close attention to the negative RSI divergence, as it may signal a deeper correction.
The grey support zones will act as primary price defenses.
Traders should closely monitor price behavior near the middle line of the channel.
A strong breakout above the red resistance zone with high volume could confirm an entry signal.
🔔 Summary:
In the UNI analysis, the price behavior at the red resistance zone is key. If this resistance is broken, higher targets are expected. However, if the price fails to break this resistance, a correction towards lower Fibonacci levels and even the bottom of the channel is possible. Additionally, the RSI divergence serves as a warning for traders to follow the market's behavior more cautiously.
🔴 Practical Recommendation:
Traders should enter the market with a risk management strategy, and diversifying their capital can be highly beneficial to avoid unexpected risks. Furthermore, stay updated with analysis revisions.
⏰ Stay tuned for further updates and more detailed analysis!

What currencies are Trend 2025?hello friends
This altcoin, which is active in the field of DEFI and can grow well in 2025, is now in a good range with the correction it has made, so it is a step to buy.
The second step is the lower range that we specified for you.
Note that DEX tokens can experience good growth in 2025.
So be sure to have it in your basket.
Be successful and profitable.

Big currencyhello friends
This currency is in a good position with the correction it has had and now you can enter one step and we have specified two lower limits for you in case of further correction of the market and we expect very high goals from this currency.
Be successful and profitable.

A bright future!!!hello friends
We have come with the analysis of another coin
DYDX which is in DEFI area.
This coin has been suffering for a long time and now by making a bottom, it was able to experience an upward movement.
It is expected that it will move at least up to the limit of range and this time it is likely to succeed in breaking the ceiling.
Now, if you have this coin, you can keep it up to the range limit, and after the successful failure of the range, you can proceed to the specified targets with it.
Now, if you want to buy this coin, our suggestion to you is that one entry step is appropriate now and we will wait if the market corrects at the specified points, we will buy other steps.
If you grow from this area, you can buy a step with the successful failure of your TR and wait for good targets...

Analysis and review of UNISAWPHello dear friends
We are at your service by analyzing and reviewing a coin from the DEFI field.
Coin of the decentralized exchange UNISAWP, which is a very, very potential coin.
This coin has expected movements, as you can see, it was suffering for a long time, now that the decentralized exchanges are speaking first, it was able to get out of the suffering and make an upward movement, but this is just the beginning of the story...
After his rise, he made a good pullback and due to the rounding of the trend, he gives us this signal that a big rise is happening.
If you have this currency, we suggest that you keep it.
But if you are looking for a buying opportunity, you can make a buying step here and wait to buy in the specified areas if the market corrects.
Note that this coin has a good future...

SushiSwap (SUSHI)📊 SUSHI Analysis
🔹 General Overview:
SUSHI coin managed to break out of its descending channel from the top and reach its weekly timeframe resistance. This resistance could lead to a price correction. The RSI has entered the overbought zone, but another significant resistance still lies ahead.
🔹 Weekly Timeframe Analysis:
If the price manages to break the white weekly resistance zone, it could trigger a sharp move towards the Fibonacci targets:
1.618
2.618
3.618
🔹 Investment Recommendation:
✅ We recommend a laddered entry strategy for investing in this cryptocurrency:
One entry at the current market price.
Another entry if the price corrects downward.
A final entry if the weekly resistance is broken.
🔹 Long-Term Outlook:
Given SUSHI's functionality and low market cap, it has the potential to revisit its previous all-time high. However, gradual profit-taking in the red zones is essential.
🔹 Additional Notes:
1️⃣ Volume Analysis:
An increase in trading volume near the weekly resistance could indicate strong buying pressure. If the breakout is accompanied by high volume, the likelihood of a sharp move increases.
2️⃣ Price Behavior During Correction:
During a correction, observe whether the price drops slowly with low volume or quickly with high volume. A slow correction often signals accumulation by buyers.
3️⃣ Impact of Overall Market (BTC & ETH):
The general market condition, especially Bitcoin and Ethereum trends, heavily influence smaller coins like SUSHI. Ensure the overall market trend is positive.
4️⃣ Timing Investments:
Given the likelihood of a correction near resistance, avoid rushing in. The proposed laddered entry strategy can help mitigate risks.
5️⃣ Monitoring SUSHI's Fundamentals:
Stay updated on SUSHI’s protocol upgrades, new partnerships, or management changes, as these can significantly influence price trends.
💡 Conclusion:
Stay in the game with proper risk and capital management.

Trading opportunity for 1INCHUSDTBased on technical factors there is a Buy position in :
📊 1INCHUSDT
🔵 Buy Now
🪫Stop loss 0.4120
🔋Target 1 0.5300
🔋Target 2 0.6000
🔋Target 3 0.6900
💸RISK : 1%
We hope it is profitable for you ❤️
Please support our activity with your likes👍 and comments📝

Alikze »» CAKE | Bullish Wave 3 or C Scenario - 1W🔍 Technical analysis: Bullish Wave 3 or C Scenario - 1W
📣 BINANCE:CAKEUSDT In the long-term analysis mentioned earlier, after a zigzag correction to the $1 area, a reversal pattern (inverted head and shoulders pattern) has formed.
🟢 In accordance with the previous analysis , the target was touched.
🟢 But currently, on the weekly time frame, in continuation of the previous analysis, it is in the supply range.
🟢 Two possible behavioral scenarios can continue.
💎 First scenario: This upward movement can extend to the previous minor ceiling and, after a correction to the broken supply range, continue to the next supply area.
💎 Second scenario: If the current supply area cannot be broken (the current supply area is not used up), it can continue the upward path by breaking the supply area of the current range to the $5 area with a pullback to the broken swing.
⚠️ In addition, in both possible bullish scenarios predicted, the price should not enter the LVL validation range. If a price correction occurs and the price touches the aforementioned area, the bullish scenario is invalidated and should be re-examined and updated. ⚠️
»»»«««»»»«««»»»«««
Please support this idea 💡 with a LIKE 👍 and COMMENT 💬 if you find it useful and Click "Follow" on our profile if you'd like these trade ideas delivered straight to your email 📧 in the future.
Thanks for your continued support.🙏
Best Regards,❤️
Alikze.
»»»«««»»»«««»»»«««


COINBASE Can it recover from yet another earnings miss?Coinbase / COIN reported today earnings that missed their estimates (EPS at 0.28 against 0.45 and Revenue at 1.2B against 1.25B) and dropped more than -5% in after hours trading.
This is the second seccessive earnings miss for the company.
Despite yet another misfire, we believe the exchange can recovery from it, purely from a technical standpoint.
Since the January 2023 bottom, it has maintained a Channel Up. During that pattern, every 1week MACD Bullish Cross formation was a strong buy opportunity, signaling the start of a bullish leg.
By the end of this week, the 1week MACD should complete a Bullish Cross.
As the price held the Rising Support and is climbing, we see no reason that can alter the new bullish leg.
The shortest bullish leg on this Channel Up was +146.79% and another such 'bad case scenario' will almost test Resistance A.
Our target is just under it at 360.00.
Follow us, like the idea and leave a comment below!!

