Where else can it go?Price is testing the broken flag support. There is too much bearish pressure for a comeback. It may try go to higher but I think the sellers are just waiting to add to their positions if it happens. I just opened a short position, if it goes up I'll add another short. It may take a few more days to drop when it falls it does it very fast.
Exoticcurrency

Can UsdMxn Go Higher?This is one of the pairs that I enjoy charting. When UsdMxn has the right amount of momentum, you can really see this pair perform well.
We are watching this pair for a potential upside move. Does it have the ability to push up from here?
*This is not considered financial advice. This is for educational purposes only. Thank you for your positive rating and feel free to leave a comment below on your thoughts with the direction of this pair.

USDRUB upd. Sep. 30, 2021 - (conspiracy view)Pros
- One of the best armies on this globe. Almost completely reorganized in the last 10 years with the latest weaponry.
- Despite sanctions feels good, agriculture developed, which was not needed because there were supplies from Europe. Now any field in central Russia is cultivated for crops.
- There is a small amount of money in circulation.
- Lack of government debts.
- Over-sold currency due to sanctions and the desires of exporters.
- The energy crisis in Europe. No one will help except the country that holds 60 percent of all mineral reserves on earth.
- France is actively distancing itself from the U.S.
- Germany is choosing a new chancellor after 15 years of Merkel's rule, how this will affect relations with Russia is not yet clear, but Merkel has always broadcast America's terms.
- The weakening of the US, the withdrawal of troops from Afghanistan is one confirmation of the beginning of the tectonic underlying causes of the beginning of the disintegration.
Cons
- Not too smart leadership, mostly those who praise Putin well are allowed into power.
- Social elevators don't work. Cronyism flourishes.
- The banking system has been destroyed; all banks are now essentially state-owned or owned by the central bank.
- The population is not rich. (And where is the rich population now? There was one three-letter country here recently, and it's almost gone.)
- Export elites do not want strong ruble.
- Conflicts with US satellites like Poland, Baltic countries and Ukraine.
Conclusions
If we look at the TA levels we can see that the level below 72 is locally key.
If it is passed we will look south with the maximum targets in the area of the previous central bank purchases.
Against the background of the departure from risk and the salvation of funds the world's shadow structures can park them in the ruble and Scandinavian currencies. Not only shadow btw.
Trade safe and wise.

USD/ZAR Forecast/4 HRFX:USDZAR
A retracement forming on the 4hr after an
elliot wave formation during a downtrend.
likely reversal into an uptrend after
the full retracement completes.

Potential good trade?Exotic markets are risky, but I see good indication on this one. Not risking crazy amount, but I put in my trade at 8.59. Looking to take profit on the way up. I would honestly wait to trade until the 1 and 7 day moving averages cross, as it seems to be a strong indicator on this chart. At around 9.00 I expect a continuation of the down trend. I will still be watching for the next indication for that as well. Lets see how it goes!

USD/NOK long ideaThe USD/NOK chart has formed a double top pattern, fell to the nearest support and has now the possibility of bouncing from there back to the top again, just waiting for a confirmation in the next few days.


USDZAR2 option as always - price will break support level and close underneath for future drop or price will rejected to the long side.

IDEA USDZARUSDZAR
▪️Support breakage
▪️A shoulder-head-shoulder pattern is forming
▪️1D descending triangular pattern
We are going to wait for confirmation in the 15M period to go short (sell), since after the break of the support a shoulder-head-shoulder pattern is forming.

USDHUFI am waiting for the price action in the highlighted area, to show following move. At the moment I see M reversal pattern and waiting for the break of the support line.

USDMXN LONG SWINGUSDMXN beautifully touched monthly support and rejected with a daily bullish engulfing. I initiated buy on the next daily candle. Daily also shows bullish divergence on obv and we have been in an uptrend since 1999. Great long term setup looking for new highs on monthly. Lets see what happens considering everything going on in the world.
Leave a like and lmk what you guys think. This is only my third post.
Currently 3-0 right now :-)


USDZAR Upcoming ShortAnother Wyckoff breakdown. Trying to get in the groove with my new found way of breaking down consolidations. Love when it creates confluence with my other theories.
Yellen,
One Move One Kill

USDMXN UPCOMING SHORT - WYCKOFF BREAKDOWNI love exotics, mainly because they pay...lol
See how this study can help your trading in the coming week.
Yellen,
One Move One Kill

USDTRYWeekly/Daily: Clear uptrend.
H4: Price recently formed a triangle which followed by a massive sell-off. Price bounces back from a key level and slowly pushing higher.
H1: An uptrend trendline can be seen on the chart.
Bias: The price might retest the support level @ 6.78400 and continue its upward momentum with initial target @ 6.85200, second target @ 6.90300, third target 9.95600 and finally @ 6.98800.

EURRUB retestOver the past months the pair has been in a down trend. It has broken a strong support level and is currently retesting before continuing its downward movement. I will publish more intraday setup ups on it if it continues to be bearish.
Thanks for viewing.
Comment with your thoughts I'd like to hear them.

USDTRY BuyBeen eyeing on this exotic pair since the start of the week and it looks like it's still bullish. Do buy it and proceed with strict risk management. The setup here is a 1:3 Risk reward ratio.
Thanks for viewing.
Comment with your thoughts I'd like to hear them.

USDSEKWeekly/Daily/H4/H2/H1: Price is in a downtrend direction and currently approaching a support level which is also a key zone.
30m: In the lower time starting from 30m to 5m I can see price is holding 9.4300 level in a consolidation form and it is forming a triangle wedge in the next few days."
Scenario A: Price could continue to drop until 9.31000
Scenario B: Price might hold the current level 9.43000 in a consolidation form and decide either direction
Scenario C: It could target 9.55600 level and then retrace back to 9.43000 which if it holds again it could rally upward with a possible stop @ 9.67500 and second target @ 9.83100/9.88300. However, if it breaks to the downside, then I think scenario A is the best option.

USDZAR BUY INTRADAY IDEAHi Traders,
Have a look and see if it will make sense to your bias.
Good luck,
FIBZ

USDMXN BUY IDEAHi Traders,
Have a look at this idea and see how it can fit into your plan.
Good luck!
Fibz

USDZAR INTRADAY SELL IDEAHi Traders,
Have a look at this idea and see how you can benefit from it.
Good luck,
FIBZ

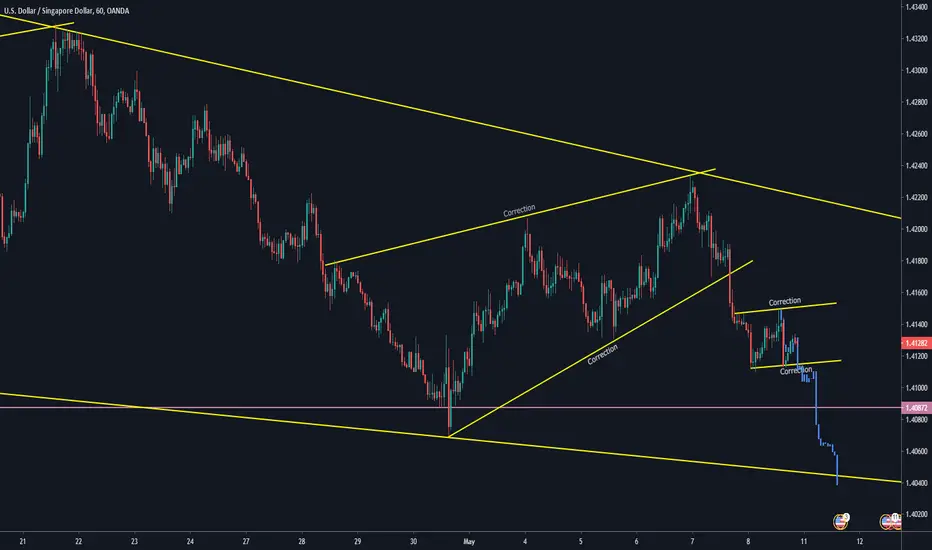
#USDSGD - Short after break of correction Waiting for a break of the correction and double bottom to the downside and will then be looking to enter a short position on this
Is the South African Rand exortic enoughI am looking for long opportunities on EURZAR and what I like about exotic pairs is that they hardly range, they are always trending and soaring like an eagle, up the sky. I am targeting the A=C level. With the number of increasing Corona virus case in South Africa I think the South African Rand (ZAR) will be severely affected.
