USDCNH ANALYSISUSDSGD is in uptrendline
Price is based above key level at 1.3623
Above SMA 100
RSI is above level 50
Above HVN at level 1.3572
It's expected for the continuation of bullish momentum to target first resistance level at 1.3718
then finally target supply zone at level 1.3794
Exotics

USDCNH ANALYSISUSDCNH is trading in downtrend
Strong bearish wave (a) ended at level at 6.6280
then corrective bullish wave (b) rejected from strong daily supply zone corresponding to 38.2% Fibonacci level at 6.6797
Below SMA 100
MACD shows weakness in bullish momentum
RSI broke uptrendline
Below HVN at level 6.7331
It's expected for coming strong bearish wave (c) to target level 6.5500

USDZAR ANALYSISUSDZAR is in downtrend
Price broke neckline of double top pattern at level 16.8078 with strong bearish movement
Price is based below HVN at level 16.6595 which indicates pair is in distribution phase
Below SMA 100
MACD shows weakness in bullish momentum
RSI is below level 50
It's expected going down towards support level at 16.4025 as classical target from double top pattern
then finally target demand zone at level 16.0900

USDZAR Buy SetUpUSDZAR buy set up
Share thoughts in the comment box
Like and Follow for more content
Good Luck

USDSGD Buy Set Up (Inverse Scale)Inverse scale set up... Buy USDSGD
Share your thoughts in the comments below
Like and follow for more content
Good Luck

USDPLN rounded bottom, indicates a move to the upsideUSDPLN rounded bottom, indicates a move to the upside
Share your thoughts in the comment section below
Like and Follow for more content
Link in the related links for the last USDPLAN idea
Good Luck!!!

USDZAR ANALYSISUSDZAR broke downtrendline
Price is based above support level at 16.5560
Above SMA 100
MACD shows bullish momentum
It's expected the continuation of bullish momentum to target first key level at 17.1186
then finally target HVN at level 17.4091

USDZAR Upcoming ShortAnother Wyckoff breakdown. Trying to get in the groove with my new found way of breaking down consolidations. Love when it creates confluence with my other theories.
Yellen,
One Move One Kill

USDMXN ANALYSISUSDMXN respects major downtrendline
Pair is based below key level at 21.8950
Below SMA 100 on H4 frame
RSI is below level 50
It's expected for coming bearish movement to target strong daily demand zone at level 20.6215

USDCNH ANALYSISUSDCNH broke major uptrendline on daily frame
Price respects major downtrendline
Pair is based below resistance level at 6.9630
Below SMA 100
MACD shows bearish momentum
It's expected for the continuation of bearish movement to target key level at 6.8165

USDSGD ANALYSISUSDSGD respects major downtrendline on daily frame
Price broke key level at 1.3687
Below HVN at level 1.3927
Below SMA 100
MACD shows start of bearish momentum
It's expected for the continuation of bearish movement to target demand zone at level 1.3445

USDZAR ANALYSISUSDZAR is forming Head and Shoulders pattern
Price is based below resistance level at 17.5150
Below SMA 100
RSI is in downtrend
We r waiting price to break next support level and HVN at level 17.3238 to open short trade
It's expected for coming bearish movement to target key level at 16.8155

USDMXN ANALYSISStrong bullish wave (A) occurred after breaking downtrendline
then corrective bearish wave (B) rejected from broken downtrendline with bullish movement
MACD shows start of bullish momentum
Pair is based above HVN at level 22.3538
It's expected for coming strong bullish wave (C) to first target key level at 22.9080
then finally target supply zone at level 23.2320

USDZAR ANALYSISUSDZAR broke major downtrendline on H4 frame
Price broke key level at level 16.9040 with strong bullish movement
Price is above HVN level 16.6836
MACD shows bullish momentum
It's expected for the continuation of bullish movement to first target resistance level at 18.0000
then finally target supply zone at level 19.1875


USDMXN ANALYSISUSDMXN broke major downtrendline
Price is based above HVN at level 22.2121 which indicates that pair is in accumulation phase
Price respects uptrendline
Broke consolidation triangle pattern
MACD shows weakness of bearish momentum
RSI is above level 50
It's expected for coming bullish wave to target first key level at 23.6035
then target following resistance level at 24.3960

USDCNH ANALYSISUSDCNH is based above key level at 7.0410
Price broke corrective downtrendline
Pair is forming inverted Head & Shoulders pattern
Price is based on HVN at level 7.0822 which indicates that pair is in accumulation phase
MACD shows starting of bullish momentum
RSI is in uptrend
It's expected for coming bullish wave to target resistance level at 7.1980

USDMXN SHORT TRADEUSDMXN broke lower limit of triangle pattern
Price is based below HVN at level 24.0610 which indicates that pair is in distribution phase
Below SMA 100 on H4 frame
MACD shows bearish momentum
RSI is in downtrend
It's expected going down testing daily support level at 22.0264 which corresponds to 127% Fibonacci expansion

USDZAR BUY INTRADAY IDEAHi Traders,
Have a look and see if it will make sense to your bias.
Good luck,
FIBZ

USDCNH SHORT TRADEUSDCNH broke key level at 7.0990
Pair is downtrend
Price is based below HVN at level 7.0931 which indicates that pair is in distribution phase
RSI rebounded from level 50 which is considered to be resistance level
It's expected to test the demand zone at level 7.0525

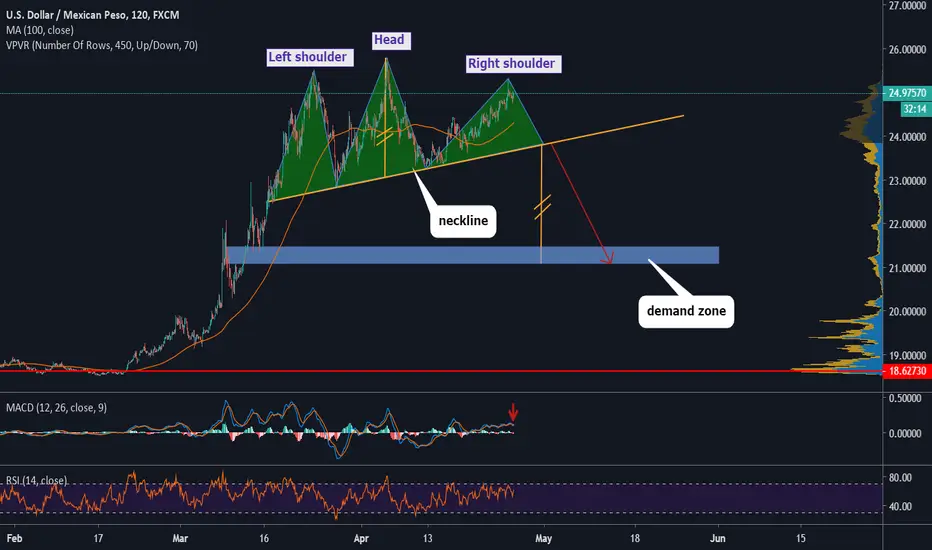
USDMXN SHORT TRADESharp bullish wave ended at level 25.5137
Now USDMXN pair is in trading range forming Head and Shoulders pattern
MACD shows bearish momentum
It's expected to target first neckline at level 23.8222
then target demand zone at level 21.0992 which corresponds to the classical target of Head and shoulders pattern
USDSGD SHORT TRADEUSDSGD is in major downtrendline
Price broke key level at 1.4215
Pair is based below HVN at level 1.4239 which indicates that price is in distribution phase
MACD shows weakness in bullish momentum
It's expected to target demand zone at level 1.3873

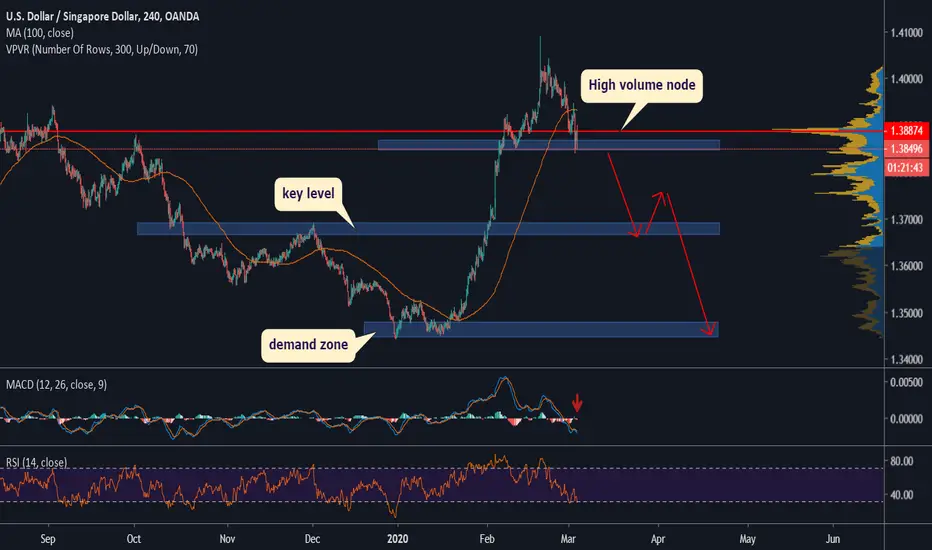
USDSGD SHORT TRADEUSDSGD now is based below HVN at level 1.3887 which indicates that pair is in distribution phase preparing for coming correction
We r waiting price breaking support level at 1.3840 for opening short trade
MACD shows bearish momentum
First target will be at key level 1.3678
Second target will be around demand zone at level 1.3447