We're not out of the woods yet. < $20K BTC is still possible. This is the same idea as last one but with Candles so that new bars will load (this feature is not available for Renko bars).
An Expanding Triangle is a pattern that starts with the price action squeezed tightly in the Apex (dotted blue line). There will be usually at least two swing highs and two swing lows in price. Overall volume usually diminishes as the pattern develops because traders become more and more unsure as to the market’s future direction. Also there may be several intermediate failed efforts to reach either the support or resistance as outlined by the triangle extensions. If the action creates a new bearish breakdown, typically the action will repeat the volatility experienced with the Pole creation (the vertical blue lines). We also need to pay close attention to the volume after the breakdown to recognise further development for the pattern. Another breakdown downwards is possible. Let's see what's gonna happen.
Safe trading everyone.
Expandingtriangle


< $20K BTC still possible. We're not out of the woods yet.I got rid of the noise by using Renko bars and saw a potential Bear Expanding Triangle in development. An Expanding Triangle is a pattern that starts with the price action squeezed tightly in the Apex (dotted blue line). There will be usually at least two swing highs and two swing lows in price. Overall volume usually diminishes as the pattern develops because traders become more and more unsure as to the market’s future direction. Also there may be several intermediate failed efforts to reach either the support or resistance as outlined by the triangle extensions. If the action creates a new bearish breakdown, typically the action will repeat the volatility experienced with the Pole creation (the vertical thick blue line). We also need to pay close attention to the volume after the breakdown to recognise further development for the pattern. Another breakdown downwards is possible.
What do you think of this pattern?

GOLD Expanding Triangles and Ending Diagonal Pattern Ideas.GOLD possible forming an expanding bullish triangle pattern now at wave b (Green Circled) where price still consolidating AND Gold price will be having possibility "return back" to 1790 Zone again after breaking recent high at around 1834 As previous many daily bar closed above 1790 with long wick. ALSO we might be having "Roller Coaster" ride trade in gold in next few months as Gold Price might be forming an expanding ending diagonal pattern in wave (C)(Cyan/Light Blue)

Bitcoin Under 30K, corrective expanding triangle If we go down from 36,6K again, the more possibly Bitcoin Ascending Triangle, but still potential to 40-43K
but on overall I think we are in Big Corrective expanding triangle before continue dump again
I'm think this is the continuation pattern for Bitcoin Classic A-B-C Pattern on Elliot Waves Thory
and now we are going to B (lower high) before dump and go to C (25-23K)

KLCI what would happen after fully lockdown starting 1/6/21?KLCI expanding triangle "maybe" still working, price "may" drop to around 1400?


SPX short for wave (E) (cyan) of expanding triangle. 24 May 21SPX Beside having possibility forming expanding wave (E) (Cyan)(light blue)... SPX On Lower Time Frame Chart .. E.g: 1hour/4 hours might form a Head and Shoulder pattern. Short SPX.. Stop Lost @ 4546, TP @ around 2000...

SP500 medium term outlook. Updated 24 May 21SPX possible is forming Expanding Triangle on wave 4 (red circled).. Currently Price seem stalling around the upper trend line ( yellow dotted line)...

BNBUSDT: Shy to break 750 Phycological resistanceHello Traders!
If you look closely BNB is repeating the exact same pattern. First, it made New highs than a correction facing the downside and after breaking that correction it formed 2 tops and then remained in correction for a very long time.
It has repeated the same pattern and now it is in the second phase where it will form 2 tops and will go for a correction for a very long time and this correction will break the bottom trendline before Making any new Highs.
Hit the like button to support the idea and follow to stay connected.

Broadening Formation?The market is currently bullish, and it continues to be bullish until the market says otherwise.
This idea is not to try to be a fortune teller, telling the market what to do,
but a possible scenario that could happen so if the market is deciding to act on it, we will have it in our mind and follow its bidding to the downside.
The trend is your friend, so keep listening to it...

BTC forming an Inverse Head & Shoulders pattern?Not investment advice. Not a professional.
IDEA: BTC completed a Bullish Cypher Harmonic , so likely up a bit for now at the very least.
Previous post proposed possible Expanding Symmetrical Triangle forming. I'm in the camp that would be bet this Bull Run isn't over yet but a larger correction will happen at some point in the near future before we make any more meaningful moves up. I'll never say never, but a dip to $40k or below rn just seems a little out of reach given the current market sentiment IMO.
If I had to bet, I'm thinking we're currently forming the HEAD of an INVERSE HEAD & SHOULDERS PATTERN . Just like the stock market, I don't think BTC is quite done consolidating yet. I think we'll see one more Bull Trap to a slightly higher high around $68k > a modest pullback > then off to the races again.
Or I'm completely wrong, who knows. Cheers.

BTC - Possible Path?Not financial advice. Not an expert. Here to learn.
Would appreciate hearing from knowledgeable folks about whether or not this chart/idea has any legitimacy.
Pitchfork starts with March dip. Edges set at start of parabolic upswing (R) & at January peak (L)
Small RED Channel is what I'm using as the trend line that must maintained in order to justify that current impulse wave might not be over
Other channels created by extending recent trend lines backwards
Bullish Cypher Harmonic
Suggested scenario: we're in a rising top, potentially forming an Expanding Symmetrical Triangle

BTCUSD AnalysisHello Traders!
BTCUSD is moving inside an expanding channel and if we look closely it is forming an inverted head and shoulder pattern which is a bullish sign. It is good to go for buy once it breaks this short-term bearish trend. I am expecting that it will break this bearish trend after it completes the inverted head and shoulder pattern.
The expected date to hit the target is 20th May and we will see a fake breakout of this expanding channel and a hard drop after that. Next psychological resistance is at 75K so a next drop might start from that level.
I will post the next BTC analysis on 9th May. BTC analysis is important for all other coins as they move up and down with BTC.
Don't forget to hit the like button and follow to stay connected.

$OXTUSD - Bullish continuation above 0.75Hello everyone!
Orchid looks strong and very bullish and hopefully this pace will be held for longer time.
For now I believe it's very risky to long OXTUSD, I'd suggest you to wait for closing above 0.75 and go long.
OXTUSD might also correct a bit and bounce, though I still believe the best would be to enter above 0.75.

$UNIUSDT - Moves inside an uptrend channelHello everyone!
Uniswap looks bullish inside this uptrend channel.
It is testing the dynamic resistance as support now (bullish flag pattern) and is looking to break above the resistance at $30.
If that resistance is overtaken, it will jump towards $38

KLCI Future updated 15 March. 2021FBMKLCI Future might still forming expanding triangle, Stop lost for long would be around 1550, TP @ around 1760 as chart shown above..

CLOV - There's absolutely NO SHOT..... right?Alright, so hear me out.
NASDAQ:CLOV has this insane, speculative expanding wedge/triangle pattern forming. I mean, there's absolutely NO SHOT this can actually play out. It HAS to be just a coincidence...... right?
The featured content is intended to be used for informational purposes only. Everything shared here is my own opinion. It is very important to do your own analysis before making any investment based on your own personal circumstances.

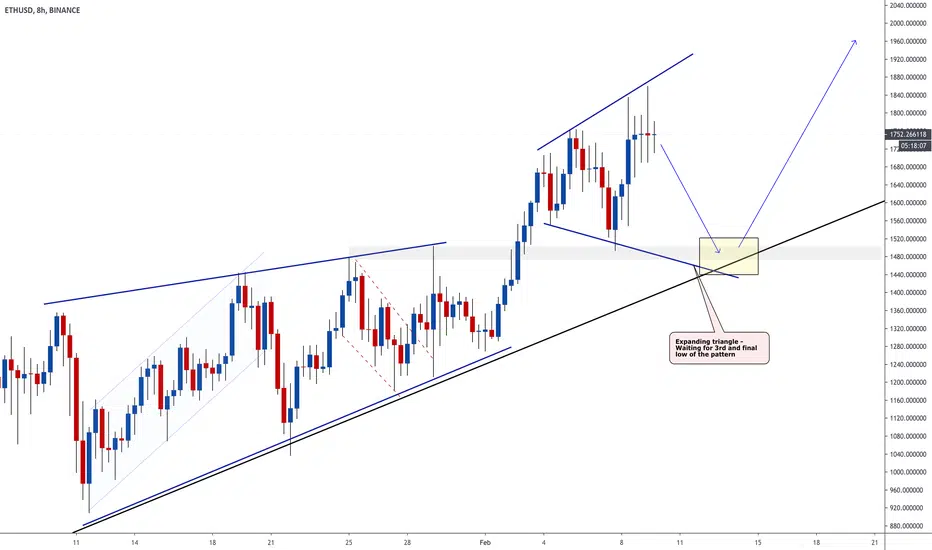
ETHEREUM - Creating final low of Expanding TriangleGoogle expanding triangle pattern.
Ethereum appears to be making an expanding triangle pattern with it approaching its 3rd low before another impulse up.
Will monitor closely and create a trendline to watch for breakout as an entry requirement.
USDCAD SellHello Traders!
This is a big corrective move in expending formation.
Usdcad is at its peak and is now a good point for sell.
The target must be the first support after that bullish movement.
The first support is at 1.2725. After breaking and retesting this point you can sell more.

DXY - EW: wave (4) of 5? Monitoring 30m chartIts maybe ranging into a wave 4 (abcde: expanding triangle) of the bigger wave 5, heading below 89 after completition?

CADJPY Weekly Chart Attempting a Major BreakoutBuying pressure seems to be building nicely and pointing to a possible breakout sooner rather than later.
A weekly close above 82.00 would be a bullish signal. A successful breakout could target the 84.30 area for starters.
The HR chart is showing an expanding triangle at resistance level. Looking mighty bullish IMO but still needs to break away from this consolidation pattern.

$AAVEUSD - Correction aheadHello everyone!
AAVE formed an expanding diagonal and just now tested the dynamic resistance, though the impulse is strong, I believe it will correct here.
TP levels are on the chart. Trade with caution, do not forget about risk management
