How To Trade Quality Pin BarsAfter the Pin Bar Formed At The EMA 10 EMA 20, Do The Following Actions
Draw Your Fibonacci Retracement Levels
Draw Horizontal Support Levels
Enter At Pin Bar Close Price
Exit At The Previous Swing Low Level
The attributes that made this a quality Pin Bar:
Pin Bar Close Price is in the Fibonacci Retracement 50% and 38.2% Range Area
Pin Bar Close Price is in the EMA 10 EMA 20 Range Area
Pin Bar at Lower High
Downtrend
Technical Chart Of How To Trade The Pin Bar. Before and After Charts. Click on Charts.
Exponentialmovingaverage

EURNOK Target Price 10.35900EURNOK
TREND DIRECTION: Down
LEVEL: Support Resistance 10.41230; EMA 10 10.39341; EMA 20 10.39977; Fibonacci Retracement 50% 10.41493
SIGNAL: Pin Bar
DATE and TIME: 16-AUG-2021 16:00

GBPSEK Target Price 11.96054GBPSEK Entry Price 12.00221
Entry after pin bar closes on the H4 Time Frame
Daily Time Frame
H2 Time Frame

How To Trade The Pin Bar With Support Resistance Levels 08-16-21This pin bar is in a pull back. The horizontal level was broken and the horizontal level was retested with a pin bar candlestick. In this case, the pin bar tail intersects the EMA 10 and horizontal support level. Price closed above the horizontal level. Entry for this strategy is at the pin bar close. The Target is the previous swing high.
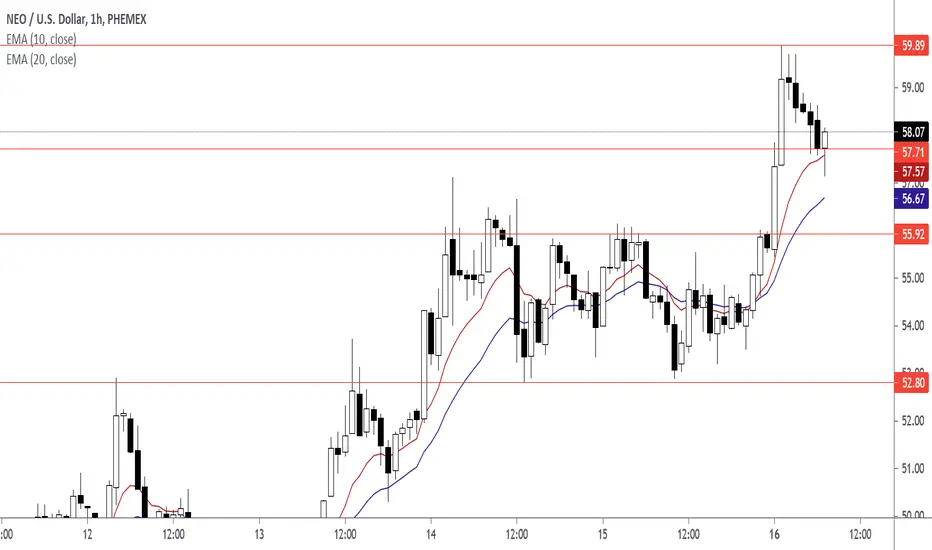
TRXUSD (TRON) Target Price 0.1120TRXUSD (TRON) closed above 0.0909 and retested 0.0909. Entry at close of pin bar.


USDSGD Target Price 1.36933USDSGD. Waiting For Price To Reach 1.36933.
Weekly Time Chart
Daily Time Frame Chart For Pin Bar On August-4-2021 (Replay Chart)

USDNOK Target Price 8.84255USDNOK Entry Price 8.71538
Pin Bar Date Time and Price (x,y)
(12-Aug-2021 at 16:00, 8.71538)

CHFJPY Target Price 119.019CHFJPY. I have this pair on my watchlist as a sell. If there are better trade opportunities, then I will remove this CHFJPY Trade Idea from my watch list.


EURCAD Target Price 1.45821EURCAD Entries
19 Jul 21 Entry Price 1.47798.
26 Jul 21 Entry Price 1.47968.
02 Aug 21 Entry Price 1.47629.

SUGARUSD EMA 10 EMA 20 Rejection Candlestick and TriangleSUGARUSD. Watch how Sugar responds to the trend line after the symmetrical triangle breakout. Entry at the intersection of trend line and EMA 10 EMA 20 with rejection candlestick wick. In the this technical chart there is a TREND, Diagonal LEVEL, and SIGNAL.

Cryptocurrency Total Market Cap (2021-08-09)United States Dollar is strengthening against Cryptocurrencies. A rejection candle formed on horizontal resistance level for TOTAL market cap chart. In this scenario, look for short opportunities with the following currency pairs listed below.
Ripple
Iota
OmiseGO
Ethereum Classic
Ethereum
Crypto Total Market Cap
Crypto Total Market Cap Exclude BTC
Altcoin Index Perpetual Futures
XRPUSD
IOTAUSD
OMGUSD
ETCUSD
ETHUSD

Pin Bar at 50% Fibonacci Retracement and Resistance LevelIn the USOIL Market, the ideal entry was to enter at 70.55 and 70.54 price area. This zone area is where horizontal resistance level overlaps with 50% Fibonacci Retracement Level. Also USOIL was in the downtrend. EMA 10 is below EMA 20 which indicates a downtrend.
Horizontal Resistance Level had a minimum of three touches.

AUDUSD Entry Price 0.73775 Target Price 0.72894AUDUSD Fibonacci Retracement Level, Support Resistance Level, Exponential Moving Average Level, and Pin Bar


AUDCAD Entry Price 0.92511 Target Price 0.91442AUDCAD. Pin Bar, Horizontal Support Resistance, EMA 10, EMA 20, 50% Fibonacci Retracement

BTCUSD Bitcoin Entry Price 43464.54BTCUSD Bitcoin. Enter at close of Pin Bar Candlestick. Candlestick wick pierces EMA 10 EMA 20 and horizontal support level.

XAGUSD Target Price 24.61300XAGUSD Silver. Trade idea is pin bar, exponential moving average, and horizontal support resistance level. There is a downtrend, level, and signal.

ETHBTC Target Price 0.057031ETHBTC Horizontal Support Resistance Level, EMA 10 Level, EMA 20 Level, and Rejection Candlestick.

NZDCAD Entry Price Zone Area 0.87431 and 0.87332NZDCAD. Watch for price to pull back to this price area. You will see three lower highs in the chart below.

EURCHF Entry Price 1.07974EURCHF. Watch for a rejection candlestick at horizontal level 1.07974. Wait for price to pull back.
