US100 - Trading within a bearish parallel channel!Introduction
The US100 is currently trading within a well-defined parallel channel to the downside, consistently finding support along the lower trendline and facing resistance near the upper boundary. This structure has led to a clear pattern of lower lows and lower highs on the 1H timeframe. Most recently, price action broke market structure, and we now anticipate a reaction near a high-confluence resistance area.
Parallel Channel
A distinct parallel channel has been developing on the US100 over the past several days on the 1H timeframe. During last night's move, the price touched the lower boundary of the channel and has been trending upward since. After breaking above the midline at $21,640, momentum suggests a potential continuation toward the upper boundary of the channel around $21,830.
FVG
During the most recent downward move, the US100 created a significant 1H Fair Value Gap (FVG), stretching from $21,775 to $21,840. This zone represents a key imbalance that could generate a strong reaction to the downside if price revisits it.
Conclusion
Given the break in structure on the 1H timeframe, short-term upward moves are likely to face resistance. The confluence between the upper boundary of the parallel channel and the 1H FVG creates a high-probability area for price rejection, making it a critical level to watch for potential downside pressure.
Disclosure: I am part of Trade Nation's Influencer program and receive a monthly fee for using their TradingView charts in my analysis.
Thanks for your support.
- Make sure to follow me so you don't miss out on the next analysis!
- Drop a like and leave a comment!
F#forex

USD/CAD.1week chart pattern.It looks like me discussing a trade setup for USD/CAD with:
Sell Entry: 1.36200
Target Point 1: 1.23504
Target Point 2: 2.31000 ← This seems like a mistake
Let’s break it down:
---
🔍 Trade Analysis:
Sell at 1.36200: This is a reasonable short entry, near recent resistance (depending on current market context).
Target Point 1 (1.23504): This is plausible, as it's a historically significant support level — a good long-term take-profit zone.
Target Point 2 (2.31000): This appears illogical for a short (sell) position — it's higher than the entry price. If you're shorting, you profit from a decline, not a rise.
---
✅ Corrected Setup (Sell Idea):
Sell USD/CAD @ 1.36200
Take Profit 1: 1.30000 (medium-term support)
Take Profit 2: 1.23500 (long-term support)
Stop Loss: 1.37200 (just above recent highs)
Would you like a chart analysis or backtest of this strategy?

EUR/USD - Daily highs taken, now what?Introduction
The EUR/USD made a strong move higher today, establishing a clear uptrend on the 4-hour chart. With this latest push, it swept the daily liquidity above the previous high. The question now is whether the EUR/USD will continue moving higher or if there are opportunities for long entries at lower levels.
Liquidity Sweep
EUR/USD has taken out liquidity above the daily highs, where many stop losses are typically positioned. These stops have now been removed from the market. This area could potentially act as a support and resistance flip. However, if we see a 4-hour candle close below the previous daily high, further downside becomes likely.
Where Can We Look for Buys?
During the recent 4-hour move higher, significant progress was made. This upward movement created a daily Fair Value Gap (FVG) between $1.149 and $1.145. This FVG aligns perfectly with the golden pocket Fibonacci level, drawn from the swing low to the swing high. As a result, this zone forms a strong area of confluence for potential buy positions to target a retest of the highs.
Conclusion
Although we are currently breaking above the previous high, this move has yet to be confirmed as sustainable. Holding above this level is crucial. If a 4-hour candle closes below the previous high, it becomes likely that we will revisit the daily FVG and golden pocket Fibonacci zone.
Disclosure: I am part of Trade Nation's Influencer program and receive a monthly fee for using their TradingView charts in my analysis.
Thanks for your support.
- Make sure to follow me so you don't miss out on the next analysis!
- Drop a like and leave a comment!

Gold Takes the Throne as Safe Haven AgainThe recent escalation in the Middle East — particularly Israel’s surprise strike on Iran — has stirred up significant volatility in global financial markets. Oil prices surged, stock markets around the world turned red, just as many had predicted. However, in a surprising twist, capital did not rush into the usual safe havens like the US dollar or Treasury bonds. Instead, it flowed decisively into gold.
In fact, US Treasury yields have soared from 3.98% in April to around 4.42% now. This surge doesn’t signal growing confidence — it reflects investor demand for higher returns to compensate for the rising risk of holding dollar-denominated assets.
Against this backdrop, gold is emerging as an “unshackled safe haven” — immune to political instability tied to fiat-currency-issuing nations. The precious metal is once again proving its value in times of global uncertainty.

USD/CHF,4h chart pattern..USD/CHF buy trade setup based on my input:
---
✅ Trade Setup:
Buy Entry: 0.81300
First Target (TP1): 0.82300
Second Target (TP2): 0.83500
---
📊 Trade Metrics:
1. TP1 Distance:
0.82300 - 0.81300 = 0.01000 (100 pips)
2. TP2 Distance:
0.83500 - 0.81300 = 0.02200 (220 pips)
---
🛑 Suggested Stop-Loss (if not defined):
A common approach would be to place it below the recent swing low or a round level for risk management. Example:
Stop-Loss (SL): 0.80800 (50 pips risk)
---
⚖ Risk-Reward Ratios (if SL = 0.80800):
To TP1: 100 / 50 = 2.0 R/R
To TP2: 220 / 50 = 4.4 R/R
---
Would you like a visual chart or technical breakdown (e.g., support zones, confirmation candles) for this pair?

EURUSD Gearing Up for Next Leg Up – DXY Weakens After PPI MissToday, key U.S. economic indexes were released, providing fresh insights into inflationary pressures and the state of the labor market:
Core PPI m/m:
Actual: 0.1% | Forecast: 0.3% | Previous: -0.4%
Lower than expected – suggests weaker underlying producer inflation.
PPI m/m:
Actual: 0.1% | Forecast: 0.2% | Previous: -0.5%
Slight miss – overall inflation at the producer level remains soft.
Unemployment Claims:
Actual: 248K | Forecast: 242K | Previous: 247K
Slightly higher than forecast – signaling some cooling in the labor market.
Market Outlook :
These data releases point toward cooling inflation and softness in job growth, which may strengthen the dovish narrative around the Fed’s next move.
DXY Index ( TVC:DXY ) is under pressure, and EURUSD ( FX:EURUSD ) is showing signs of bullish momentum .
-----------------------------------------------------------
Now let's take a look at the EURUSD chart on the 1-hour time frame .
EURUSD is trading near the Heavy Resistance zone($1.182-$1.160) and Monthly Resistance(2) .
In terms of Elliott Wave theory , EURUSD appears to be completing microwave 4 . Microwave 4 could be completed at one of the Fibonacci levels .
I expect EURUSD to attack the Heavy Resistance zone($1.182-$1.160) at least once more after completing microwave 4 and could even rise to the Potential Reversal Zone(PRZ) .
Note: If EURUSD touches $1.1446 , we can expect more dump.
Please respect each other's ideas and express them politely if you agree or disagree.
Euro/U.S. Dollar Analyze (EURUSD), 1-hour time frame.
Be sure to follow the updated ideas.
Do not forget to put a Stop loss for your positions (For every position you want to open).
Please follow your strategy and updates; this is just my Idea, and I will gladly see your ideas in this post.
Please do not forget the ✅' like '✅ button 🙏😊 & Share it with your friends; thanks, and Trade safe.

Gold will grow a little more and then make correctionHello traders, I want share with you my opinion about Gold. After forming a downward wedge and several rejections near the support line, the price eventually broke out to the upside, signaling a reversal. This breakout was followed by a strong upward impulse, and Gold quickly shifted into a consolidation phase, creating a wide sideways range structure. Inside this range, we observed multiple rebounds from the lower boundary and a gradual rise toward the resistance level. Recently, the price exited the range upward after testing the buyer zone and breaking above the support area. However, this breakout seems impulsive and may need a correction. Currently, Gold trades slightly above the 3400 level, which aligns with the support area and the previous range border. In my view, the price may make a short upward move, followed by a return to the current support level. That’s why I set my TP at 3400 points, which corresponds to the support area and acts as a potential bounce zone in case of a retracement. Please share this idea with your friends and click Boost 🚀
Disclaimer: As part of ThinkMarkets’ Influencer Program, I am sponsored to share and publish their charts in my analysis.

GBPCAD What Next? BUY!
My dear subscribers,
GBPCAD looks like it will make a good move, and here are the details:
The market is trading on 1.8440 pivot level.
Bias - Bullish
Technical Indicators: Both Super Trend & Pivot HL indicate a highly probable Bullish continuation.
Target - 1.8496
About Used Indicators:
The average true range (ATR) plays an important role in 'Supertrend' as the indicator uses ATR to calculate its value. The ATR indicator signals the degree of price volatility.
Disclosure: I am part of Trade Nation's Influencer program and receive a monthly fee for using their TradingView charts in my analysis.
———————————
WISH YOU ALL LUCK

CHFJPY Will Go Higher! Buy!
Here is our detailed technical review for CHFJPY.
Time Frame: 6h
Current Trend: Bullish
Sentiment: Oversold (based on 7-period RSI)
Forecast: Bullish
The market is trading around a solid horizontal structure 177.661.
The above observations make me that the market will inevitably achieve 178.547 level.
P.S
We determine oversold/overbought condition with RSI indicator.
When it drops below 30 - the market is considered to be oversold.
When it bounces above 70 - the market is considered to be overbought.
Disclosure: I am part of Trade Nation's Influencer program and receive a monthly fee for using their TradingView charts in my analysis.
Like and subscribe and comment my ideas if you enjoy them!

CHF/JPY SHORT FROM RESISTANCE
Hello, Friends!
CHF/JPY pair is in the uptrend because previous week’s candle is green, while the price is obviously rising on the 2H timeframe. And after the retest of the resistance line above I believe we will see a move down towards the target below at 176.694 because the pair overbought due to its proximity to the upper BB band and a bearish correction is likely.
Disclosure: I am part of Trade Nation's Influencer program and receive a monthly fee for using their TradingView charts in my analysis.
✅LIKE AND COMMENT MY IDEAS✅

USDCHF - Now Bullish!Hello TradingView Family / Fellow Traders. This is Richard, also known as theSignalyst.
As per our last USDCHF analysis, attached on the chart, it rejected the upper bound of the orange channel and traded lower.
What's next?
📈USDCHF is now retesting the lower bound of the channel.
Moreover, the blue line is a strong weekly low.
🏹 Thus, the highlighted blue circle is a strong area to look for buy setups as it is the intersection of the lower orange trendline and weekly low.
📚 As per my trading style:
As #USDCHF is around the blue circle zone, I will be looking for bullish reversal setups (like a double bottom pattern, trendline break , and so on...)
📚 Always follow your trading plan regarding entry, risk management, and trade management.
Good luck!
All Strategies Are Good; If Managed Properly!
~Rich
Disclosure: I am part of Trade Nation's Influencer program and receive a monthly fee for using their TradingView charts in my analysis.

BITCOIN SENDS CLEAR BULLISH SIGNALS|LONG
BITCOIN SIGNAL
Trade Direction: long
Entry Level: 104,672.03
Target Level: 107,484.65
Stop Loss: 102,785.72
RISK PROFILE
Risk level: medium
Suggested risk: 1%
Timeframe: 3h
Disclosure: I am part of Trade Nation's Influencer program and receive a monthly fee for using their TradingView charts in my analysis.
✅LIKE AND COMMENT MY IDEAS✅

Gold trading strategy june 13Yesterday's D1 candle was bullish, confirming the continuation of the uptrend. Following that uptrend, the Asian session saw a strong price increase to a high of 3443. If there is still confirmation from the h4 candle above 3397, today will still be a bullish candle with a large amplitude at the end of the day.
After reaching a monthly high, Gold is in a bearish correction at the end of the Asian session. This correction will last until it touches the support level of 3397, which is a good BUY signal.
The target for BUY signals will be 3364 and this area will have a profit-taking reaction from Buyers, causing the price to fall. Gold may touch the pre-ATH level of 3394 and there will be a reaction.
On the other hand, there is a sweep to 3376, which is considered a daily support zone and you can buy in this area.
Support: 3398- 3376
Resistance 3464-3495

CAD_CHF STRONG SUPPORT AHEAD|LONG|
✅CAD_CHF will be retesting a support
Level soon around 0.5920
From where I am expecting a bullish reaction
With the price going up but we need
To wait for a reversal pattern to form
Before entering the trade, so that we
Get a higher success probability of the trade
LONG🚀
✅Like and subscribe to never miss a new idea!✅
Disclosure: I am part of Trade Nation's Influencer program and receive a monthly fee for using their TradingView charts in my analysis.

Bearish momentum to meet support on USDCAD: Looking for a bounceEvening, just wanted to share what I’m seeing on the USDCAD chart
Price on USDCAD has been in clear bearish momentum, but we’re now approaching a strong support zone, that’s held firm multiple times before, as I marked it on my chart. Price is approaching the zone again and I am taking it into account for a potential bounce.
I’ll be watching for bullish confirmation as usual requirement before entering. If that support holds, I’m targeting 1.38400 , totally achievable if momentum shifts.
BUT, if this zone breaks with momentum, I’ll reassess it and stay flexible.
💡 Reminder: Patience is power, no entry until price shows me something worth reacting to. This is not financial advice.

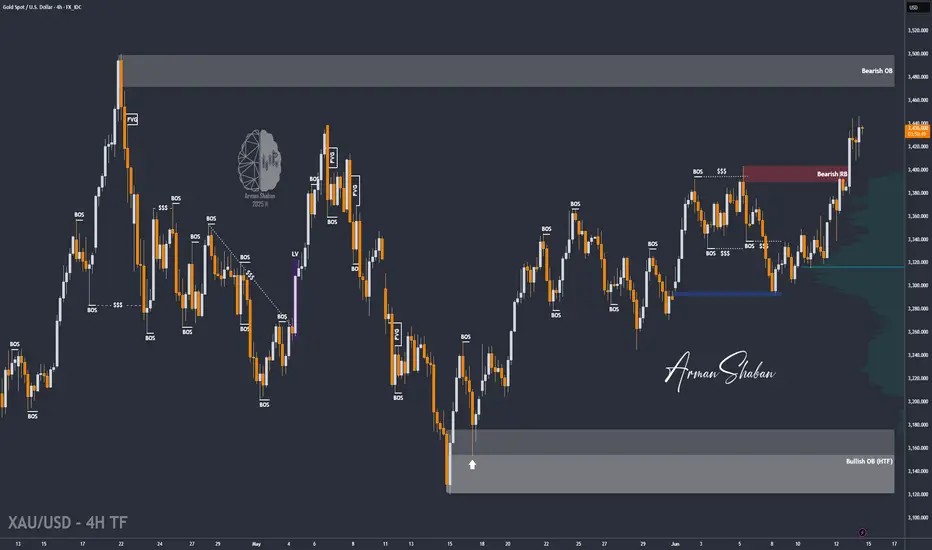
Gold Breaks $3400 – Targets $3500 Amid Tensions (READ)By analyzing the gold chart on the lower timeframe, we can see that today, following Israel's missile and airstrike attacks on Iran, gold experienced a sharp rally. As anticipated last night, gold finally managed to break through the strong $3400 resistance, surging over 600 pips to reach $3447.
Currently, gold is trading around $3438, and given the escalation in geopolitical tensions, I expect further upside movement.
The next potential targets are $3449, $3469, and possibly $3500.
⚠️ Due to ongoing conflict and extreme volatility, it's advised to avoid trading or proceed only with minimal risk exposure.
Please support me with your likes and comments to motivate me to share more analysis with you and share your opinion about the possible trend of this chart with me !
Best Regards , Arman Shaban
EURUSD Under Pressure! SELL!
My dear friends,
Please, find my technical outlook for EURUSD below:
The instrument tests an important psychological level 1.1551
Bias - Bearish
Technical Indicators: Supper Trend gives a precise Bearish signal, while Pivot Point HL predicts price changes and potential reversals in the market.
Target - 1.1458
Recommended Stop Loss - 1.1608
About Used Indicators:
Super-trend indicator is more useful in trending markets where there are clear uptrends and downtrends in price.
Disclosure: I am part of Trade Nation's Influencer program and receive a monthly fee for using their TradingView charts in my analysis.
———————————
WISH YOU ALL LUCK

Gold becomes a strategic anchorPrecious metals continue to climb as investors rush into safe-haven assets following Israel’s airstrikes on Iran, sparking fears of a broader conflict in the Middle East. Many now view the confrontation between Israel and Iran as the most significant geopolitical event since the Russia–Ukraine war. In times of economic turbulence and geopolitical uncertainty, gold once again stands out as a reliable store of value.
Adding to the bullish case, weaker-than-expected U.S. inflation data earlier this week has strengthened expectations of a potential rate cut by the Federal Reserve. This shift has put downward pressure on the dollar and Treasury yields, giving gold even more room to rise.
From my perspective, when geopolitics and monetary policy both signal instability, gold is no longer just a defensive hedge — it becomes a proactive strategy. Holding gold right now is not just about safety — it’s about positioning for a new phase where capital seeks true value and trusted refuge.

SPY: Expecting Bullish Movement! Here is Why:
The analysis of the SPY chart clearly shows us that the pair is finally about to go up due to the rising pressure from the buyers.
Disclosure: I am part of Trade Nation's Influencer program and receive a monthly fee for using their TradingView charts in my analysis.
❤️ Please, support our work with like & comment! ❤️

EURUSD is continuing its uptrendEURUSD is still in a strong uptrend. There was a drop in the Asian and European sessions on Friday but that was not enough to reverse the pair. The end of the US session saw the price being pushed up by the bulls from the 1.155 price zone and is stuck in this resistance zone.
The price continues to increase when breaking 1.155 will head towards the resistance of 1.161, the highest peak of last week. If there is a retest of 1.155, the price will head towards 1.166 next week to be able to use short-term SELL strategies
The BUY strategy is still prioritized as the EU is still in an uptrend. The main BUY zone of the pair is still waiting for 1.150 and lower is the breakout zone of 1.145
Resistance: 1.161, 1.166
Support: 1.150, 1.145

GBPJPY Strong rebound. Buy opportunity.The GBPJPY pair has been trading within an Ascending Triangle pattern. Today's geopolitics made the price form its latest Higher Low at the bottom of the pattern, which also coincided with a 4H MA200 (orange trend-line) test, and rebounded.
That was a clear buy signal on the 4H RSI Support that signaled the last three bottom buys. Our Target is the top of the pattern at 196.300.
-------------------------------------------------------------------------------
** Please LIKE 👍, FOLLOW ✅, SHARE 🙌 and COMMENT ✍ if you enjoy this idea! Also share your ideas and charts in the comments section below! This is best way to keep it relevant, support us, keep the content here free and allow the idea to reach as many people as possible. **
-------------------------------------------------------------------------------
Disclosure: I am part of Trade Nation's Influencer program and receive a monthly fee for using their TradingView charts in my analysis.
💸💸💸💸💸💸
👇 👇 👇 👇 👇 👇

APPLE Trading Opportunity! BUY!
My dear followers,
This is my opinion on the APPLE next move:
The asset is approaching an important pivot point 196.46
Bias - Bullish
Safe Stop Loss - 193.21
Technical Indicators: Supper Trend generates a clear long signal while Pivot Point HL is currently determining the overall Bullish trend of the market.
Goal - 202.06
About Used Indicators:
For more efficient signals, super-trend is used in combination with other indicators like Pivot Points.
Disclosure: I am part of Trade Nation's Influencer program and receive a monthly fee for using their TradingView charts in my analysis.
———————————
WISH YOU ALL LUCK

GBPUSD: Your Trading Plan For Next Week 🇬🇧🇺🇸
GBPUSD formed an ascending triangle pattern on a daily time frame.
Your next signal to buy will be a bullish violation of its neckline.
To confirm a breakout, we will need a daily candle close above 1.362.
A bullish continuation will be expected to 1.37 level then.
❤️Please, support my work with like, thank you!❤️
I am part of Trade Nation's Influencer program and receive a monthly fee for using their TradingView charts in my analysis.
