Facebook Elliott Wave Analysis: Pullback Remains In ProgressHello Traders,
In this Elliott Wave Analysis, we will have a look at Facebook in the 1-hour chart.
Short-term Elliott wave analysis suggests that the rally to $203.55 ended in black wave ((1)). Down from there, the pullback in black wave ((2)) remains in progress in 3, 7 or 11 swings to correct cycle from 3/26/2018 low. The internals of that pullback shows an overlapping structure thus suggesting that the correction takes the form of corrective structure i.e either (W),(X),(Y) or (W),(X),(Y),(X),(Z) structure.
Below from $203.55 high, the pullback is proposed to be unfolding as Elliott Wave double three structure where blue wave (W) ended at 193.11, blue wave (X) ended at 200.75, and blue wave (Y) of ((2)) remains still in progress. The internal of blue wave (W) also unfolded as a double three structure where red wave W ended in 3 swings at $199.31, red wave X ended $202.24 and red wave Y of blue (W) ended at $193.11 as a Flat. Up from there, blue wave (X) also unfolded in 3 swings as Elliott Zigzag structure with red wave A ended at $199.40, red wave B ended at $195.98 and red wave C of blue (X) ended at $200.74 high.
Down from there, blue wave (Y) of black ((2)) remains in progress as another double three structure. Internals of that decline ended red wave W in 3 swings at $192.22 and red wave X ended at $197.45. Near-term focus remains towards $188.92-$186.90, which is 100%-123.6% Fibonacci extension area of blue wave (W)-(X) to end black wave ((2)) pullback. Afterwards, the stock is expected to find buyers for black wave ((3)) higher ideally or should do a 3 waves reaction higher at least. We don’t like selling it into a proposed pullback as the right side remains to the upside in the higher timeframe.
Facebooklong


FB Long After Earnings, Nice Pullback into the Daily 200Facebook gapped up over significant resistance but right into the daily 200. Today, we saw a retest of the 200 SMA. Nature (and the markets) abhor a void, and with stochastics turning up on both the daily and weekly charts, there a good chance FB fills the gap up to 185. Either way the pullback into the 200 made for a nice entry on a 15 minute chart and a wonderful area for a stop.


FB - FaceBook at the low?According to the A/R set, FB will rise. A good target could be the GAP-Fill at the Center.

It seems that the bleeding is over... or not? #FBNASDAQ:FB
It has stopped falling, but there is still no strong bullish sentiment
But beware of taking long positions above 160 or too high, surely we will have a few days of lateral, where it will continue to fall when there is news of Zuckerberg's statements to end up slowly.
In the middle of the ichimoku's cloud and with many resistances such as the averages of 50, 100 and 200 will not be easy to overcome.
Confidence is not immediate, to raise the investor must first forget all doubts about privacy, which will depend if Zuckerberg convinces us.


GAP FILLwe can see a reversal on the daily chart on facebook, the news likes to create noise, but where there is panic, is oppertunity, i predict, from reading the options contracts, this was simply profit taking and noise. by earning i see facebook around the mid 200$'s .....we all know by terms of agreement that when you sign up for social media you have total control of what you show and what you do not. we know our data is harvested and put into the cloud and sold. this is nothing new. at the end facebook is a solid companyand i give it a buy rating with a PT of $250 this year.
red is support, blue is resistance.

Facebook (FB)Not intended as inv. advice. FB has been on a strong upward trend as the majority of Information Technology stocks have been. It keeps coming back to the ascending trend line. If it breaks below this line (on news, profit takers, general market downturn) I would expect it to fall back to the support of .236 Fib.
The Current stock price is above both the 150 day and 200 day moving average.
The 200 day moving avg line is trending up (for at least one month) early in the year.
The Current stock price is trading above the 50 day moving average.
The current stock price is at least 30 percent above its 52 week low. ( 60% above it's 52 week low)
The current price is 99% of it's new high.

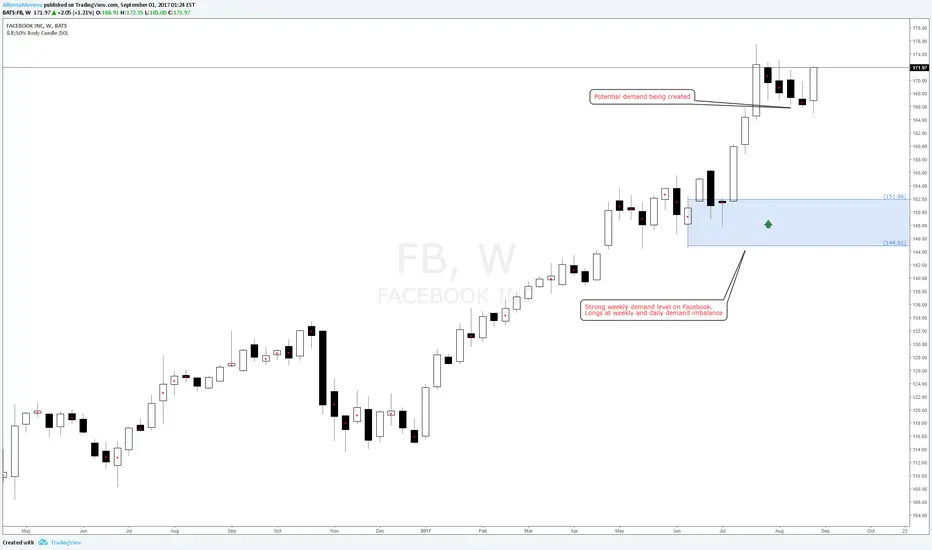
Facebook weekly and daily demand imbalances, long biasStrong weekly demand level on Facebook at 151.96 for long term setups
Longs at weekly and daily demand imbalances
Potential demand being created higher around 166
FACEBOOK bullish trendFB in the near term is technically positive. We recommend an opportunistic buy with an entry below 144.85 with a primary target at 151.53.
FACEBOOK
FACEBOOK
FACEBOOK
FACEBOOK
FB
FB

FB @ 1h @ Outbreak confirmed above GAP last week! This week too?Take care
& analyzed it again
- it`s always your decision ...
(for a bigger picture zoom the chart)
Best regards :)
Aaron

FB @ 1h @ gap recovered back last week, now into alltime highs ?Take care
& analyzed it again
- it`s always your decision ...
(for a bigger picture zoom the chart)
Best regards
Aaron

FB @ daily @ constructive breakup into new alltime highs ?Take care
& analyzed it again
- it`s always your decision ...
(for a bigger picture zoom the chart)
Best regards
Aaron

FB @ 1h @ will Nov`16 GAP takin`over bulls (this 2nd week`17) ?Take care
& analyzed it again
- it`s always your decision ...
(for a bigger picture zoom the chart)
Best regards
Aaron

FB @ daily @ closed 1st time back in Oct`16 GAP ! What`s next ?Take care
& analyzed it again
- it`s always your decision ...
(for a bigger picture zoom the chart)
Best regards
Aaron

long FB @ 15 min @ trading capability for this 52nd week `16Take care
& analyzed it again
- it`s always your decission ...
(for a bigger picture zoom the chart)
This is only a trading capability - no recommendation !!!
Next week i`ll confirm or change my opinion about this SetUp :)
Buying/Selling or even only watching is always your own responsibility ...
Best regards
Aaron

FB @ 1h @ will gap around 116 hold (after juli`16 reversal) ?Take care
& analyzed it again
- it`s always your decision ...
(for a bigger picture zoom the chart)
Best regards
Aaron

FB @ daily @ after 118 didn`t hold, will 113,55 holds ?Take care
& analyzed it again
- it`s always your decission ...
(for a bigger picture zoom the chart)
Best regards
Aaron

long FB @ 15 min @ trading capability for this 51st week`16This is only a trading capability - no recommendation !!!
Next week i`ll confirm or change my opinion about this SetUp :)
Buying/Selling or even only watching is always your own responsibility ...
Best regards
Aaron

FB @ 15 min @ 118 should be defended (all bulls)FX closed last week more or less around weekly high last week before.
Essentiel for all bulls is, at least, in my opinion, the 118 price area (based on 15 min chart), `cause around 118 the upside confirmed at start of last week - and even turned around back to above 120. Last weeks low (117.65) and the end of price channel start (116.95) could be good backup long entries also, next week, if FB comes under pressure. But from the techniacl point of view, nothing is speaking for a price pressure next week - even until 115.07 (last week before low). Why i am pretty slightly optimistic by FB prices above 118, for the next few days (around christmas & year end/start). 121.68 & 122.10 are the prices to beat at first and let left behind to get a constructive bullish upside trend, `cause 2 swallows don`t make a summer! Even two green weeks not a bullish trend :)
Take care
& analyzed it again
- it`s always your decission ...
(for a bigger picture zoom the chart)
This is only a analysis (for swing traders) - no recommendation !!!
Buying/Selling or even only watching is always your own responsibility ...
Best regards
Aaron

FX @ daily @ 119.25 make or break line unti end of this year `16119.25 is the make or break line, in my opinion @ until end of thuis year 2016
Why?
`Cause prices above 119.25 are completing and confirming the w-trend-reversal-wave - under the gap (last 25 trading days). Support lines under the make or break line by around 119.25 are 115.22 & 114.00 price are, which both are even manifesting the w-wave! Independently, if the make or break line more or less by 119.25 holds next week, much more importnat is that until the end of year traders don`t trade under 113.55. Because at prices above 113.55 (and 114 & much more 115.22) it should only be a quest of time when the traders are buying/selling this share above 119.25 and higher again ...
122.10 is the 1st target for bulls
122.98 is the 2nd target for bulls
124.61 is the 3rd target for bulls
But recapturing the GAP of last month is the main scenario for bulls
123.28 lower edge of the GAP
126.28 upper edge of the GAP
`Cause if the bulls win back above 126.28 at least, it should only be a question of time when we trade FB share to new all-time highs - even 133.50 and higher ...
I am still neutral, `cause my last trade was squeezedOut.
Also i don`t have a good feeling, although i am liking what i am see!
How ever, if this week we`re trading above 119.25 maybe i`ll go long over next week :)
Take care
& analyzed it again
- it`s always your decission ...
(for a bigger picture zoom the chart)
Best regards
Aaron

FACEBOOK @ 60 min. Chart @ KnockedOut IntradayChart ...After Trump Election the FANG Shares are under pressure !!!
It seems like that the market is uprating banks, shares & eben the blue chips ???
How ever,
it`s seems lik that facebook will see new yearly lows (even others new all-time highs) !?
Take care,
i am personally out actuallity :)
Take care
& analyzed it again
- it`s always your choice ...
Best regards
4XSetUps
