Double Bottom Formation on U.S. Dollar Currency INDEX (DXY)Unfortunately, we will either watch a big slaughter in the markets or relax as soon as possible, I hope this is a fakeout situation...
Fakeout

Possible Misleading Price ActionThis futures market you see was fake out 2 times before and received a reaction, now there is a possibility of a fake out again. Either this graphic will work or bad slaughter will come...
When we look at the monthly chart, we are momentarily below ma20/M. If we see that we are closing below $40.154 at the end of the month, even 22K would be optimistic.
Strong support and ma100 crossing $10,794. In principle, when one moving average is broken, the price moves to the other moving average; The closest moving average, ma50/M, is crossing 20,637.
So my fuck scenario was that our monthly ma20 was broken and we walked to ma50. But not now, please not now....

gbpchf h4 longHi everyone
Since the price in the high timeframe has an uptrend, we can correct the recent downturn and trade in the uptrend.

How much fake you want ~ BTCHello traders!
This post is all about the fakeness of BTC.
From start to end you will only find fake moves. We can't trust anyone in this world. Just kidding.
If you look from start to end you will find many fake trendline breakouts, and many fake triangle patterns, you will find all types of triangle patterns failed more than it suppose to win. There are many more patterns like Elliot waves, Harmonic, HH Hl, and LL LH patterns that failed more than it supposed to win. You will find your indicator failed tons of times. Support and resistance failed to hold more than it was supposed to hold.
Losing is part of the trading but losing money is not a joke.
Is it the market that plays with us or is it ourselves who are playing with our minds?
Because a triangle pattern is just an illusion, Indicators are also an illusion to satisfy our fake thoughts, maybe. Just like that Elliott waves and harmonics can also be illusions. Because we saw more times it failed than succeed.
Is there any way to succeed more than failure, is there a way to predict everything perfectly. Maybe or maybe not and the best way to find out is to ignore the traditional patterns, and traditional indicators and figure out something new and ask for help from that who have already counted the times you will breathe from your day of birth till the day of death.
Well, I was waiting for BTC to pump/dump and it's in a stressful situation. So I thought I should post something different. Good luck for your future trades.
Thanks for all your support and likes.

Euraud tripple fakeout We know that price manipulation is real. Big trader must find liquidity to fill the order. And this chart show us about that euraud have 3 fakeout and 2 sr flip, and now euraud on supply area and quasimodo with fakeout and flip area, with give best setup to sell
Don't forget to analysis again

usdcad fakeout master set up usdcad is preparing to form a fakeout pattern with three resistances and a fairly small fakeout area. I'm trying to minimize my area to get a good enough area. From the h4 timeframe I scaled down to the m15 timeframe and found a point that was quite optimal with low risk. enough to use SL only 20 pips with a high risk reward ratio of approximately 1:10
note : minimum risk and reward : 1:2

BTC is preparing for a fakeoutHello traders!
Previously market pumped from 39250 and it was not a true pump. If we look below 39250 there is a true reversal point at 38786 waiting to be activated. The reason I call it a true reversal point is because it's the correct point of reversal and if the market moved up before touching the true point then it's not the true pump.
Currently, the market has formed a triangle pattern and I am expecting a breakout of this pattern towards the downside. I always tell you never to go towards the breakout just do the opposite to win. The same thing will happen here the market will give a breakout downwards and as a reaction of traders, it will pump.
According to the True reversal point strategy, the market will pump exactly from 38786. The calculation error cannot be more than 50$ means the true reversal point range is 38736 to 38836.
Don't forget to hit the like button and follow to stay connected.

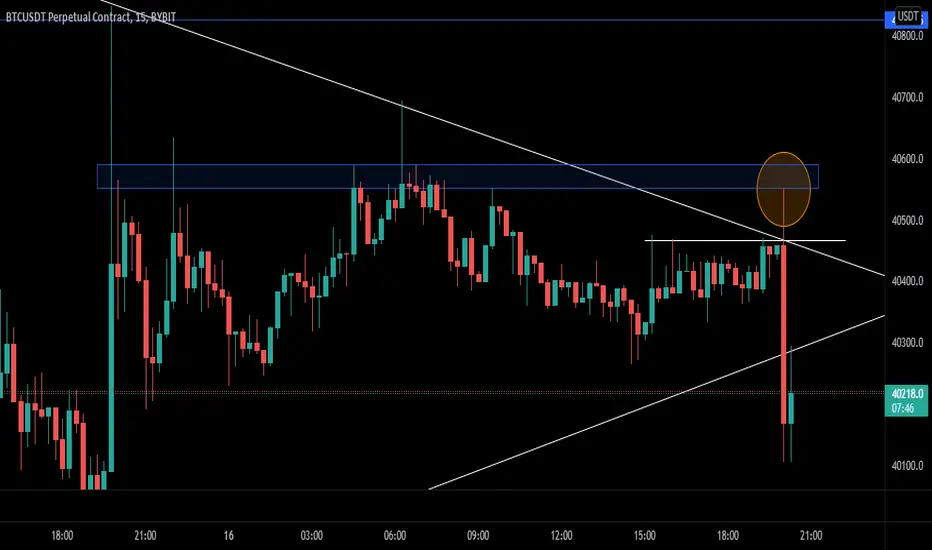
There Might be a fake out very soonHello lovely people.
As I experienced while trading before, we may see a fake out which will liquid lots of "Long Positions"
I draw the possible Fake Out Range in chart as you can see.
be more cautious at this time and don't be a victim to get "liquid" at this Area.
see you soon :))

BTCUSD Price Action H12 ChartYou can check out my view on the HTF BTC trend, by checking out the link to the related ideas section.
As you can see, the HTF demand level worked as expected and the buyers pushed the price above the mid-Monday level. However, in order to speak of an uptrend first, the price should clear the 43980 level and should hold the red box area with a retest. Then, we can expect the price to visit the orange level(which is self-explanatory).
However, if the price only leaves a wick(which would be a stop hunt and a trap for bulls) at the red box or slightly above, then the traders can assume the selling pressure in this area is still high and can use the same area as a short setup zone.


FakeOutsWe could verify that the Breakout is Valid Or not By seeingVloume ticks Perfect Example Implement in ths Btc Example !!
Not A Financial Advice.
HAppy Trading.

Neat Line of Support, Wait for Fake OutThe candlestick has the neat lows with the similar levels of the wicks, I put rectangle on them.
Wait the price to break it to eat the stop loss. The price is projected to touch the supply area.
Put the stop loss away from the swing low to prevent stop loss hunts.

EURGBP at Major lever of support Most interesting thing about this set up was we had a monthly fakeout at a major lever of support
A nice bullish candle away from that area
A long move
Plan the trade trade your plan

Support and resistance fakeouts EURUSD is at major resistance zone most importantly we had a *fakeouts*
SL @ 1.11620
Tp1 @ 1.09445
Tp2 @ 1.08307
But we have to let price commit first to the downside give you an entry (depending on your trading strategy)
It's a long way down be patient 💯

Market makers looking to trap more bears?If we look back at past PA, we can see how MMs break trend to increase shorting to spike in their face.. low volume this weekend could be a nice fakeout setup for monday. targets around 43
mms=market makers
see my indicator pvsra volume suite for more definition

GBPUSD OVERALL BULLISHGBPUSD completed the inverted head and shoulder pattern, and we expect price to rally up to 1.34300

usdchf trading planusdchf has the potential to form a fake out set up with the buy area triggered at 0.92607 so I predict that usdchf has the potential to move up with the farthest target at 0.94412

Capitulations or fakeouts are good signalsThis is a long fakeout in the chart of $ENPH. We look at this fakeout after it brakes a trendline and you don't find continuation to the downside after retesting the break.
After this, the fakeouts market liquidates many MANY sell positions and call options that they do 2 things:
Scare the sellers with bad loses
Add tons of liquidity or volume around these prices.
Plus, the MACD gives a delayed, but great signal to ATH. And the fundamentals are looking great:
www.etoro.com
So, I can do 2 things, go for different mini trades in the 4 hours allocating 0.5% to 1.5% of my portfolio and leveraging those either X2 or X5. Or I can go the low-risk option and add a larger allocation, up to 5%, and just let it be there.
1) Short-term trading (swing trades) with low leverage:
The Pros of this strat are having more capital to open other trades like BTC (which is moving now) or just having cash for hedge purposes.
The Cons is the risky trades as I can lose that capital easier in this way as the short-term trades are usually fewer probability trades.
2) Long-term position with higher allocation.
On the contrary, a long-term position is a higher probability trade, not a time-consuming (a simple SL and TP order would do) position, but it allocates a large amount of capital.
I'll try to do half and half this time.
Let me know what you think about this

gbpjpy trading plangbpjpy has successfully completed the fake out set up so it will move up but above there is already an h4 resistance with supply still being touched once, this can create an opportunity to counter the trend so you will get a decent profit
the small supply area at 157.6 - 157.7 will be the best sell entry area for me, but remember to see if there is confirmation or not

gbpusd fake out set up gbpusd has the potential to form a fake out set up, this is still wishful thinking, I think, because I'm still learning this method, it's a good idea to re-analyze this
1.33778 is a resistance area with a support area at 1.31605 , the price is expected to move up first and fall on fake resistance at least one time and make a fake out

BTC fakeout and continuation of Wyckoff accumulationAs you can see, we're at the same point as we were in the last wyckoff accumulation, where we broke out of a descending channel only to be rejected at the RSI trendline.
I've long been observing that the current drop is a smaller version of the May 2021 accumulation phase and at this very moment, it is behaving the exact same way. We're probably going to get rejected and bleed down to the 43-41k.
When comparing the fakeout of May 2021, we reached the upper levels of the Automatic Reaction (AR). If we were to follow this path, we will see a rejection around 51K.
History doesn't repeat, but it often rhymes.

Higher Trading Range Currently Unsustainable!We've seen BTC attempt to stay in the higher trading range but quickly gets pulled right back into the lower range. I am not bullish on bitcoin until it can trade in the higher range and shows the strengths of breaking out of that one as well. This is essentially a continuous fake out or bear trap happening.
Don't trade with what you're not willing to lose. Safe Trading, Calculate Your Risk/Reward & Collect!
Love it or hate it, hit that thumbs up and share your thoughts below!
This is not financial advice. This is for educational purposes only.
