EURUSD seems back on track for long continuation.Price did tap into a bigger liquidity pool at around 1.142 and showed a strong change in momentum with an impulsive move to the upside. Price is now in a consolidation phase and left a small Liq.Point at 1.1516, which could act as a base for a continuation structure. The longer it takes for price to tap into said area, the better. I am now looking for a minimum of a 2-touch bullish continuation to enter a long trade into the previous highs.
*** **** *****
👉 The pairs I publish here are usually discussed in detail in my Weekly Forex Forecast (WFF) and are now showing further developments worth mentioning.
Remember, technical analysis is subjective; develop your own approach. I use this format primarily to hold myself accountable and to share my personal market views.
⚠ Ensure you have your own risk management in place and always stick to your trading plan.
*** **** *****
Falconfx

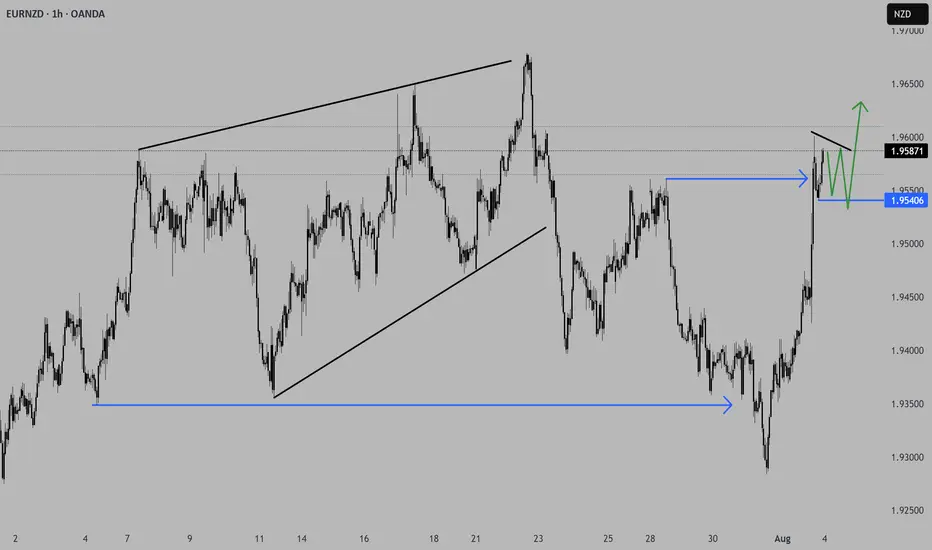
EURNZD shows signs for a continuation long.Price did finish the initial selloff into the start of the HTF 3-touch structure with a 1-2-3 move and started to aggressively reverse. We saw price turning bullish again and is now trading through an AoI and starting to form a consolidation. Price left a small Liq.P, which could act as a base, and if we see price stalling in this area and forming some kind of bull flag, that would be deliberate PA for a continuation to the upside, with the previous high as initial target.
*** **** *****
The pairs I publish here are usually discussed in detail in my Weekly Forex Forecast (WFF) and are now showing further developments worth mentioning.
Remember, technical analysis is subjective; develop your own approach. I use this format primarily to hold myself accountable and to share my personal market views.
⚠ Ensure you have your own risk management in place and always stick to your trading plan.
*** **** *****
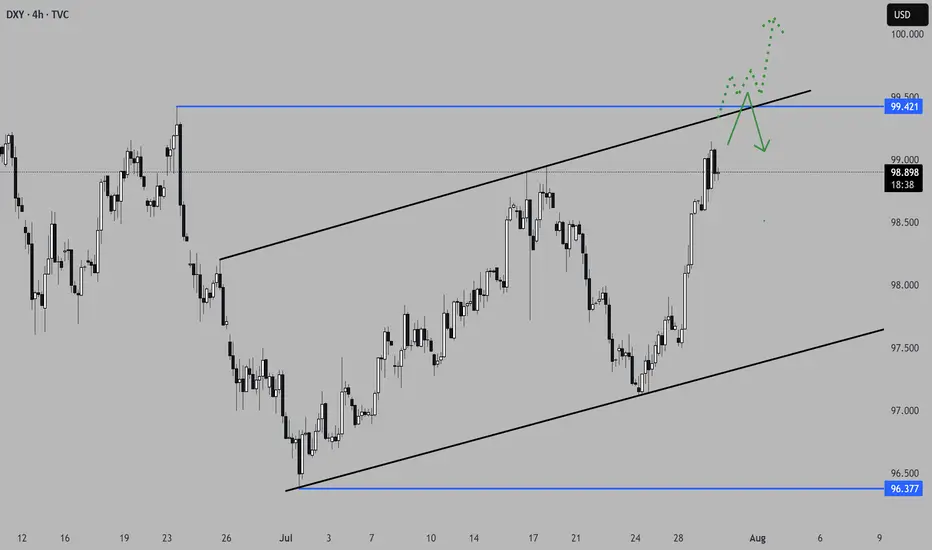
Interesting few days ahead... USD pairs approaching key levelsDXY is finishing a HTF consolidation and is approaching medium-term key areas. Other USD pairs are also in areas where they could aggressively turn around. EURUSD just finished a H4 3-touch continuation flag and is starting to stall on the 3rd touch, suggesting indecision in the markets.
Considering the news events in the next 3 days, starting today with USD advanced GDP data, we could see volatility kicking in on these key levels. We do need a catalyst to push price into a larger directional move, and we are prime positioned for the next leg. Technically, a breakout in both directions would make sense in these areas. Time to set alarms and be vigilant but not jump into trades too early, considering NFP on Friday as well.
*** **** ****
📈 Simplified Trading Rules:
> Follow a Valid Sequence
> Wait for Continuation
> Confirm Entry (valid candlestick pattern)
> Know When to Exit (SL placement)
Remember, technical analysis is subjective; develop your own approach. I use this format primarily to hold myself accountable and to share my personal market views.
The pairs I publish here are usually discussed in detail in my Weekly Forex Forecast (WFF) and are now showing further developments worth mentioning.
⚠ Ensure you have your own risk management in place and always stick to your trading plan.
*** **** ****
GBPCAD a short-term long trade into a HTF short area.GBPCAD presents a potential LTF long trade into a HTF short area. I am overall still bearish biased, but considering we have gaps to the top of the structure we might get an opportunity for a short-term counter long trade to finish the consolidation before we see the next bigger move to the downside.
📈 Simplified Trading Rules:
> Follow a Valid Sequence
> Wait for Continuation
> Confirm Entry (valid candlestick pattern)
> Know When to Exit (SL placement)
Remember, technical analysis is subjective; develop your own approach. I use this format primarily to hold myself accountable and to share my personal market views.
⚠ Ensure you have your own risk management in place and always stick to your trading plan.

AUDUSD looks promising for a continuationThis pair presents a potential trade opportunity in the form of a short continuation. The price did reach a significant Area of Interest (AoI) in form of an expanding 3-touch structure before turning around. Price did close outside the structure on the H4 with a candlestick reversal pattern and printed a bearish high-test candle on the daily timeframe. This clearly shows a shift in momentum and I am now waiting for a lower time frame (LTF) continuation pattern to confirm the direction and a valid candlestick pattern for entry.
📈 Simplified Trading Rules:
> Follow a Valid Sequence
> Wait for Continuation
> Confirm Entry (valid candlestick pattern)
> Know When to Exit (SL placement)
Remember, technical analysis is subjective; develop your own approach. I use this format primarily to hold myself accountable and to share my personal market views.
⚠ Ensure you have your own risk management in place and always stick to your trading plan.

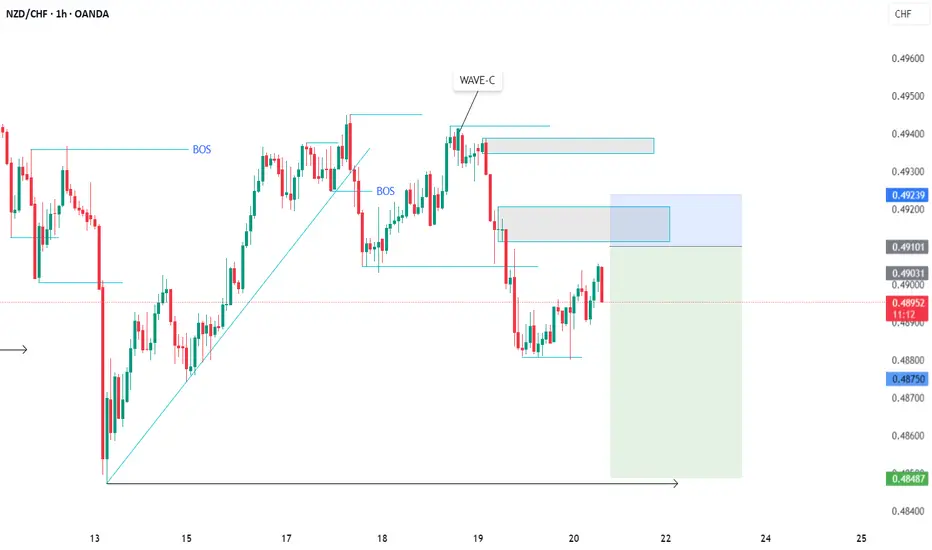
NZDCHF SELLWe have officially gotten a change of trend as proven by the transition from a sequence of higher highs and higher lows to a lower low and lower high. Stacked on top of this sequence is a pullback for a retest of a key level confirming our setup.
Realistic Top Down Analysis I don't sell anything or provide financial advice, I just enjoy analysing my charts. You can use my videos as ideas and please feel free to comment, share your ideas,tips and subscribe. Thank you.

Potential Rising channel USDCADPrice is potentially about to form a rising Chanel towards a 1Hr downward trendline. Awaiting s third touch confirmation on the 5min upward trendline or a touch on the 1Hr downward trendline to confirm a potential drop in price towards Take profit area as label in the chart analysis.

Continuous bullish flagPrice is forming a continuous bullish flag, if flag is completed price will move upwards towards nearest previous lower high/liquidity.

USDCAD chart pattern breakout A possible breakout of a continuation flag in the 4hr timeline. If breakout occurs then price will move upwards to previous highest high, an area of interest/take profit.

Bearish flag breakout on EURUSD 4hr A potential bearish flag breakout on the 4hr timeline is forming. Place stop orders below area of possible breakout & stop loss above chart pattern, take profit near previous lowest low.

Head & Shoulders formation / AUDCAD A head and shoulders pattern has formed over time, price broke through & retrac ed back near the neckline. Place buy pending order above a few pips, a $35 stoploss(depends on individual capital) and a $100+- take profit (depends on individual capital).

Pattern within a pattern confirmation // EURGBP shortA reversal channel pattern is forming on the 1hr time frame, within a bearish flag that was formed in a HTF (4hr - Daily) of the EURGBP. If the price completes the reversal channel pattern, then there's a high probability of price dropping towards the weekly support area or reverse on the trendline that was formed by the falling wedge Pattern on the HTF (Daily).
Place a pending order on the 15m time frame near the top of the reversal channel that is potentially forming currently.

Analysis on USDJPY [ 27 February 2024 ]Good Day fellow viewer. I am new to this youtube thing so I'll just be posting my analysis on certain pairs everyday. I am not an expert or a pro, I just enjoy analysing charts. Please enjoy and also enjoy the upcoming videos. I don't provide financial advice or sell anything. All the videos will just be my personal thoughts on which direction price will go. These are not signals but you can use my videos as an idea. You are all free to share your thoughts in the comment section. Please like the videos and subscribe. Thank you.
#forex #forextrading #usdjpy #trading #falconfx

Falling wedge PatternPrice will tap in to the bottom trendline of the pattern formed and move towards completing 90% of the pattern on the daily timeframe.
However, if price breaks the bottom trendline to reach the previous weekly support area, then it will tap in to that liquidity and price will potentially shoot upwards to complete 90% of the pattern formed on the daily timeframe.

Potential Head & Shoulder formationPrice seems to potentially form a large head & shoulder pattern. If formation completes then a heavy price fall is expected to reach a bottom key level.


EUR/JPY, AUD/JPY, EUR/AUD and USD/CHF on watch for me today.EUR/JPY:
• If price pushes up to and ideally just above our upper trend line and the last part of the move is corrective, then I'll be looking to get short with a risk entry after a phase line break on either the fifteen minute or the one hour chart.
• If price pushes up to and ideally just above our upper trend line and it does so impulsively, then I'll be waiting for a convincing impulse back down followed by a tight flag and then I'll be looking to get short with a reduced risk entry on the break of the flag.
• If price only pushes up to and ideally just above our rayline, then regardless of how it does so I'll be waiting for a convincing impulse back down followed by a tight flag and then I'll again be looking to get short with a reduced risk entry on the break of the flag.
• If none of these setups present themselves then I will simply wait until another setup which meets my plan materialises.
• If there's any ambiguity then I will not place any of these trades.
AUD/JPY:
• If price pushes up to and ideally just above our upper trend line and the last part of the move is corrective, then I'll be looking to get short with a risk entry after a phase line break on either the fifteen minute or the one hour chart.
• If price pushes up to and ideally just above our upper trend line and it does so impulsively, then I'll be waiting for a convincing impulse back down followed by a tight flag and then I'll be looking to get short with a reduced risk entry on the break of the flag.
• If price only pushes up to and ideally just above our rayline, then regardless of how it does so I'll be waiting for a convincing impulse back down followed by a tight flag and then I'll again be looking to get short with a reduced risk entry on the break of the flag.
• If none of these setups present themselves then I will simply wait until another setup which meets my plan materialises.
• If there's any ambiguity then I will not place any of these trades.
EUR/AUD:
• If price pushes down to and ideally just below our lower trend line and the last part of the move is corrective, then I'll be looking to get long with a risk entry after a phase line break on either the fifteen minute or the one hour chart.
• If price pushes down to and ideally just below our lower trend line and it does so impulsively, then I'll be waiting for a convincing impulse back up followed by a tight flag and then I'll be looking to get long with a reduced risk entry on the break of the flag.
• If price only pushes down to and ideally just below our rayline, then regardless of how it does so I'll be waiting for a convincing impulse back up followed by a tight flag and then I'll again be looking to get long with a reduced risk entry on the break of the flag.
• If none of these setups present themselves then I will simply wait until another setup which meets my plan materialises.
• If there's any ambiguity then I will not place any of these trades.
USD/CHF:
• If price pushes up to and ideally just above our upper rayline, then regardless of how it does so I'll be waiting for a convincing impulse back down flag and then I'll be looking to get short with a reduced risk entry on the break of the flag.
• If price simply impulses back down below our lower rayline and a subsequent tight flag forms, then I'll once again be looking to get short with a reduced risk entry on the break of the flag.
• If price simply impulses back down below our most recent corrective channel and it starts to correct but it doesn't correct below our lower rayline, then I'll be waiting for this correction to turn into a one hour flag and then I'll once again be looking to get short with a reduced risk entry on the break of the flag.
• If none of these setups present themselves then I will simply wait until another setup which meets my plan materialises.
• If there's any ambiguity then I will not place any of these trades.

GBP/USD, AUD/JPY, NZD/JPY and USD/JPY on watch for me today.GBP/USD:
• If price pushes up to give us a confirmed second top and the last part of the move is corrective, then I'll be looking to get short with a risk entry after a phase line break on either the one hour or the fifteen minute chart.
• If price pushes up to give us a confirmed second top and the last part of the move is impulsive, then I'll be awaiting a subsequent convincing impulse down followed by a tight flag and then I'll be looking to get short with a reduced risk entry on the break of the flag.
• If neither of these setups present themselves then I will simply wait until another setup which meets my plan materialises.
• If there's any ambiguity then I will not place either of these trades.
AUD/JPY:
• If price pushes down to give us a confirmed second bottom and then it pushes up to give us a confirmed second top and the last part of the move is corrective, then I'll be looking to get short with a risk entry after a phase line break on either the one hour or the fifteen minute chart.
• If price pushes down to give us a confirmed second bottom and then it pushes up to give us a confirmed second top and the last part of the move is impulsive, then I'll be awaiting a subsequent convincing impulse down followed by a tight flag and then I'll be looking to get short with a reduced risk entry on the break of the flag.
• If neither of these setups present themselves then I will simply wait until another setup which meets my plan materialises.
• If there's any ambiguity then I will not place either of these trades.
NZD/JPY:
• If price pushes down to give us a more horizontal pair of bottoms and then it pushes up to and ideally just above our rayline, then so long as the last part of this move up is corrective I'll be looking to get short with a risk entry after a phase line break on the one hour or the fifteen minute chart.
• If price pushes down to give us a more horizontal pair of bottoms and then it pushes up to and ideally just above our rayline then so long as this move up is impulsive I'll be awaiting an impulse back down below it followed by a tight flag and then I'll be looking to get short with a reduced risk entry on the break of the flag.
• If neither of these setups present themselves then I will simply wait until another setup which meets my plan materialises.
• If there's any ambiguity then I will not place either of these trades.
USD/JPY:
• If price pushes up to and ideally just above our higher time frame rayline, then regardless of how it does so I'll be waiting for a convincing push back down below both it and the lower ascending trend line of the corrective channel to the left followed by a tight flag and then I'll be looking to get short with a reduced risk entry on the break of the flag.
• If this setup doesn't present itself then I will simply wait until another setup which meets my plan materialises.
• If there's any ambiguity then I will not place this trade.

GBP/USD on watch for me today.GBP/USD:
• If price pushes up to and ideally just above our upper trend line and the last part of the move is corrective, then I'll be looking for a risk entry after a phase line break on either the one hour or the fifteen minute chart because we will have had a completed three touch structure.
• If price pushes up impulsively to and ideally just above either our upper trend line, our upper rayline or our lower rayline, then I'll be waiting for a convincing push back down followed by a tight flag where I'll be looking for a reduced risk entry on the break of the flag and if the flag forms just below our lower rayline as illustrated I'll be hiding my stop loss above it for extra protection as illustrated.
• If price pushes up to and ideally just above our lower rayline, then regardless of how price does so I'll be waiting for a convincing push back down followed by a tight flag where I'll be looking for a reduced risk entry on the break of the flag.
• If none of these setups present themselves then I will simply wait until another setup which meets my plan materialises.
• If there's any ambiguity then I will not place any of these trades.

WTICO/USD, USD/JPY and AUD/USD on watch for me today.WTICO/USD:
• If price pushes up to and ideally just above our outer structure upper rayline, then regardless of how it does so I'll be waiting for a convincing impulse back down followed by a tight flag and then I'll be looking to get short with a reduced risk entry on the break of the flag.
• If price only pushes up to and ideally just above the upper rayline of our most recent piece of structure, then regardless of how it does so I'll once again be waiting for a convincing impulse back down followed by a tight flag and then I'll again be looking to get short with a reduced risk entry on the break of the flag.
• If neither of these setups present themselves then I will simply wait until another setup which meets my plan materialises.
• If there's any ambiguity then I will not place either of these trades.
USD/JPY:
• If price impulses back down below the upper trend line of our most recent piece of structure, it does so in a convincing manor and a subsequent tight flag forms, then I'll be looking to get short with a reduced risk entry on the break of the flag.
• If this setup doesn't present itself then I will simply wait until another setup which meets my plan materialises.
• If there's any ambiguity then I will not place this trade.
AUD/USD:
• If price impulses back up, it does so impulsively and in a convincing manner and a subsequent tight one hour flag forms, then I'll be looking to get long with a reduced risk entry on the break of the flag.
• If this setup doesn't present itself then I will simply wait until another setup which meets my plan materialises.
• If there's any ambiguity then I will not place this trade.

EUR/JPY, USD/JPY and USD/CAD on watch for me today.EUR/JPY:
• If price pushes up to and ideally just above our rayline, then regardless of how it does so I'll be waiting for a convincing impulse back down followed by a tight flag and then I'll be looking to get short with a reduced risk entry on the break of the flag.
• If this setup doesn't present itself then I will simply wait until another setup which meets my plan materialises.
• If there's any ambiguity then I will not place this trade.
USD/JPY:
• If price continues to correct between now and I'm awake to place the order then I'll be looking to get short with a reduced risk entry on the break of this tight one hour flag.
• If this setup doesn't present itself then I will simply wait until another setup which meets my plan materialises.
• If there's any ambiguity then I will not place this trade.
USD/CAD:
• If price breaks the upper descending trend line of our most recent piece of structure, it does so impulsively and in a convincing manner and a subsequent tight flag forms, then I'll be looking to get long with a reduced risk entry on the break of the flag.
• If this setup doesn't present itself then I will simply wait until another setup which meets my plan materialises.
• If there's any ambiguity then I will not place this trade.
