BTC Falling WedgeBTC price is now falling back into the triangle pattern I created a few days ago, (you can take a look at it in my profile) and I think around $7000 will be our support level.
What do you think?
Falling

potentially in a very long and ugly falling wedge A look at a potential weekly falling wedge we are back inside. If valid we could potentially see price continue to grind slowly downwards until the middle of next year...Hopefully we break upwards from here but if not it will likely just be yet another chance to pickup crypto at a nice discount. **Not Financial Advice**


btc already attempting the deathcross fakeout?Looks like we may even break up from the wedge earlier than i was anticipating as we are witness a crazy amount of bullish volume in the last couple 1 day candles and btc has fought it's way valiantly back above the deathcross and is currently retesting the top trendline of the falling wedge multiple times as solidified support! if btc can maintain the top trendline of the wedge as support for the next 2 to 3 1 day candles it will almost certainly confirm the wedge breakout here in which case we have 2 two potential breakout targets. 1 at 12.9k and 1 at 13.6! if we were to hit either of these 2 targets it would save the bull market and we would likely continue much higher than that soon after but it all hinges on confirming this breakout 1st and maintaining support above the deathcross to insure it flips back into a sustained true golden cross


USDCAD Long Falling wedge on 15m chart,
Hitting longer term support,
Hitting support zone around S1,
Low volume and low price meaning price will get more narrow,
Lil shooting star on the 15m frame.
Possible Long Position,
ENTRY:1.31024
TP:1.31232
SL:1.30861

DowJones Falling Sign in 2020World Distrust
Sanction
economic War
The leading challenges of technology companies and issues of sales and purchasing power in the world

Falling wedge on XRP This falling wedge traditionally marks the end of a downtrend, the set-up is perfect for XRP. Ideally touch the lower support level once more either at 19c or 16c, then we should see a significant bullish more.

EU SellHave been following EURUSD some. Still newer to trading. However, I do see a gap in the market lower down on the weekly. Price may come down to there. Was looking for a sell setup as a previous buy from a couple weeks ago did not pan out. And here, we may have made a new lower high before dropping down again. Taking the fib tool and we can see how price has reacted right off of there. As traders, we also know price could retrace back up, maybe take a second position. For now, I have a small position that is headed downward.

We appear to be in a daily fallling wedge. I'm hypothesizing 2 potential breakout zones of the 1 day falling wedge price acton appears to be in. Still have 2 potential bear targetts currentl in play as well.

BNBTC - Bull ScenarioWhile I do believe you should always have a bear and bull scenario. The bear scenario for this if it will break support which is inline with the Fibonacci ratio.
Using Elliott Wave Theory after an impulsive 5 count (1-2-3-4-5) movement. Likelihood of the price action correcting is high thus followed by an ABC classic ZigZag pattern which is a 535 pattern. Inline with the Trend based Fibonacci plotted from Wave 0->A->B shows Wave C is at 1.618 golden ratio which is showing as a strong support which the correction phase might be over already with an impulsive 5 count (1-2-3-4-5) diagonal movement.

BTCUSD: Further decline imminent, Accumulation phase.Please leave feedback and opinions if you disagree I'm open to criticism.
like or follow if you agree. And I'll return the favor.
The above chart is based on the line break technical analysis.
I have drawn out the forcasting Bollinger band path of movement.
1 day chart we have bounced off the 20 day moving average, we are now below both the 20 and 50 day moving average, if Bitcoin attempts a recovery we won't see $10,000 again. 10k is gone. The 20 day moving average has become strong resistance and we are heading down further for accumulation prior to halving in May.

Short the ponzishort it. the bankers wont let bitcoin grow, So we short and give arthur hayes money instead when he liquidates our positions.

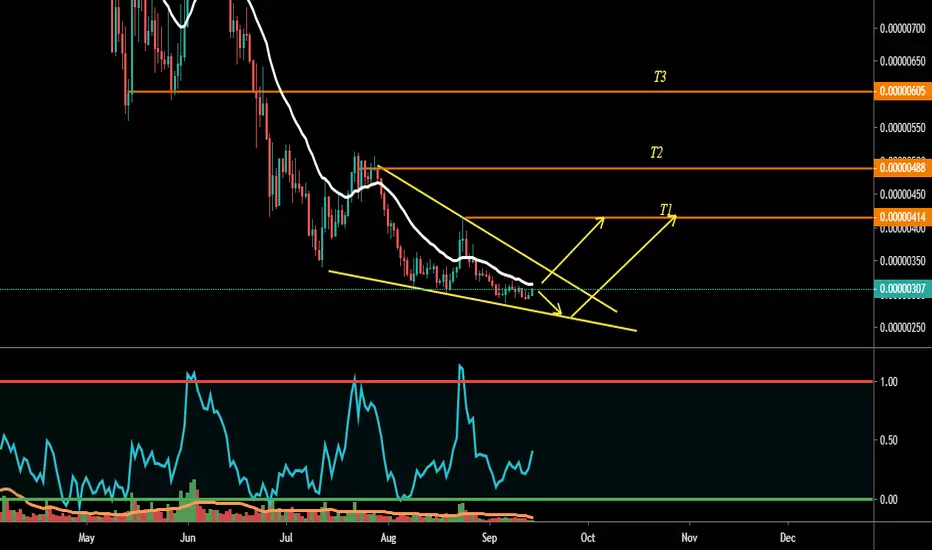
RVN coin Mid term Analysis!!Breakout of falling wedge can trigger a trend reversal which can easily give us a 100% profit in the midterm
BTC breaking up from falling wedge. Target: 10.6-10.8kA great sign as it appears BTC is finally breaking up from it's falling wedge. It appears the biggest of the potential falling wedges(the dotted purple one) may be the most valid...in which case the projected break out target is around 10.6-10.8k. This should allow us to break up from the 1 day charts green bull pennant too at the very last minute which should lead to additional upside...I anticipate this will take us up to the neckline of the inverse head and shoulder pattern we've been watching for some time now.

BTC/USDT (4H) Will BTC Break out of the Falling Channel?BTC is continuing to go toward the upper border of the falling channel. Buyer is dominating so far. The main resistance stays at the upper border of the channel. If we break it - the upper targets will be open for us. Good luck everyone!

VIBEBTC Falling Wedge PatternBir cok altcoin haftalik grafikerlinde yukselise gecmek istiyor. Hacim güzel. Gunluk gorunum ve hedefler burada:


NEOBTCSeems like a falling wedge is forming here, but probably not done yet. If I am correct, it will bounce one more time forming a divergence and then breakout will occur.

ONTBTC breakoutFalling wedge and a divergence suggests that there is a pretty high chance for a breakout soon.
