BITCOIN be careful to end of August! BTC may drop to 8.000 USD When we look to the 4 hour chart, we can see a head&shoulders pattern is forming. First shoulder started July 17th and ended in July 28th. And than head formation started in July 29th and ended in August 15. Seems like second shoulder has also started in August 15th.
We can guess that the second shoulder formation would also take around 11 days as well, and the fall down will be starting at the end of August.
Strategy : Sell BTC when the price go up to 11.500 which will be near to the top of second shoulder.
First target will be the height of shoulders and around 8.100-8.200
Second target will be the height of head and that is around 7.300-7.400
Falling


4hr diamond bottom appears to be playing outNo guarantee it will follow through and I'd like to see a slight bit more volume to confirm but it appears we have a 4hr chart diamond bottom breakout. If so it should reach the breakout price target I have posted here and I expect then on this current pullback for the yellow horizontal trendline at 9646 to retest as and maintain support in which case we will then head back up towards the diamond bottoms breakout target. If this were to occur it greatly increases the chances that we will trigger a breakout from the 1 day falling wedge pattern as well which if triggered here has a breakout target of 11.5k. We still have a potential gap to fill at 8.5k and must continue to keep that in mind but that could happen before we breakout of the wedge, after, or possibly even not at all...so instead we must focus on the price action at hand and only worry about factoring that in if the charts show we are heading that way.

3&4hr chart invh&s & fallingwedge nullified. zooming out to 1dayafter the 3hr50ma refused to submit to the bulls at the invh&s neckline thee bears dumped it below the head and nullfiied the 4hr falling wedge at the same time. This is a great example of why selling at a neckline in a correction phase like this can be a very very smart move if you set a smart stoploss buy-in a few pips above the neckline. Since the smaller time frame patterns were getting nullified it was time to zoom out and take another look at the daily chart which we can see a nice falling wedge forming on as well with a strong horizontal support at 8504. That is of course a good sign for the bulls but we must also remember we are under the double tops neckline and have already closed 1 candle below it this could be the confirmation candle for it and if the double top is triggered that drop target is just under 6k! While not impossible I think he 8504 zone will likely be enough of a strong support zone to keep things a float and once the 3 day golden cross solidifies and sustains itself the correction should be finished up and ready to resume bullmode. For now the battle is 1 day falling wedge vs. 1day doubletop

A 4hr falling wedge has emerged as the current dominant patternAfter seeing price action climb up and reject right at the top trendline of this falling wedge then fall back down and find support right at the bottom trendline of this falling wedge I can now say with a fair amount of certainty that the h&s patterns were decoys cloaking this falling wedge which seems to have now emerged as the most legitimate current chart pattern. I anticipate one more bounce down and up before a breakout will occur and maybe even on the final bounce down a wick that dips a decent ways below the bottom trendline...possibly even to that 8500 cme gap everyones been waiting on. I wont be risking waiting on that though and will be playing the trendlines instead and if we do dip down that low I'll simply buy the dip. I think we may continue to consolidate like this until the 3 day golden cross which should occur in the first week or 2 of august. Once that happens I anticipate it will help us to climb 87% percent in price just like the 2day golden cross and the 1 day golden cross before it both did. Quick rule of thumb: Falling Wedges and h&s tend to simultaneously develop quite often...so if you spot one the others probably hiding somewhere in there as well...and on the flipside of the coin, inv h&s and rising wedges.

BTC Falling Wedge ? Bull Run?Hello Traders,
New Thesis on BTC,
Points to consider
- Resistance at $10,800 - $11,000 Zone
- Support at $9000 - $9200
- Stoch on downwards momentum
- RSI on downwards trend respecting resistance
- Bounce from support straight into resistance, .382 Fibonacci Retracement acting as CONFLUENCE
- EMA's acting as support but looks weak
- Volume is declining, signalling a big move is about to come
- Possible falling wedge ( Bullish Pattern), we need more touches to confirm
- Fib-extension targets show a possible retracement to $7918 area
BTC with a high degree of probability is forming a new higher low in this immediate down trend, confirming this will be another touch in the potential falling wedge pattern.
The fib extenuation shows possible targets, only if the pattern is obligated. One major retracement level is the green zone, showing confluence with previous support. This will be a very healthy retracment for BTC, a macro higher lower would be put in..
Will this confirm the bull run?
What are your thoughts?
And remember,
“We simply attempt to be fearful when others are greedy and to be greedy only when others are fearful.”
Warren Buffett

Price action reaches falling wedge breakout target preciselystill up in the air whether or not we will fill the gap at 11.2k but my prediction that we would hit the falling wedge breakout target has been met with exact precision...I was assuming we would hi there and then fill the 11.2k gap on fomo alone before going back under the inv h& s neckline and confirming a fakeout. Still a chance we can rise to 11.2k or even confirm the inv h&s breakout and reach 12.5k however for now the price we hit happens to be a precise location for a double top to start to paint on the chart so whales may try to threaten a new smaller double top here. If we reach 11.2k i will be laddering out small profist.


If wedge breaks up on current 4hr candle target= 11.9kI was anticipating we would break out of the wedge slightly lower here bu considering the previous 4hr candle closed as a bullish engulfing candle we could close the current one above the wedge and maybe even break here...if no I anticipate the 9924 horizontal will be the zone we break up from. I still think its quite likely we will be retesting the 1 day 50ma again before the larger 1 day and weekly consolidation is through.

Decred could pumpThe Decred ETH pair has caught my attention for a while. I am fully locked and loaded since the bottom of the wedge, will be interesting if it breaks out.
- Matt DOG

Could MATIC make us all rich? (or will alts just die)I don't know what matic is, but this coin has been forming a bullish falling wedge pattern for a while now. could this be the bottom of a huge bull run in the future? will altcoins just continue to die after all of these coins finish going up? I have no idea. but if you are just looking for an in-and-out trade instead of a long term investment I would certainly suggest to look at matic and some of these other altcoins that seem to be forming very big falling wedge patterns in BTC valuation.

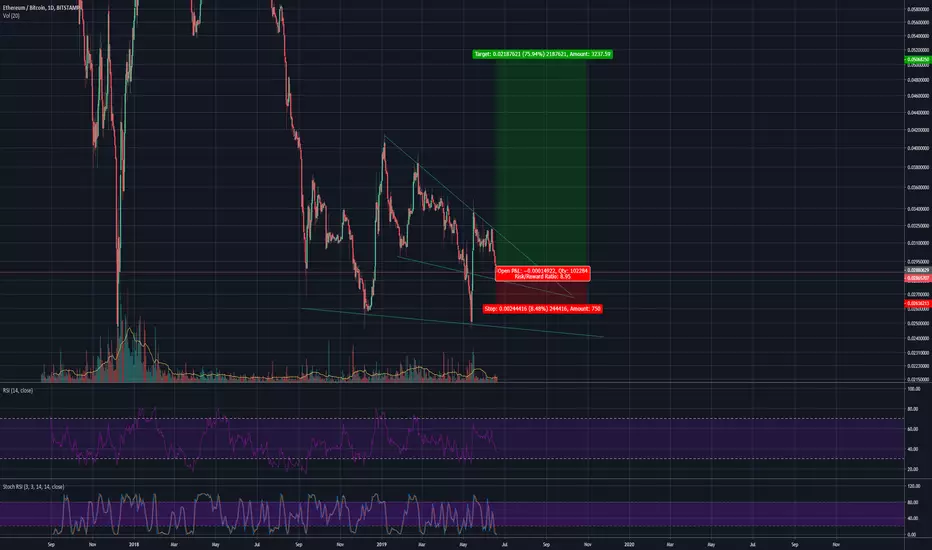
ETH/BTC day , bearish descending triangle ?i don't know if it's correct ! but many thinks telling me it's falling donwn

ICX should go up soon?I'd say so by the look of that falling wedge, right?
This could be the kind of pattern that drags on for a while, nullifying both lines over and over until it finally completes and breaks out, but it also can start going up real soon, as we are reaching the apex of this current pattern.. It probably depends on the entire alt market- if BTC turns over and starts correcting soon I would think it more than likely for ICX (and many other altcoins) to break out of this bullish pattern for some upside bull action for a while, and ICX specifically looks like it will probably give good returns from the current price, at probably around at least 2x (100%) or 3x (200%) of its bitcoin value by the end of its short term run.


GbpUsd retest broken falling wedgeNeed to break the current resistance area to confirm the falling wedge pattern

Potential Falling Wedge Pattern on EURJPYExpect a falling wedge pattern on EURJPY, possible short and long upon confirmation of reversal.

Falling Wdge on XRPUSDTthere is a rising wedge on the chart of BTCUSDT on binance. i used short term price action to simplify the trade (green and red lines) and lower the risk. just trade the breakout of rising wedge by putting a stop-buy order and then place a stop-sell at the stoploss level. if it plays out you will be rewarded 11% if it does not, you will loss less than 3%. definitely worth to try. wait for future updates

NEO \ BTC falling wedge in a downtrend? maybe...NEO\ BTC
Analyzing NEO BTC (bitance) chatd we see a very very long downtrend from April (0.009 BTC) to August 2018 ( 0.0024 BTC)
On september NEO broke downtrend and has entered in a falling wedge triangle where now we are in.
Falling wedge in a downtrend is a bullish signal so we expected IF NEO dont broke lower support a testing in area 0.003100 BTC
IF NEO broke down support.. well... there's no other support... free fall to hell.
MY PERSONAL TRADE (it's only my personal trade not a suggestion!!)
ORDER LIMIT:
BUY ORDER if price reach 0.001635 SAT (now 0.001623 sat) i'll lower this entry point every 5 sat (0.001630 when reach 0.001618 and so on)
please fell free to comment below.
Thank's.
F.E.

falling wedge for silverwe can notice a falling wedge pattern in daily with lower volumes as books say in order to identify a valid pattern; strong momentum divergence in daily.
if we look at lower timeframes in m30 there is a possible double bottom so my advice is to wait breakout of 14.46 with high volumes and buy there;
if you want to be updated on all my signals join my free telegram group
t.me/forexpro15
thank you bye bye

Is this the bottom for Celer???For the first time since it's ico, BINANCE:CELRBTC seems to might finally found its bottom.
we can see that the Parabolic SAR turned to long and supports the consolidation of the price, The MACD is holding long and slowly going up for a couple of days and also the RSI seems to be slowly rising as well
I'd keep a close eye on this one and enter once we close the daily above the falling wegde
could turn out as a great trade

Price finally hits breakout target from march's falling wedge!What an incredible bull run it's been thusfar these last three months for btcusd. Of course we've been expecting an eventual climb to at least $7229 since february and looking back over my previous charts you can see we've been charting the falling wedge breakout target since march 11th and the wedge itself as early as mid february. Not only did we finally hit the breakout target of this white falling wedge we went slightly farther and hit the blue horizontal support line that we have had set up for almost as long just above the wedge target at $7427. It always amazes me when crazy pumps like this happen to find their moment of retracement at trendlines that I've charted long before the price breakout had even began and this time is no exception. You can see this blue line in my previous weekly chart idea as well. Normally in a circumstance such as this I would have set up a limit sell right at that trendline with a stop loss a few pips above the trendline but this time because we are in the midst of a parabolic uptrend I will likely just hodl and buy dips to be safe until I see the weekly stoch rsi break under the support trendline that's been propping up momentum this entire bull run. until I see that break im playing it safe because I actually tried to catch a quick dip around 5.8 that never came and had to scramble back in and I refuse to repeat that I will be relying instead on my lower low/lower high and buy/sell line strategies to decide when to sell and until i get those signals I will only hodl and buy dips...however the greed fear index right now is on extreme greed which is always a bearish sign, plenty of bearish divergence on multiple indicators, retracing a bit right here at the horizontal blue trend line we have just reached would create the perfect possibility for a monthly cup and handle pattern to form its handle, and we're gonna have to break under the weekly stochrsi's support trendline in the not so distant future. A correction is well overdue but in a parabolic run like this all bets are off especially when so many new institutional investors are aware the bull market has just arrived again. so my strategy until I get the right bearish signals will be hodling and dip buying. We should know in the next couple days or so if we have more room to continue up or correct, but for now I leave this idea neutral.

BTC price close to reaching falling wedge target from March 11thAmazing to see the price action this close to reaching the projected breakout target from the bullish breakout of the falling wedge that we had recorded al the way back on march 11th. I was confident we would come close to hitting this projected target but honestly thought we'd see at least one retracement before we got as close as we are now. We can see we just hit the breakout target from the weekly bullflag we had just broken up from at 6888 whether or not we will continue up from here without a retracement is uncertain but shorts are still surprisingly high so we may have another leg up potentially which would allow us to reach the big white falling wedge's full target. We must remember however that falling wedges are one of those shapes that doesnt reach its full target as often as some of the other chart patterns so to even get this close is impressive and to do so before any corrections is even more impressive. I had originally called for a breakout from this wedge around february 18th but had predicted the breakout would occur slightly before march 11th so originally had the breakout target at around 7.6k but once the breakout was fully confirmed a few days later we honed the target to around 7229 so there is a chance we can still continue up from here. FOMO can easily fuel us a little more until longs start to pick up more steam in which case the momentum will start to shift the other way. Exciting times in btc and no doubt a clear sign we have reentered the bull market. Because of that this idea will be listed as long even if we do finally have a correction soon the not so distant future(next 3 years)should be quite bullish.
