BTC may bounce hard here, before even touching $3000Whats coin on guys?
Ill just leave this fractal here. Already failing at the end, but it could be a bear trap.
Falling

ETHEREUM looks bad#ETH
Ethereum looks bad, all the important supports were easily punctured, and now we can continue to go lower with the rest of the markets. The closest support range formed within $ 73-78, fixation below which will be a very bad signal. The nearest resistance is $ 100, its breakdown will give strength for a step up, but it will be extremely difficult to rise above $ 140, even after breaking through $ 140 there is a high probability that it will fall again.

I anticipate a break up from the current bitcoin falling wedgetemporary long as I don't believe we have reached the bottom of the bear market yet...we may see price action go back down to the support of the falling wedge's bottom trendline one more time and maybe even a breakdown fakeout wick a pip or 2 below it but ultimately I think like most falling wedges probability favors a break upward within the next few day candles most likely after the stochrsi gets near the bottom again. Once we hit the 4.4k breakout target we may immediately fall right back down though and finally find our capitulation candle afterwards.


Cardano (ADA) - Critical Price point | Falling WedgeCardano (ADA) is mimicking BTC moves.
A falling Wedge is forming on daily chart and currently the price is sitting right on support.
Stoch RSI Approaching oversold zone + bullish Divergence can be seen.
RSI in Oversold Region. A Bounce from this area is very important or else we will see 600-700 zone as a bottom.

BTCUSD - Falling wedge and Hidden Bullish DivergenceEntry: 3703
Target: 3937
Stop: 3624
RR: 2.8:1
Cross Leverage: 0.3x

Falling Wedge BreakoutPotential here for a falling wedge break out.
Look out for:
1) Bottom trendline breaks, but buy the yearly low (Huge daily wick)
2) Buy the bottom trendline of the wedge (Aggressive)
3) Buy the breakout of the top of the wedge (Breakout trade)
4) Buy the pullback after breakout (Bull flag)

We are in a falling wedge and we might see breakout to target!We are in a falling wedge and breaking up is the likely scenario in falling wedge ! , Lets watch this lines and try to trade long of we brake up!

Bitcoin continuing to consoldiate inside small 1day fallingwedgeI anticipate it will break up from the wedge at just the right time to find resistance at the horizontal white trendline...then I expect it from there to begin its descent into final capitulation...although we may not see the final capitulation candle until february, I think we will see it by february at the latest. I anticipate we will meet resistance here and not continue to go up based mainly on the current 1 day stochrsi, an how closely this year has resembles 2014

Ethereum situationETHUSD There are to supports to be breach (mostly probably) before going to north again. The bottom would be around 80$ as it is set by previous bottoms (falling wedge).


bottom may b near + potential fllng wedge fakeout on 1 wk chartthere is a clear falling wedge pattern on the weekly bitcoin chart. We have now also clearly broken below it, however many falling wedges will have fakeout breakdowns just before 180ing and climbing back into the wedge just before its apex to break upwards....this can also still happen here...not saying it will but it's certainly something to consider...if it were to break above the falling wedge at or before the arbitrary location I have marked here on this chart then a confirmed breakout above it could take the price up to over 8k. Of course there is also a small percentage of falling wedges that fail and break downward and this could always be one of those but I thin if the bottom isn't already in, which it is likely not...it is very likely near and the bottom horizontal line I have on this chart is my presumption of what will be the bottom zone..of course its never wise to call the bottom it's best to rely more on higher high/higher low patterns for buying and lower low/lower high patterns for selling. Either way this continued bear market is still a great opportunity for accumulation so I have all the patience in the world for the bull market to arrive as its gonna be much harder to accumulate on the way up requiring buying more instead of as much accumulating more with the amount I already have by selling and putting it back in at the right times. So yes, I ahve all the patience in the world for the bullrun because I know it will becoming soon enough.

Falling wedge bounce play . Books are thick down to 4k (mex ) hopefully we get another dip to low 4's and another hold , i am long and adding with stops under 4k
Would love to see it play out and break above 4400 for the weekly close in 2 days
Targets are 5k then 5.4k
Stops under 4K

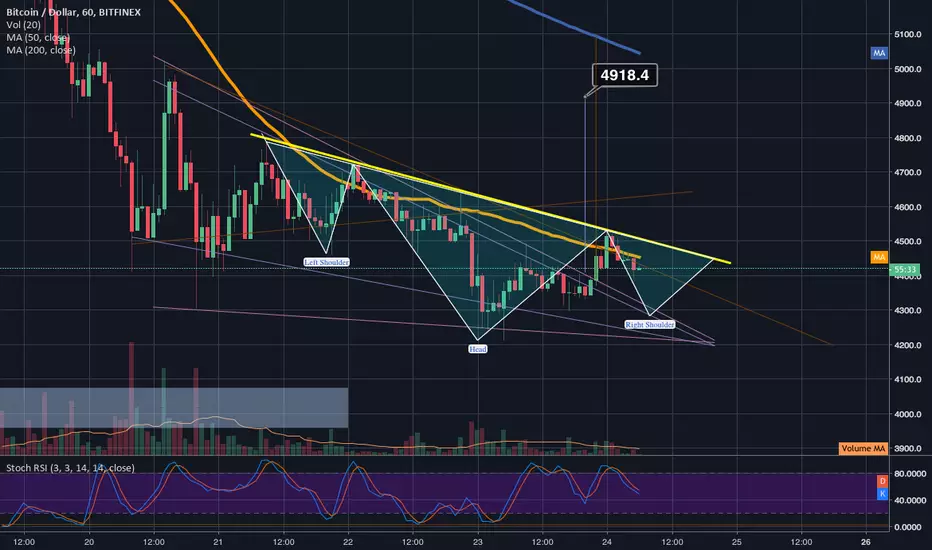
potential inverted h&shoulders overlaid on top of falling wedgeWe are now potentially forming an inverted head and shoulder pattern overlaid on top of the falling wedge which only will increase the odds of a bullish breakout for btc. In order for this inverted head and shoulders to have a chance it must have a bounce before too long and the most likely spot we have as a good bounce support is the top trendline of the falling wedge...if we see it stay above that line odds are good of validating both he breakout of the falling wedge and the inverted h&s pattern but until I see that, this idea will remain neutral for now....if I see it break under the falling wedge trendline I will lean more bearish and think this was nothing more than a dead cat fakeout bounce...but for now we will have to wait and see what it decides to do at the falling wedge top trendline. I may not sell again until it breaks under the bottom trendline of the falling wedge though. The inverted head and shoulders can be seen on the 1hr,2hr,3hr, and 4hr charts. Thanks for reading this NON-financial advice from a NON-financial advisor like myself and good luck!
falling wedge or bearflag? dead cat or possible double bottominside what started out looking like a descending triangle bearflag we have developed a small falling wedge(bullish)on the 1hr chart...shown here is the 4hr chart. The initial 4 hour descending triangle we have already broken below but the whales seem to be holding things above 4k thus no breakdown was triggered casting much doubt on tis being a descending triangle....this could lead to a potential double bottom with 4050 and 4090 however it could still end up breaking below for now it slightly favors the upside temporarily but since that probability is only slight..this idea will remain neutral...this is more or less a no trade zone until it chooses a clear path.

quick long positionaccording to money managment rules i put stop loss 3 percent lower than entry point. we breakout with volume. buy when price touched back upper trend line.

A look at the XRPUSD pair almost at golden cross!Normally my xrp charts are looking at the XRPBTC pair...but with more and more exchanges now enabling the XRPUSD fiat pair I think it's important to factor that in as well. We are currently right around 49 cents but will likely be heading upward soon...you can see the price action has been consolidating in a falling wedge which most of the times break upwards...you can also see here that if we were to break up from the falling wedge at this point where we are now testing its top trendline...the breakout target price would conveniently be right at the neckline of the inverted head and shoulders pattern now forming on the chart as well..We seemed destined to trigger the inv head and shoulder pattern on the xrpbtc pair so I think the xrpusd pair will inevitably trigger its inverted head and shoulder in the near future as well. So I think probability favors XRP breaking bullishly upward from this falling wedge fairly soon as well as a golden cross happening as soon as the next day candle to 3 days from now. Overall very bullish looking indeed.

Falling wedge massive breakout imminentYou can see here the wedge falling, We can breakthrough the line to 6420

Halving 1: 9940% Return, Halving 2: 3247%, Halving 3: 1060% ???Bitcoin has experienced 2 halving events since its inception in 2008, the first on 28 November 2012 and the most recent halving event on 9 July 2016, whereby mining rewards are reduced by 50%. Each one of these events has been preceded with a strong uptrend in the months leading up to the event and each of these events experienced a significant rally for the subsequent 12 - 18 months from the halving date. Bitcoin's next halving date will take place roughly 20 May 2020 and, like the previous 2 events, I am expecting an uptrend in the months running up to the event as well as in the months thereafter.
To see how these events compare to the upcoming event 18 months from now, we can look at the duration and returns between each halving event date and its next ATH. As per my previous longer term post, I believe Bitcoin should move within either the orange channel or the yellow channel over the longer term. In the short to mid term, we should find out which of these channels it's going to be as the market patiently awaits a decision by the SEC regarding the Van Eck Solid X Bitcoin ETF application which has been ongoing for quite a few months now.
29 December 2018 is decision day for the Van Eck ETF but the SEC may defer the decision one last time to 29 February 2019, in which case I expect the price to fall below the larger uptrend support for a retest of the 2018 annual lows. If the Van Eck ETF does get approved on 29 December 2018, this may be the catalyst for the bull run starting in Q1 2019.
If the ETF decision is deferred on 29 December, I expect a downtrend in January with a potential break of the yearly lows to test the $4800 support (0.236 fib) and the bull market may then only potentially begin in Q2 if there is ETF approval on 29 February 2019, in which case there should be a move back above the prior uptrend support (current resistance) and back inside the yellow channel. In case of ETF approval on 29 February 2019, I expect a strong uptrend back into the yellow channel and a continuation of the uptrend once BTCUSD is holding the channel support.
If the Van Eck ETF is rejected on 29 December 2018 or on 29 February 2019 then there may see a sharp drop to the $3000 support at the bottom of the orange channel where BTCUSD should consolidate and slowly rise in the months preceding the next halving event around 20 May 2020.
When the first gold ETF was launched in 2003, there was a 300% rise in the price of gold which was already an established asset class. A Bitcoin ETF along with the upcoming 2020 halving should be the catalyst we have all been waiting for and should drive the next bull run to McAfee price prediction levels.
Now let's look at the duration and returns of the prior events.
The first halving event:
Date:
28 November 2012
Duration from Halving Date to next ATH:
364 Days (1 year)
Return from Halving Date to next ATH:
9940%
Second Halving Event:
Date:
9 July 2016
Duration:
525 Days
Return from Halving Date to next ATH:
3247%
The second halving event's rate of return (from the halving date to the next ATH) works out to be just under 1/3 of that of the first halving event (3247% / 9940 X 100 = 32.665% of the first halving's rate of returns). If we apply the same principle so that the upcoming halving event achieves just under 1/3 of the second halving event's rate of return then there should be a 1060% return from the next halving date until its next ATH (32.665% of 3247% = 1060%).
Next Upcoming Halving Event:
Date:
+- 20 May 2020
Duration:
+-560 Days to +-581 Days
Return from Halving Date to next ATH:
1060%
Price Target:
If the Bitcoin downtrend continues and moves towards the bottom of the orange channel support first, then I suspect Bitcoin will have closed above the larger yellow uptrend and for price to be holding support at $8060 on the halving date. Based on a 1060% return, there should be a strong uptrend towards the bottom of the yellow channel for a target of $85430 over 560 days.
If Bitcoin moves back inside the yellow channel on news of an ETF approval, then I expect the price to have found support at and closed above $31766 (1.618 fib) by the halving date around 20 May 2020 and for a strong uptrend to continue from there for 580 days to the top of the orange channel resistance (price could even potentially move higher to the yellow channel resistance). Based on a 1060% return, the price target at the top orange channel resistance is expected to be $336720 .
I know these targets sound ridiculous but I remember thinking $5k was ridiculous back in 2013 when BTC was still $100.
Good luck and happy trading!
Previous chart:

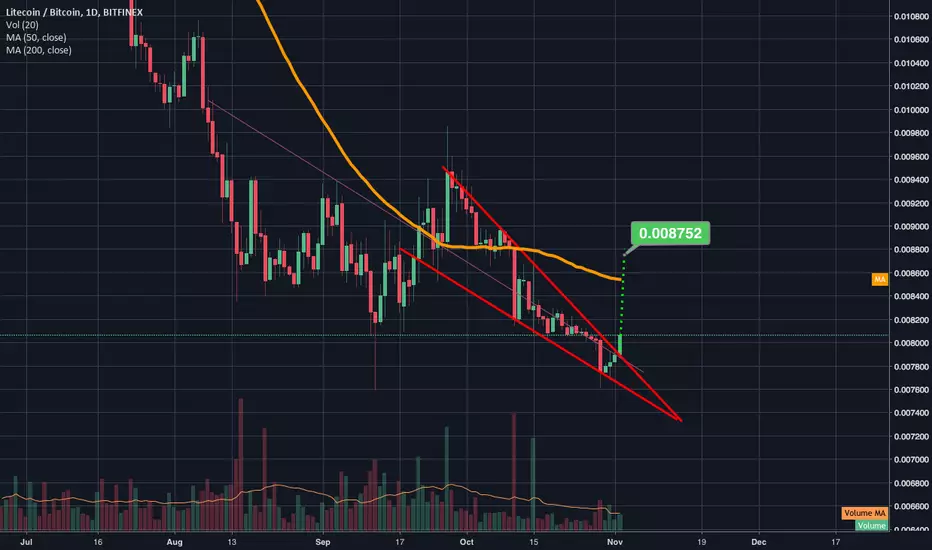
BTC reaches falling wedge breakout targetBTC finally breaks above the 50 ma(in orange) and hits the projected breakout target that we showed in a previous idea of this small falling wedge pattern precisely...would not surprise me if it consolidates a little here until stoch rsi is cooled down before the 50ma eventually lifting it further upward. So a very temporary neutral here while a more long term long.

Stellar achieves a gldncross! Rches brkout target of fllngwedgeFor those of us who were already holding some xlm the slight fomo above the breakout target that created the current candles bullwick would have been an excellent place to take some profit. Props to anyone who acted quick enough to take advantage of that. We can ee here though that much like XRP, Stellar has also triggered a golden cross on the 1 day chart and shortly thereafter has broken bullishly out of the falling wedge it was in. Now is a good profit taking zone because the target has been met , but for anyone thinking of adding stellar and the long term hodlers of stellar there is more bullish action to come after this current consolidation if probability wins out. The golden cross on the 1 day chart is an extremely bullish sign. I of course always wanna be prepared for the exact opposite outcome should this be a golden cross fakeout. If I was adding to my position here I would wait for an indication it will continue to break upward. If it starts to consolidate into a bull flag I would then wait for the clear break up of the bullflag to add to my position. for now I think I'm gonna trade my previous holdings into BAT and XRP since BAT has been listed on Coinbase and XRP has had a slight consolidation dip that to me is a smart buy zone considering it seems like it will sustain it's golden cross and the bullish news about r# and SBI. I will always try to retain a small foundational amount of stellar though as I believe it will likely serve as xrp's competition with xrp having the verizonesque dominance of the market and stellar being the more affordable less desirable alternative (TMobile).