SMCI - Bullish Wedge Flag patternBullish Wedge Flag pattern
The price broke out on last week and has retested today.
In the chart of the week frame, the price is on the MA200 line.
The price now (Closed on 04.30.2025): $31.86.
Price target: $48.18/ $63.05
IMO, amateur trader.
Falling Wedge

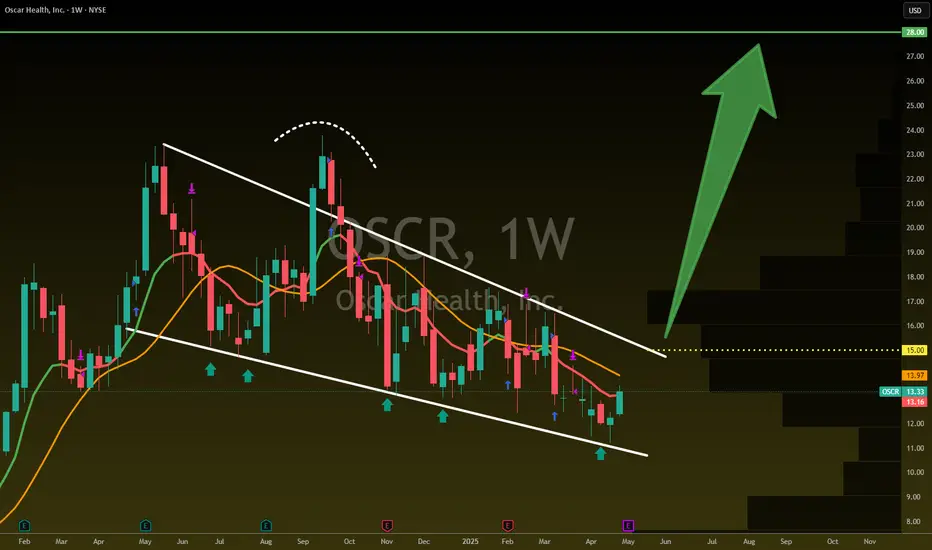
IT IS TIME $OSCRIT IS TIME NYSE:OSCR
Falling Wedge Approaching breakout!
Breakout = $28
Not financial advice
BITCOIN → Consolidation or reversal? Why is $ 95000 important?BINANCE:BTCUSD held up quite strongly during the tariff war and largely weathered the storm, while the stock market and indices were in free fall. The improvement in the fundamental situation has once again heightened interest in the asset among traders and investors.
Earlier, I pointed out that against the backdrop of falling markets (due to Trump's policies and tariff wars), Bitcoin is holding up fairly well. It cannot be compared to gold, which maintains its status as a safe haven, but overall it has stayed out of the 73K risk zone.
Countries are continuing negotiations in the US, which generally points to an improvement in the trade situation, but all attention remains on relations between China and the US, and a resolution may be close.
Technically, on the daily/weekly timeframe, the price has broken through the trend resistance and the asset has moved from the sell zone to the buy zone, which in general only increases interest in the flagship. Bitcoin is stuck in the 95K-92K range. A false breakout of resistance provokes a correction, and now we need to monitor the price and see where the correction will stop. This will show us important support that could become the basis for consolidation.
Resistance levels: 95K, 100K, 102.5K
Support levels: 93.5, 92.9, 92, 91K
To break through 95K and continue growing, Bitcoin must form consolidation. There is none at the moment, and a correction and halt may indicate the approximate boundaries of consolidation. However, the focus is on 95 - 93.5 - 92K. If the price manages to stay within the local boundaries and continues to storm the 95K resistance, we will have a chance for a breakthrough and continued growth to 100K. Otherwise, Bitcoin may form a deeper correction, for example to 91-88K
Best regards, R. Linda!

GOLD → False breakdown and change of mood...FX:XAUUSD is strengthening after a false breakdown of support at 3288, with the change in fundamental sentiment due to US statements on the tariff war also providing support for the price.
On Thursday, gold rose from a weekly low of $3,260, supported by a weaker dollar and renewed concerns about US trade negotiations with China and Japan.
Optimism about tariff cuts quickly faded after denials from the White House. Weak US business activity data is fueling talk of a possible Fed policy easing, which is also supporting gold. The markets remain focused on trade news and Trump's statements.
Technically, gold could reach the liquidity cluster at 3314 and continue to rise towards strong resistance at 3370.
Resistance levels: 3342, 3370, 3387
Support levels: 3314, 3288, 3270
Below 3314 and below 3288, a liquidity pool has formed, which the market is likely to test before continuing its growth. It is too early to talk about a resumption of a strong rally, as the situation between the US and China is complicated, as are the negotiations on the situation in Eastern Europe, which seem to be moving towards talks, but every time something goes wrong...
Best regards, R. Linda!

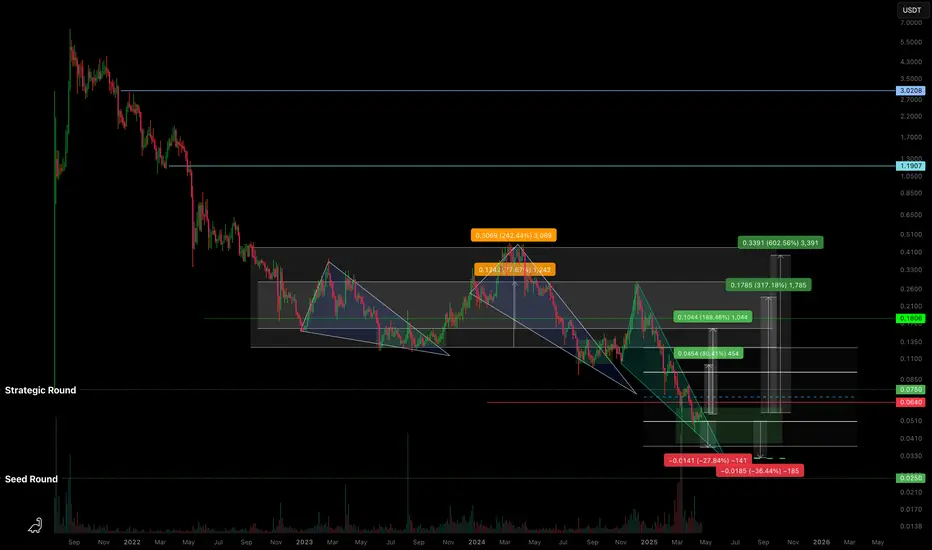
C98USDT — Descending Wedge & High R/R ZoneBased on the current structure, BINANCE:C98USDT is moving within a descending wedge , approaching zones that align with early investor positions.
🔍 What I’m seeing:
Potential drop into the range of a previous horizontal channel - marked on the chart.
We've already reached the Strategic Round level; below that is the Seed Round .
Assuming the project isn’t abandoned, it makes sense to expect investor defense in this zone.
From what I observe, there's likely accumulation happening from weak hands - at a discount .
🛡️ Approach:
As I’ve said before - you can’t treat coins like this in isolation .
They should be traded as part of a group of low-liquidity tokens , with proper risk management .
You can’t know in advance which one will “survive” without insider info from the team.
So the key is having a solid strategy and managing your portfolio and risk wisely .
📈 Targets:
Potential breakout targets from the wedge are marked on the chart.
If the market remains weak, I’ve noted a lower zone where consolidation might occur (sideways chop within a horizontal channel).
💭 Opinion:
The market is “paused” and waiting for a catalyst. You can’t rush it.
But zones like the current one on BINANCE:C98USDT seem attractive in terms of risk/reward .
The goal isn’t to guess - it’s to follow a pre-built strategy and stay focused .
📌 As always, this is not financial advice. Just my personal take and observations on the structure.
Real Success Rates of the Falling Wedge in TradingReal Success Rates of the Falling Wedge in Trading
The falling wedge is a chart pattern highly valued by traders for its potential for bullish reversals after a bearish or consolidation phase. Its effectiveness has been extensively studied and documented by various technical analysts and leading authors.
Key Statistics
Bullish Exit: In 82% of cases, the exit from the falling wedge is upward, making it one of the most reliable patterns for anticipating a positive reversal.
Price Target Achieved: The pattern's theoretical target (calculated by plotting the height of the wedge at the breakout point) is achieved in approximately 63% to 88% of cases, depending on the source, demonstrating a high success rate for profit-taking.
Trend Reversal: In 55% to 68% of cases, the falling wedge acts as a reversal pattern, signaling the end of a downtrend and the beginning of a new bullish phase.
Pullback: After the breakout, a pullback (return to the resistance line) occurs in approximately 53% to 56% of cases, which can provide a second entry opportunity but tends to reduce the pattern's overall performance.
False Breakouts: False exits represent between 10% and 27% of cases. However, a false bullish breakout only results in a true bearish breakout in 3% of cases, making the bullish signal particularly robust.
Performance and Context
Bull Market: The pattern performs particularly well when it appears during a corrective phase of an uptrend, with a profit target reached in 70% of cases within three months.
Gain Potential: The maximum gain potential can reach 32% in half of cases during a bullish breakout, according to statistical studies on equity markets.
Formation Time: The wider the wedge and the steeper the trend lines, the faster and more violent the post-breakout upward movement will be.
Comparative Summary of Success Rates:
Criteria Rate Observed Frequency
Bullish Exit 82%
Price Target Achieved 63% to 88%
Reversal Pattern 55% to 68%
Pullback After Breakout 53% to 56%
False Breakouts (False Exits) 10% to 27%
Bullish False Breakouts Leading to a Downside 3%
Points of Attention
The falling wedge is a rare and difficult pattern to correctly identify, requiring at least five contact points to be valid.
Performance is best when the breakout occurs around 60% of the pattern's length and when volume increases at the time of the breakout.
Pullbacks, although frequent, tend to weaken the initial bullish momentum.
Conclusion
The falling wedge has a remarkable success rate, with more than 8 out of 10 cases resulting in a bullish exit and a price target being reached in the majority of cases. However, it remains essential to validate the pattern with other technical signals (volume, momentum) and to remain vigilant against false breakouts, even if their rate is relatively low. When mastered, this pattern proves to be a valuable tool for traders looking for optimized entry points on bullish reversals.

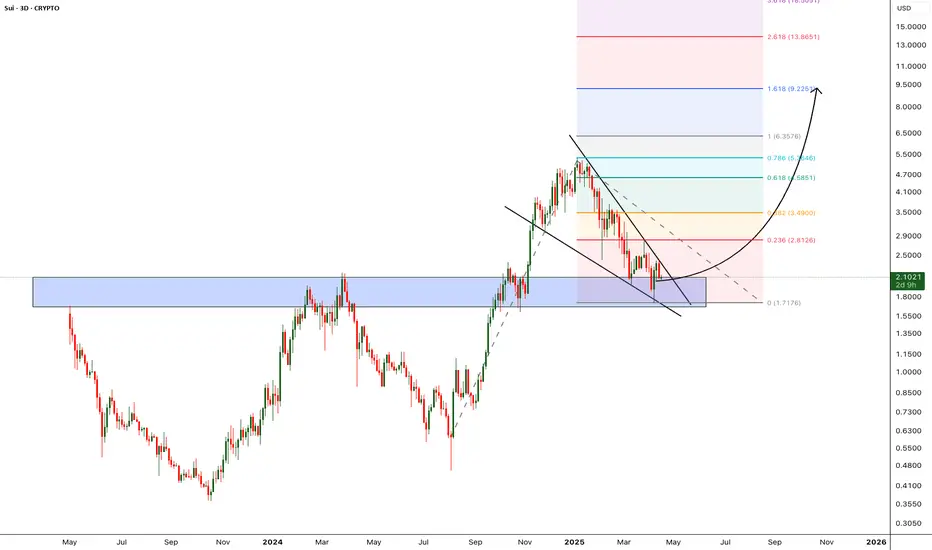
SUI - Double Digit is next - Alt season LeaderCorrection of the SUI is over, currently trading around the previous Support zone. i'm expecting this support to hold and bounce back from the support zone.
Once the price breaks from the falling wedge pattern we can expect the bullish momentum to start and hit new all time high.
Entry: after wedge breakout
Target 1: 2.8
Target 2: 3.49
Target 3: 4.5
Target 4: 5.3
Target 5: 6.3
Target 6: 9.2
SL below 1.68
Cheers
GreenCrypto
BITCOIN → Retest 86190. There are chances for growthBINANCE:BTCUSD is starting to show positive signs, but it is too early to talk about a change in the downtrend or a bullish rally. Strong resistance ahead....
Against the background of everything that is happening, from a fundamental point of view, bitcoin in general has withstood the blows quite well and is gradually beginning to recover, but the situation for the crypto community as a whole has not changed in any way, the promises are not yet fulfilled. Bitcoin's strengthening is most likely due to localized growth in indices and discussion of lower interest rates. But the focus is on the tariff war between China and the US, improved relations and lower tariffs could weaken bitcoin.
Technically, we see that the price is moving beyond the resistance of the descending channel. For a few days now, the price has been consolidating in front of the 86190 level, and we have chances to see a rise to the resistance of the 88800 range, from which the future prospects will already depend.
Resistance levels: 86190, 88800, 91280
Support levels: 83170, 78170
The price is slowly approaching the resistance 86190, consolidating without updating the local lows, forming a pre-breakout consolidation. There is a probability of a breakout attempt. Breakout and consolidation of the price above 86190 may give a chance to rise to 88800.
But, regarding 88800 we will have to watch the price reaction. A sharp approach with the purpose of primary testing of the level may end in a false breakout and correction....
Regards, R. Linda!

GOLD → Recovery after the FB of 0.5 fibo. What's next?FX:XAUUSD on Thursday tests 0.5 fibo, which I outlined to you on April 17, forms a false breakdown and recovers amid unstable geopolitical relations in the world. Price may continue its northward run.
The dollar continues to fall. The fundamental background depends on the relationship between the US and China as well as economic data especially after Powell's speech. The weekly session closes close to support, the decline may continue.
Gold after the shakeout is heading back north. Based on the fundamental background, the price may continue to rise. There are three days of downtime ahead as traders rest.
Fundamentally, anything can happen over the weekend, however, technically, the emphasis is on intermediate levels. The trend is still strong and bullish
Resistance levels: 3332, 3344, 3357
Support levels: 3313, 3288, 3284
If nothing supernatural happens over the weekend, gold in the Asian session may bounce off the nearest resistance and test trend support before continuing the uptrend. If there are any critical changes in the mood of countries/politicians then I will update the situation
Regards R. Linda!

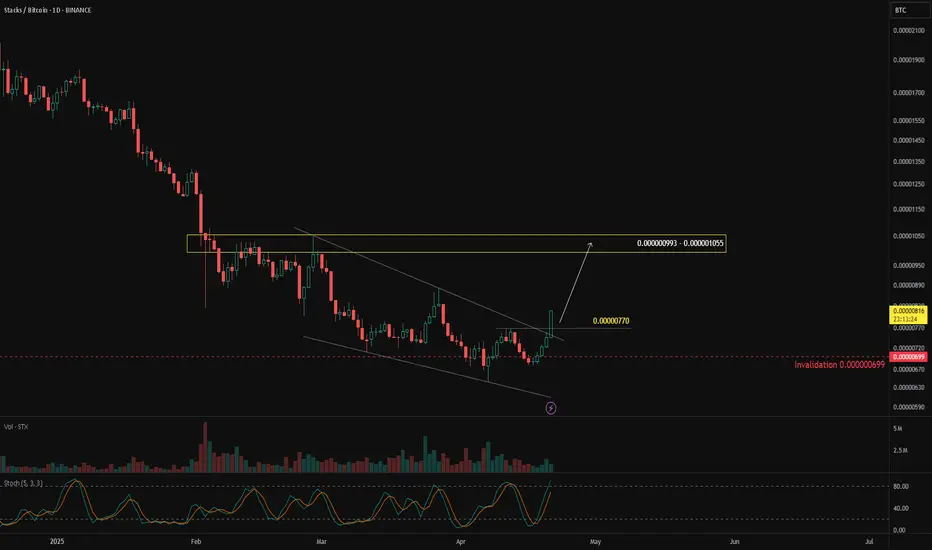
Will STX Outperform Bitcoin?In the crypto market, if you want to beat the market, your benchmark is $CRYPTO:BTCUSD. That means to outperform the crypto market, you need to outperform Bitcoin.
One way to measure this is by watching crypto/BTC pairs, such as $BINANCE:STXBTC. If $BINANCE:STXBTCgoes up, it means STX is stronger than BTC. If it goes down, BTC is stronger than STX.
On the daily chart, BINANCE:STXBTC has been moving downward, but over the past month, sellers seem to be losing momentum—indicated by a falling wedge reversal pattern.
A bullish breakout above 0.000000770 would confirm the pattern, with a potential upside target at 0.000000993 – 0.000001055. This scenario remains valid as long as price holds above 0.000000699.
LOFI Surge Nearly 200% Today Breaking Out of A Falling Wedge The price of Lofi saw an uptick of almost 200% despite albeit the crypto market was consolidating, breaking out of a falling wedge pattern.
$LOFI, a memecoin created on the Sui ecosystem has been on a prolong falling wedge pattern that led to the token losing about 93% of market value. However, in a turn of events today, $LOFI surge nearly 200% today going against market odds.
As of the time of writing, $LOFI is up 55% for the past 24 hours with momentum brewing as hinted by the RSI at 88. The relative strength index shows $LOFI is oversold, meaning we might experience a slide cool off before another leg-up.
About Lofi
LOFI leverages the Sui blockchain to build a thriving ecosystem focused on content, community, and collaboration. Committed to environmental and social causes, $LOFI merges blockchain technology with real-world impact, aiming to clean Earth’s water sources and reduce ocean plastic while fostering a decentralized economy.
LOFI Price Data
The LOFI price today is $0.024751 USD with a 24-hour trading volume of $4,981,833 USD. LOFI is up 53.48% in the last 24 hours. The current CoinMarketCap ranking is #696, with a market cap of $24,750,635 USD. It has a circulating supply of 1,000,000,000 LOFI coins and a max. supply of 1,000,000,000 LOFI coins.

#PARTIUSDT is showing signs of a reversal🚀 The price BYBIT:PARTIUSDT.P is showing signs of a reversal after a prolonged downtrend.
🚀 The scenario becomes more likely if the price holds above $0.1520 with increasing volume.
🚀 Watch for a breakout and confirmation above the $0.1500–$0.1520 zone — this would strengthen the bullish setup.
🚀 If volume picks up during the continuation of the move, a quick push toward $0.18 is possible.
📈 LONG BYBIT:PARTIUSDT.P from $0.1533
🛡 Stop loss: $0.1492
🕒 Timeframe: 1H
✅ Overview:
➡️ The price has broken out above the Bearish Flag, confirming a break in the downtrend structure.
➡️ The Double Bottom formation increases the likelihood of an upward move.
➡️ Entry at $0.1533 is just above the resistance zone and confirms the breakout.
➡️ The upward potential remains toward $0.1600 and beyond, aiming for the POC volume area.
🎯 TP Targets:
💎 TP 1: $0.1555
💎 TP 2: $0.1575
💎 TP 3: $0.1600
📢 Support zone: $0.1500–$0.1510 — must hold to maintain the bullish structure.
📢 If price consolidates above $0.1555, expect a potential acceleration toward $0.1600.
📢 A drop below $0.1492 invalidates the scenario — stop is mandatory.
🚀 BYBIT:PARTIUSDT.P breaks key level — bullish signal confirmed! Watch for continuation!

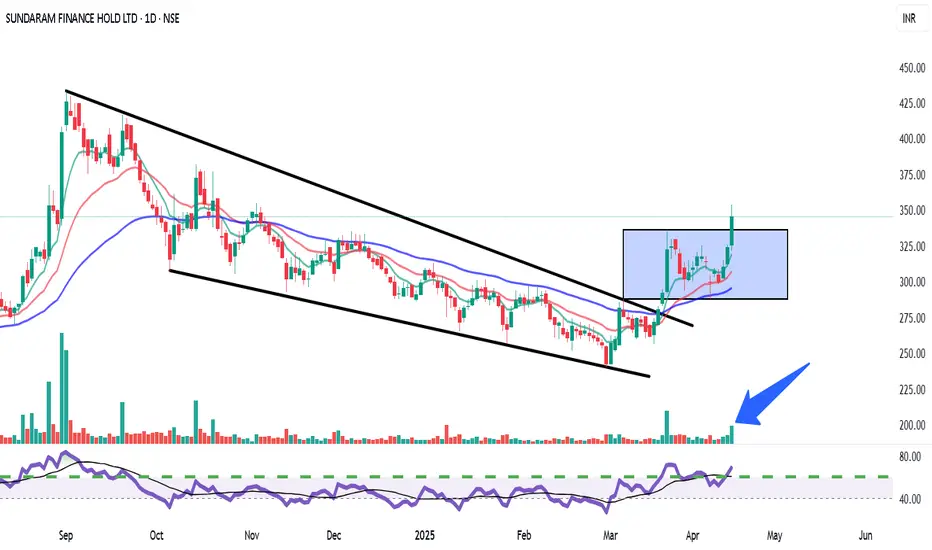
Sundaram Finance | Falling Wedge Breakout with Strong Volume Pattern: Falling Wedge breakout followed by consolidation (bullish continuation).
Breakout Confirmation: Clean breakout from both the wedge and the consolidation box with strong volume.
Indicators:
Volume: Spike visible (🔵 arrow) – confirming strength.
RSI: Crossed above 60 – entering bullish momentum territory.
EMAs: Price trading above all major EMAs – trend supportive.
Buy Recommendation:
Entry Range: ₹340–₹350
(Post-breakout retest may offer ideal entries if available)
🎯 Target Levels:
Short-Term Target: ₹375
Mid-Term Target: ₹410–₹425
(Based on previous swing highs and wedge height projection)
🛑 Stop Loss:
SL Level: ₹320 (below the consolidation box low)
for educational purposes only
Hey Look! Sellers are Getting Weaker You may notice that the recent price declines are becoming smaller (marked by the grey arrows). The red candlesticks are shrinking, indicating that selling pressure is weakening while buyers are gradually stepping into the market.
As sellers lose momentum, we can expect the support area between 2.779 – 2.713 to hold and potentially trigger a price bounce. For now, we wait for the price to reach this zone and look for a clear confirmation signal before entering.
From a chart pattern perspective, a falling wedge reversal is forming — a pattern often associated with bullish reversals. The 2.779 – 2.713 support area aligns with this pattern and can be considered a potential buy zone, provided we get proper confirmation.

BITCOIN → Testing trend resistance. Will there be a breakout?BINANCE:BTCUSDT is approaching trend resistance and most likely it may test the liquidity zone and risk zone for sellers (liquidity hunt ?), but does the market have the potential to support the upside?
Bitcoin is strengthening and channel resistance may not stop this growth. Based on the nature of price movement (smooth, gradual, consolidating), bitcoin may test liquidity 84.7K - 88.8K. But it is too early to talk about further growth
On W1, the price is in a trading range (consolidation) between the previously broken global consolidation support and the current support. Short bodies, long shadows speak about consolidation. Also worth noting are the relatively long tails to the downside and the weak market reaction...
Fundamentally, the cryptocurrency market (community as a whole) for the past week did not get anything positive as from the very beginning of this year, the growth can be attributed to the 90-day technical break by Trump, but there are a number of nuances:
- the fire has not yet been put out
- just because they gave a 90-day break doesn't mean everything is fine. It's just a head start for the U.S. to prepare for the situation more thoroughly
- The escalating conflict between the U.S. and China has investors looking for less risky assets like gold. Cryptocurrencies are definitely not on that list.
- Rumors of a US interest rate cut are likely to provide support as well.
Resistance levels: 84700, 88800
Support levels: 78200, 73-74К, 66500
I would not hurry with conclusions about further growth. Growth could be considered if bitcoin overcomes 88800 and consolidates above this zone. But a sharp approach or a false breakout of one of the mentioned liquidity zones may provoke a reversal and fall.
Regards R. Linda!

DOGE → Will the market hold strength or lose it all?BINANCE:DOGEUSDT is testing the liquidity and resistance zone amid a downtrend as part of a news-induced rally. Will the market hold this trend or return to a sell-off?
The downtrend continues. As part of the correction triggered by the news backdrop, bitcoin strengthened and pulled the altcoins with it. But the market may lose all its growth quite quickly, as bearish pressure on the market is still very strong (There are no fundamental positive changes for the market). The fall of BTC may be followed by DOGE as well.
Technically, the price is forming a false break of the resistance zone 0.1622 - 0.15700, consolidation of the price below this zone will provoke the continuation of the fall to the nearest zone of interest 0.13646.
Resistance levels: 0.157, -0.1622
Support levels: 0.13646, 0.1277, 0.1154
A retest of the trend resistance is possible, but price consolidation below the key zone will be a good signal indicating the seller's strength, the decline may continue. On the weekly timeframe we have a trigger at 0.14217, break of which will open the way to 0.1277 - 0.1025.
Regards R. Linda!

RSR/USDT: FALLING WEDGE BREAKOUT! 100%+ PROFIT POTENTIAL!!🚀 Hey Traders! RSR Breakout Alert – 100%+ Rally Incoming? 👀🔥
If you’re hyped for big moves and real alpha, smash that 👍 and hit Follow for high-accuracy trade setups that actually deliver! 💹🚀
RSR has just broken out of a falling wedge structure on the daily timeframe—a powerful bullish pattern. The chart’s signaling a potential 100–150% upside move if momentum picks up from here. 📈
📍 Entry Zone: CMP – Add more on dips down to $0.0066
🎯 Target: 100%–150% upside
🛑 Stop-Loss: $0.0054
📊 Trade Plan:
✅ Buy from current levels
✅ Add on dips near breakout support
✅ Ride the breakout wave with tight risk control!
💬 What’s Your Take?
Are you riding this RSR breakout or waiting on confirmation? Drop your thoughts and targets in the comments—let’s ride this wave together! 💰🔥

Falling Wedge Trading Pattern: Unique Features and Trading RulesFalling Wedge Trading Pattern: Unique Features and Trading Rules
Various chart patterns give an indication of possible market direction. A falling wedge is one such formation that indicates a possible bullish reversal. This FXOpen article will help you understand whether the falling wedge pattern is bullish or bearish, what its formation signifies about the market direction, and how it can be used to spot trading opportunities.
What Is a Falling Wedge Pattern?
Also known as the descending wedge, the falling wedge technical analysis chart pattern is a bullish formation that typically occurs in the downtrend and signals a trend reversal. It forms when an asset's price drops, but the range of price movements starts to get narrower. As the formation contracts towards the end, the buyers completely absorb the selling pressure and consolidate their energy before beginning to push the market higher. A falling wedge pattern means the end of a market correction and an upside reversal.
How Can You Spot a Falling Wedge on a Price Chart?
This pattern is usually spotted in a downtrend, which would indicate a possible bullish reversal. However, it may appear in an uptrend and signal a trend continuation after a market correction. Either way, the falling wedge provides bullish signals. The descending formation generally has the following features.
- Price Action. The price trades lower, forming lower highs and lower lows.
- Trendlines. Traders draw two trendlines. One connects the lower highs, and the other connects the lower lows. Finally, they intersect towards a convergence point. Each line should connect at least two points. However, the greater the number, the higher the chance of the market reversal.
- Contraction. The contraction in the price range signals decreasing volatility in the market. As the formation matures, new lows contract as the selling pressure decreases. Thus, the lower trendline acts as support, and the price consolidating within the narrowing range creates a coiled spring effect, finally leading to a sharp move on the upside. The price breaks through the upper trendline resistance, indicating that sellers are losing control and buyers are gaining momentum, resulting in an upward move.
- Volume. The trading volume ideally decreases as the pattern forms, and the buying volume increases with the breakout above the upper trendline, reflecting a shift in momentum towards the buyers.
Falling and Rising Wedge: Differences
There are two types of wedge formation – rising (ascending) and falling (descending).
An ascending wedge occurs when the highs and lows rise, while a descending wedge pattern has lower highs and lows. In an ascending formation, the slope of the lows is steeper and converges with the upper trendline at some point, while in a descending formation, the slope of the highs is steeper and converges with the support trendline at some point.
Usually, a rising wedge indicates that sellers are taking control, resulting in a downside breakdown. Conversely, a descending wedge pattern indicates that buyers are gaining momentum after consolidation, generally resulting in an upside breakout.
The Falling Wedge: Trading Rules
Trading the falling wedge involves waiting for the price to break above the upper line, typically considered a bullish reversal. The pattern’s conformity increases when it is combined with other technical indicators.
- Entry
According to theory, the ideal entry point is after the price has broken above the wedge’s upper boundary, indicating a potential upside reversal. Furthermore, this descending wedge breakout should be accompanied by an increase in trading volume to confirm the validity of the signal.
The price may retest the resistance level before continuing its upward movement, providing another opportunity to enter a long position. However, the entry point should be based on the traders' risk management plan and trading strategy.
- Take Profit
It is essential to determine an appropriate target level. Traders typically set a profit target by measuring the height of the widest part of the formation and adding it to the breakout point. Another approach some traders use is to look for significant resistance levels above the breakout point, such as previous swing highs.
- Stop Loss
Traders typically place their stop-loss orders just below the lower boundary of the wedge. Also, the stop-loss level can be based on technical or psychological support levels, such as previous swing lows. In addition, the stop-loss level should be set according to the trader's risk tolerance and overall trading strategy.
Trading Example
In the chart above, there is a falling wedge. A trader opened a buy position on the close of the breakout candlestick. A stop loss was placed below the wedge’s lower boundary, while the take-profit target was equal to the pattern’s widest part.
Falling Wedge and Other Patterns
Here are chart patterns that can be confused with a falling wedge.
Falling Wedge vs Bullish Flag
These are two distinct chart formations used to identify potential buying opportunities in the market, but there are some differences between the two.
A descending wedge is a bullish setup, forming in a downtrend. It is characterised by two converging trendlines that slope downward, signalling decreasing selling pressure. A breakout above the upper trendline suggests a bullish move.
A bullish flag appears after a strong upward movement and forms a rectangular shape with parallel trendlines that slope slightly downward or move sideways. This formation represents a brief consolidation before the market resumes its upward trajectory.
While the falling wedge indicates a potential shift in a downtrend, the bullish flag suggests a continuation of an uptrend.
Falling Wedge vs Bearish Pennant
The falling wedge features two converging trendlines that slope downward, indicating decreasing selling pressure and often signalling a bullish reversal when the price breaks above the upper trendline.
Conversely, the bearish pennant forms after a significant downward movement and is characterised by converging trendlines that create a small symmetrical triangle. This pattern represents a consolidation phase before the market continues its downward trend upon breaking below the lower trendline.
While the falling wedge suggests a potential bullish move, the bearish pennant indicates a continuation of the bearish trend.
Falling Wedge vs Descending Triangle
The falling wedge consists of two downward-sloping converging trendlines, indicating decreasing selling pressure and often signalling a bullish reversal when the price breaks above the upper trendline. In contrast, the descending triangle features a flat lower trendline and a downward-sloping upper trendline, suggesting a buildup of selling pressure and typically signalling a bearish continuation when the price breaks below the flat lower trendline.
While the falling wedge is associated with a potential bullish move, the descending triangle generally indicates a bearish trend.
Falling Wedge: Advantages and Limitations
Like any technical pattern, the falling wedge has both limitations and advantages.
Advantages
- High Probability of a Reversal. The falling wedge is often seen as a strong, bullish signal, especially when it occurs after a downtrend. It suggests that selling pressure is subsiding, and a reversal to the upside may be imminent.
- Clear Entry and Exit Points. The pattern provides clear points for entering and exiting trades. Traders often enter when the price breaks out above the upper trendline and set stop-loss orders below a recent low within the formation.
- Versatility. The wedge can be used in various market conditions. It is effective in both continuation and reversal scenarios, though it is more commonly associated with bullish reversals.
- Widely Recognised. Since the falling wedge is a well-known formation, it is often self-fulfilling to some extent, as many traders recognise and act on it, further driving the market.
Limitations
- False Breakouts. Like many chart patterns, the falling wedge is prone to false breakouts. Prices may briefly move above the resistance line but then fall back below, trapping traders.
- Dependence on Market Context. The effectiveness of the falling wedge can vary depending on broader market conditions. In a strong downtrend, it might fail to result in a significant reversal.
- Requires Confirmation. The wedge should be confirmed with other technical indicators or analysis tools, such as volumes or moving averages, to increase the likelihood of an effective trade. Relying solely on the falling wedge can be risky.
- Limited Use in Low-Volatility Markets. In markets with low volatility, the falling wedge may not be as reliable, as price movements might not be strong enough to confirm the falling wedge's breakout.
The Bottom Line
The falling wedge is a powerful chart pattern that can offer valuable insights into potential trend reversals or continuations, depending on its context within the broader market. By understanding and effectively utilising the falling wedge in your strategy, you can enhance your ability to identify many trading opportunities. As with all trading tools, combining it with a comprehensive trading plan and proper risk management is crucial.
FAQ
Is a Falling Wedge Bullish?
Yes, the falling wedge is a bullish continuation pattern in an uptrend, and it acts as a bullish reversal formation in a bearish market.
What Does a Falling Wedge Pattern Indicate?
It indicates that the buyers are absorbing the selling pressure, which is reflected in the narrower price range and finally results in an upside breakout.
What Is the Falling Wedge Pattern Rule?
The falling wedge is a technical analysis formation that occurs when the price forms lower highs and lower lows within converging trendlines, sloping downward. Its rule is that a breakout above the upper trendline signals a potential reversal to the upside, often indicating the end of a downtrend or the continuation of a strong uptrend.
How to Trade Descending Wedge Patterns?
To trade descending wedges, traders first identify them by ensuring that the price is making lower highs and lows within converging trendlines. Then, they wait for the price to break out above the upper trendline, ideally accompanied by increased trading volume, which confirms the breakout. After the breakout, a common approach is to enter a long position, aiming to take advantage of the anticipated upward movement.
What Is the Target of the Descending Wedge Pattern?
The target for a descending wedge is typically set by measuring the maximum width of the wedge at its widest part and projecting that distance upwards from the breakout point. This projection gives a potential price target.
What Is the Entry Point for a Falling Wedge?
The entry point for a falling wedge is ideally just after the breakout above the upper trendline. Some traders prefer to wait for a retest of the broken trendline, which may act as a new support level, before entering a trade to confirm the breakout.
*Important: At FXOpen UK, Cryptocurrency trading via CFDs is only available to our Professional clients. They are not available for trading by Retail clients. To find out more information about how this may affect you, please get in touch with our team.
This article represents the opinion of the Companies operating under the FXOpen brand only. It is not to be construed as an offer, solicitation, or recommendation with respect to products and services provided by the Companies operating under the FXOpen brand, nor is it to be considered financial advice.

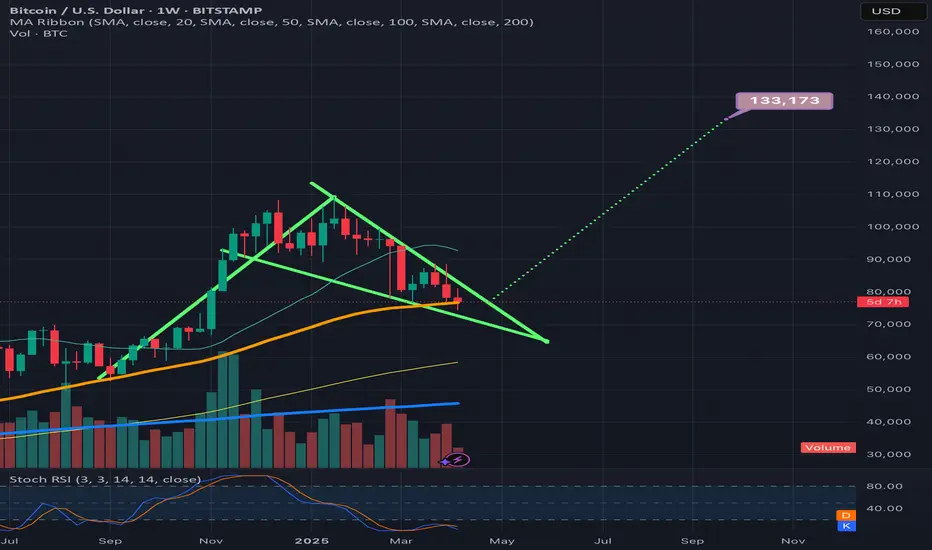
BTCUSD. Weekly bull pennantThe daily failing wedge’s top trendline is not as sharp of a trajectory as the the weekly timeframe’s and due to this, the daily time frames wege is noticeably longer, so I thinkI am going to post a follow p idea to this one that shows the longer version of the wedge, not sure which one is more valid yet at this current time. If the weekly 50ma(in orange) can hold support then we should break up from this wedge right around where I have placed the dotted measured move lne, in which case the breakout target would be around 133k, if the longer version of the wedge on the daily time frame is the more valid of the two then we will likely have to correct longer before we see a breakout. Will post the longer version n the very next idea post. *not financial advice*
The last bullish chance of Bitcoin in mid-term !!BTC is in a Falling Wedge Pattern. This means The Bulls Have Higher Chance To Claim The Trend Than Bears! No Break out Has Happened yet and we shall wait for a Break out But It should Happen Pretty Soon Because there is also a Regular Bullish Divergence On MACD as well! So The Bullish Chance for BTC Is Pretty High and we Shall see a Bullish Movement Up to $100K Pretty Quick!
-BTC is in a Falling wedge Pattern
-No Break out
-(+RD) on MACD
Give me some energy !!
✨We spend hours finding potential opportunities and writing useful ideas, we would be happy if you support us.
Best regards CobraVanguard.💚
_ _ _ _ __ _ _ _ _ _ _ _ _ _ _ _ _ _ _ _ _ _ _ _ _ _ _ _ _ _ _ _
✅Thank you, and for more ideas, hit ❤️Like❤️ and 🌟Follow🌟!
⚠️Things can change...
The markets are always changing and even with all these signals, the market changes tend to be strong and fast!!

GOLD → Consolidation or continuation of the fall. 3013 triggerFX:XAUUSD is going through the strongest liquidation phase. The fall is triggered by profit-taking amid last week's strong news. Additional pressure is created by the strong NFP report released on Friday. The economic risk situation is bifurcating....
Gold prices rebounded after falling in the Asian session, consolidating the drop triggered by the intensifying trade war between the US and China. Donald Trump's comments about rejecting deals with China have heightened recession fears, raising the likelihood of a Fed rate cut.
Against this backdrop, there was increased interest in gold as a protective asset, despite the rise in the dollar and bond yields. However, further strengthening of gold is questionable due to profit taking and lack of new economic data from the US.
Technically, the price is consolidating under pressure against the support at 3017-3013. A descending triangle is forming on the local timeframe.
Resistance levels: 3033, 3057
Support levels: 3017, 3013, 2981
Based on the current situation and strong pressure on the market, we can expect two situations to develop:
1) breakdown of support 3017 - 3013, if the structure of the descending triangle on the local timeframe will be preserved. The target will be the support of 3000, 2981.
2) Or, the price will close inside the range with the target of consolidation between 3057 - 3033 - 3013 (consolidation of forces after a strong fall and liquidation)
Regards RLinda!

XRP just found bounce support on the bttm trendline of the wedgeLooking like a very valid pattern on the weekly hart. My guess is it will break upward somewhere around where I have arbitrarily placed the dottedmeasuredmove line, in which case the breakout target would be somewhere around $4.80 always a chance we retest the bottom trendline and even send a wick below. It before confirming a break upward though. *not financial advice*

SPXUSDT manipulated rise before the fallThe market is pulling back after a strong drop in the Asian session. At the moment, while bitcoin is showing -2%, BINANCE:SPXUSDT.P is accelerating by 15% in the hunt for liquidity.
Possible entry into liquidity zone and false resistance breakout
False resistance breakout
1) 0.5473
2) 0.6689
Market is bearish, no hint of growth
A pullback is forming with the aim of accumulation or liquidity before continuing the fall
The fall may continue after the bitcoin correction is over
