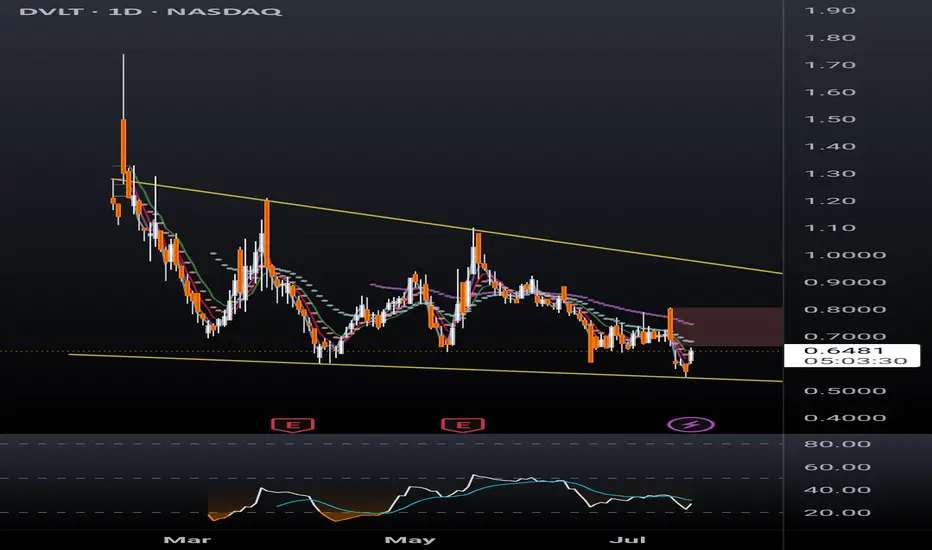
DVLT falling wedge, TP $1+DVLT a relatively new ticker is already drawing a lot of attention. Up 13% today after hitting new all time low yesterday, sure to catch a lot of eyes from retail investors. With recent news releases such as a licensing agreement with IBM, a lawsuit against naked short selling, and US patent allowances, target prices have been announced ranging from $3 to $11/share.
Disclaimer, this ticker is PRONE TO HEAVY DILUTION, however in order to remain listed on NASDAQ the SP will have to hit $1 and remain there. This being the case, the company must have something in the books to break upward out of this falling wedge and give shareholders a reason to stay with the company long term.
I'm just a cat not a financial advisor.
Fallingwedgepattern
Bitcoin Towards $118KDaily chart,
The Bitcoin BITSTAMP:BTCUSD has just formed a falling wedge pattern, down from the highest High 109356.
Some consolidation may happen in the range 86000 to 82000.
Closing above 86000 for 2 days will give a strong buy signal for a bullish movement, and the target will be 118150 passing through the shown resistance levels.
Consider the Stop Loss below 82000
Note: Always place a near profit protection level, as the BTC is volatile.

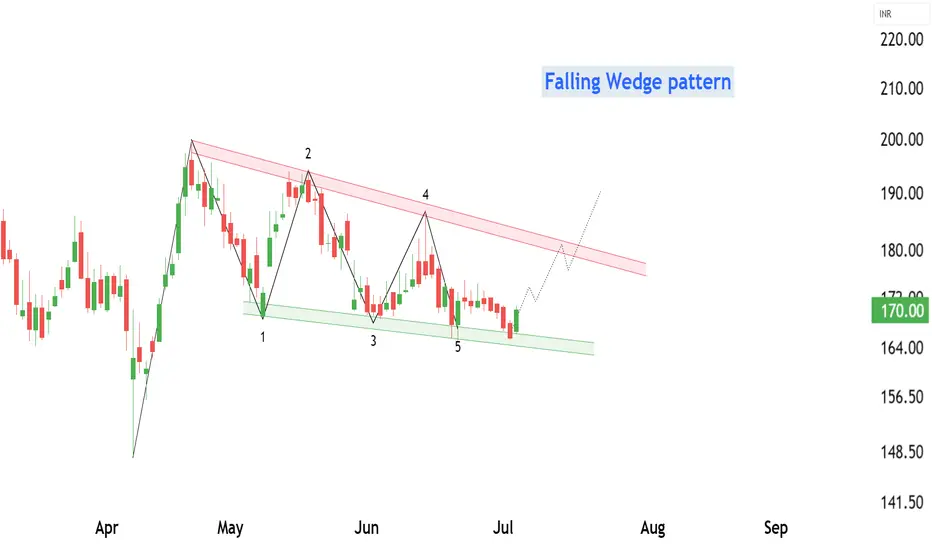
HINDUSTAN OIL EXPLORATION at Best Support !!This is daily chart of HINDUSTAN OIL EXPLORATION .
HINDOILEXP having a good Support zone at 162-165 level.
HINDOILEXP has formed a Falling Wedge Pattern with Support near at 165 level.
If this level is sustain , then we may see higher prices in HINDOILEXP .
Thank You !!
$Jasmy Possible falling wedge breakout This falling wedge pattern shows up in the 3day interval. The 4hr and other popular time intervals had bad news patterns on the hourly, an ascending wedge with downside breakout.
I guess we can wait and see ;)
thanks again,

Boeing (BA, 1W) Falling Wedge + H-Projection TargetOn the weekly chart, Boeing has formed a classic falling wedge — a bullish reversal pattern that typically signals the end of a correction phase. After a sharp decline from $267.97 to $138, price action began to compress within a wedge, forming lower highs and higher lows on declining volume — a textbook setup for a breakout.
The structure remains active: a confirmed breakout above the upper wedge boundary, with a retest near $181.60 (0.618 Fibonacci retracement), would validate the pattern and trigger the next upward phase.
The projected move (H) equals the height of the previous impulse — $130.02. Adding this to the base of the wedge (~$138) yields a technical target of $268.00, aligning with the previous high and completing the structural recovery.
Technical summary:
– Multiple confirmations of wedge support
– Volume declining into the apex (bullish)
– Entry zone: breakout + retest at $181.60
– Mid-level resistance: $198.09 (0.5 Fibo)
– Final target: $267.97–$268.00 (H-projection complete)
Fundamentals:
Despite operational setbacks, Boeing remains structurally positioned for recovery as demand for commercial aircraft rebounds. Additional support could come from improving supply chains, increased defense contracts, and a more dovish outlook from the Federal Reserve heading into 2025.
A breakout above $181.60 and sustained momentum would confirm the falling wedge pattern and activate the H-measured move toward $268. This is a structurally and fundamentally supported mid-term recovery setup

BTCUSD - Bullish Breakout from Falling Wedge Pattern | Target Bitcoin has broken out of a Falling Wedge Pattern on the daily timeframe, signaling a bullish reversal that aligns with the broader market sentiment. Let’s examine this setup in detail, from pattern recognition to key support/resistance levels and trade planning.
🧠 Pattern Analysis – Falling Wedge Formation
The chart displays a textbook Falling Wedge, which is a bullish chart pattern that typically forms after a downtrend. It’s characterized by converging trendlines sloping downward, showing a slowdown in bearish momentum and a potential reversal point.
Formation Period: This wedge developed over a multi-week period (Feb–April 2025).
Structure: Each swing high and swing low forms lower highs and lower lows inside the wedge.
Breakout Confirmation: Price has decisively broken above the upper trendline of the wedge, validating a potential bullish continuation.
👉 Falling Wedge patterns are often seen near the end of a corrective move and suggest accumulation before a rally.
🔎 Key Technical Zones
🔸 Resistance Zone (~$103K–$105K)
This area has historically acted as a strong resistance zone.
Price is currently consolidating just below this region, indicating a possible breakout retest or a temporary pause before the next leg up.
🔸 Trendline Support
A new rising trendline has emerged post-breakout, acting as dynamic support.
Price has respected this trendline multiple times, forming higher highs and higher lows — a strong bullish signal.
🔸 SR Interchange Zone (~ GETTEX:92K –$94K)
Previously acted as resistance; now flipped to support.
This makes it a critical level where bulls may defend positions, and a good place for a stop-loss.
🔸 Support Zone (~$75K–$78K)
Major historical support area where the wedge bottom formed.
Buyers stepped in aggressively in this zone during the final leg of the wedge.
🎯 Trade Plan
This setup offers a clearly defined risk-reward profile based on breakout trading principles.
📌 Entry Idea:
Current consolidation near resistance offers two entry strategies:
Aggressive Entry: Near current price, anticipating breakout continuation.
Conservative Entry: On a confirmed breakout above $105K or a pullback to trendline support around GETTEX:98K –$100K.
✅ Target: $112,116
Measured by projecting the height of the wedge from the breakout point.
Also aligns with a previous key structural high, adding confluence to the target.
⛔ Stop Loss: $93,294
Strategically placed just below the SR interchange zone and rising trendline.
Protects against potential fakeouts or trendline breaks.
📉 Risk Management
Risk/Reward Ratio: ~2:1 or higher depending on entry point.
Always use proper position sizing.
Be prepared to cut the trade if price closes below trendline and SR zone on high volume.
🔮 Outlook and Strategy
This breakout suggests Bitcoin may be entering a renewed bullish phase. If macro conditions remain favorable and price sustains above key support zones, we could see continuation toward the $112K region.
However, it’s important to monitor:
Volume: Watch for rising volume on any breakout above the resistance zone.
Market Sentiment: External factors (e.g., news, ETF flows, regulatory updates) may influence the move.
Trendline behavior: A break and close below the rising support line may invalidate the setup.
💬 Final Thoughts
This is a technically clean setup combining a bullish pattern breakout, supportive structure (trendline & SR zones), and a logical target based on classical charting. If Bitcoin maintains current momentum, traders may see significant upside in the coming weeks.

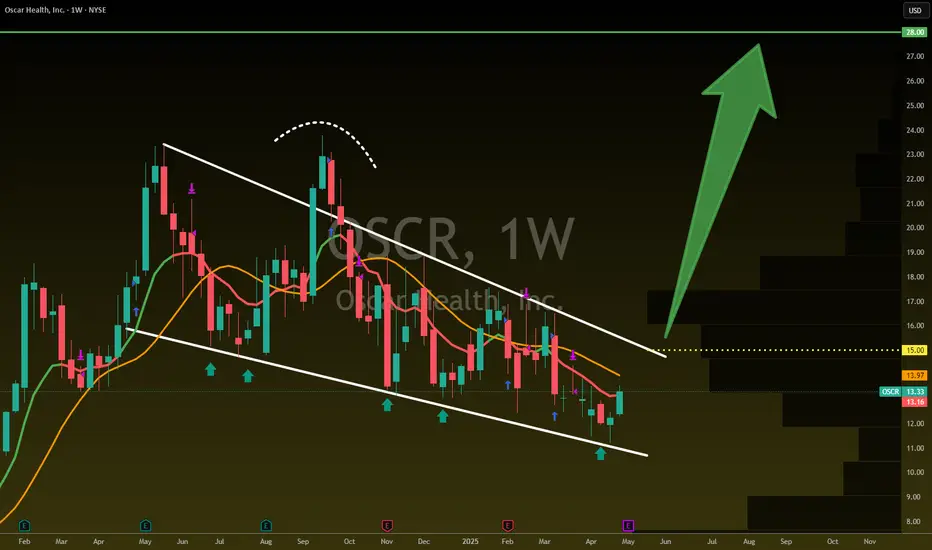
IT IS TIME $OSCRIT IS TIME NYSE:OSCR
Falling Wedge Approaching breakout!
Breakout = $28
Not financial advice
#PARTIUSDT is showing signs of a reversal🚀 The price BYBIT:PARTIUSDT.P is showing signs of a reversal after a prolonged downtrend.
🚀 The scenario becomes more likely if the price holds above $0.1520 with increasing volume.
🚀 Watch for a breakout and confirmation above the $0.1500–$0.1520 zone — this would strengthen the bullish setup.
🚀 If volume picks up during the continuation of the move, a quick push toward $0.18 is possible.
📈 LONG BYBIT:PARTIUSDT.P from $0.1533
🛡 Stop loss: $0.1492
🕒 Timeframe: 1H
✅ Overview:
➡️ The price has broken out above the Bearish Flag, confirming a break in the downtrend structure.
➡️ The Double Bottom formation increases the likelihood of an upward move.
➡️ Entry at $0.1533 is just above the resistance zone and confirms the breakout.
➡️ The upward potential remains toward $0.1600 and beyond, aiming for the POC volume area.
🎯 TP Targets:
💎 TP 1: $0.1555
💎 TP 2: $0.1575
💎 TP 3: $0.1600
📢 Support zone: $0.1500–$0.1510 — must hold to maintain the bullish structure.
📢 If price consolidates above $0.1555, expect a potential acceleration toward $0.1600.
📢 A drop below $0.1492 invalidates the scenario — stop is mandatory.
🚀 BYBIT:PARTIUSDT.P breaks key level — bullish signal confirmed! Watch for continuation!

Falling Wedge Trading Pattern: Unique Features and Trading RulesFalling Wedge Trading Pattern: Unique Features and Trading Rules
Various chart patterns give an indication of possible market direction. A falling wedge is one such formation that indicates a possible bullish reversal. This FXOpen article will help you understand whether the falling wedge pattern is bullish or bearish, what its formation signifies about the market direction, and how it can be used to spot trading opportunities.
What Is a Falling Wedge Pattern?
Also known as the descending wedge, the falling wedge technical analysis chart pattern is a bullish formation that typically occurs in the downtrend and signals a trend reversal. It forms when an asset's price drops, but the range of price movements starts to get narrower. As the formation contracts towards the end, the buyers completely absorb the selling pressure and consolidate their energy before beginning to push the market higher. A falling wedge pattern means the end of a market correction and an upside reversal.
How Can You Spot a Falling Wedge on a Price Chart?
This pattern is usually spotted in a downtrend, which would indicate a possible bullish reversal. However, it may appear in an uptrend and signal a trend continuation after a market correction. Either way, the falling wedge provides bullish signals. The descending formation generally has the following features.
- Price Action. The price trades lower, forming lower highs and lower lows.
- Trendlines. Traders draw two trendlines. One connects the lower highs, and the other connects the lower lows. Finally, they intersect towards a convergence point. Each line should connect at least two points. However, the greater the number, the higher the chance of the market reversal.
- Contraction. The contraction in the price range signals decreasing volatility in the market. As the formation matures, new lows contract as the selling pressure decreases. Thus, the lower trendline acts as support, and the price consolidating within the narrowing range creates a coiled spring effect, finally leading to a sharp move on the upside. The price breaks through the upper trendline resistance, indicating that sellers are losing control and buyers are gaining momentum, resulting in an upward move.
- Volume. The trading volume ideally decreases as the pattern forms, and the buying volume increases with the breakout above the upper trendline, reflecting a shift in momentum towards the buyers.
Falling and Rising Wedge: Differences
There are two types of wedge formation – rising (ascending) and falling (descending).
An ascending wedge occurs when the highs and lows rise, while a descending wedge pattern has lower highs and lows. In an ascending formation, the slope of the lows is steeper and converges with the upper trendline at some point, while in a descending formation, the slope of the highs is steeper and converges with the support trendline at some point.
Usually, a rising wedge indicates that sellers are taking control, resulting in a downside breakdown. Conversely, a descending wedge pattern indicates that buyers are gaining momentum after consolidation, generally resulting in an upside breakout.
The Falling Wedge: Trading Rules
Trading the falling wedge involves waiting for the price to break above the upper line, typically considered a bullish reversal. The pattern’s conformity increases when it is combined with other technical indicators.
- Entry
According to theory, the ideal entry point is after the price has broken above the wedge’s upper boundary, indicating a potential upside reversal. Furthermore, this descending wedge breakout should be accompanied by an increase in trading volume to confirm the validity of the signal.
The price may retest the resistance level before continuing its upward movement, providing another opportunity to enter a long position. However, the entry point should be based on the traders' risk management plan and trading strategy.
- Take Profit
It is essential to determine an appropriate target level. Traders typically set a profit target by measuring the height of the widest part of the formation and adding it to the breakout point. Another approach some traders use is to look for significant resistance levels above the breakout point, such as previous swing highs.
- Stop Loss
Traders typically place their stop-loss orders just below the lower boundary of the wedge. Also, the stop-loss level can be based on technical or psychological support levels, such as previous swing lows. In addition, the stop-loss level should be set according to the trader's risk tolerance and overall trading strategy.
Trading Example
In the chart above, there is a falling wedge. A trader opened a buy position on the close of the breakout candlestick. A stop loss was placed below the wedge’s lower boundary, while the take-profit target was equal to the pattern’s widest part.
Falling Wedge and Other Patterns
Here are chart patterns that can be confused with a falling wedge.
Falling Wedge vs Bullish Flag
These are two distinct chart formations used to identify potential buying opportunities in the market, but there are some differences between the two.
A descending wedge is a bullish setup, forming in a downtrend. It is characterised by two converging trendlines that slope downward, signalling decreasing selling pressure. A breakout above the upper trendline suggests a bullish move.
A bullish flag appears after a strong upward movement and forms a rectangular shape with parallel trendlines that slope slightly downward or move sideways. This formation represents a brief consolidation before the market resumes its upward trajectory.
While the falling wedge indicates a potential shift in a downtrend, the bullish flag suggests a continuation of an uptrend.
Falling Wedge vs Bearish Pennant
The falling wedge features two converging trendlines that slope downward, indicating decreasing selling pressure and often signalling a bullish reversal when the price breaks above the upper trendline.
Conversely, the bearish pennant forms after a significant downward movement and is characterised by converging trendlines that create a small symmetrical triangle. This pattern represents a consolidation phase before the market continues its downward trend upon breaking below the lower trendline.
While the falling wedge suggests a potential bullish move, the bearish pennant indicates a continuation of the bearish trend.
Falling Wedge vs Descending Triangle
The falling wedge consists of two downward-sloping converging trendlines, indicating decreasing selling pressure and often signalling a bullish reversal when the price breaks above the upper trendline. In contrast, the descending triangle features a flat lower trendline and a downward-sloping upper trendline, suggesting a buildup of selling pressure and typically signalling a bearish continuation when the price breaks below the flat lower trendline.
While the falling wedge is associated with a potential bullish move, the descending triangle generally indicates a bearish trend.
Falling Wedge: Advantages and Limitations
Like any technical pattern, the falling wedge has both limitations and advantages.
Advantages
- High Probability of a Reversal. The falling wedge is often seen as a strong, bullish signal, especially when it occurs after a downtrend. It suggests that selling pressure is subsiding, and a reversal to the upside may be imminent.
- Clear Entry and Exit Points. The pattern provides clear points for entering and exiting trades. Traders often enter when the price breaks out above the upper trendline and set stop-loss orders below a recent low within the formation.
- Versatility. The wedge can be used in various market conditions. It is effective in both continuation and reversal scenarios, though it is more commonly associated with bullish reversals.
- Widely Recognised. Since the falling wedge is a well-known formation, it is often self-fulfilling to some extent, as many traders recognise and act on it, further driving the market.
Limitations
- False Breakouts. Like many chart patterns, the falling wedge is prone to false breakouts. Prices may briefly move above the resistance line but then fall back below, trapping traders.
- Dependence on Market Context. The effectiveness of the falling wedge can vary depending on broader market conditions. In a strong downtrend, it might fail to result in a significant reversal.
- Requires Confirmation. The wedge should be confirmed with other technical indicators or analysis tools, such as volumes or moving averages, to increase the likelihood of an effective trade. Relying solely on the falling wedge can be risky.
- Limited Use in Low-Volatility Markets. In markets with low volatility, the falling wedge may not be as reliable, as price movements might not be strong enough to confirm the falling wedge's breakout.
The Bottom Line
The falling wedge is a powerful chart pattern that can offer valuable insights into potential trend reversals or continuations, depending on its context within the broader market. By understanding and effectively utilising the falling wedge in your strategy, you can enhance your ability to identify many trading opportunities. As with all trading tools, combining it with a comprehensive trading plan and proper risk management is crucial.
FAQ
Is a Falling Wedge Bullish?
Yes, the falling wedge is a bullish continuation pattern in an uptrend, and it acts as a bullish reversal formation in a bearish market.
What Does a Falling Wedge Pattern Indicate?
It indicates that the buyers are absorbing the selling pressure, which is reflected in the narrower price range and finally results in an upside breakout.
What Is the Falling Wedge Pattern Rule?
The falling wedge is a technical analysis formation that occurs when the price forms lower highs and lower lows within converging trendlines, sloping downward. Its rule is that a breakout above the upper trendline signals a potential reversal to the upside, often indicating the end of a downtrend or the continuation of a strong uptrend.
How to Trade Descending Wedge Patterns?
To trade descending wedges, traders first identify them by ensuring that the price is making lower highs and lows within converging trendlines. Then, they wait for the price to break out above the upper trendline, ideally accompanied by increased trading volume, which confirms the breakout. After the breakout, a common approach is to enter a long position, aiming to take advantage of the anticipated upward movement.
What Is the Target of the Descending Wedge Pattern?
The target for a descending wedge is typically set by measuring the maximum width of the wedge at its widest part and projecting that distance upwards from the breakout point. This projection gives a potential price target.
What Is the Entry Point for a Falling Wedge?
The entry point for a falling wedge is ideally just after the breakout above the upper trendline. Some traders prefer to wait for a retest of the broken trendline, which may act as a new support level, before entering a trade to confirm the breakout.
*Important: At FXOpen UK, Cryptocurrency trading via CFDs is only available to our Professional clients. They are not available for trading by Retail clients. To find out more information about how this may affect you, please get in touch with our team.
This article represents the opinion of the Companies operating under the FXOpen brand only. It is not to be construed as an offer, solicitation, or recommendation with respect to products and services provided by the Companies operating under the FXOpen brand, nor is it to be considered financial advice.

USD Bear is here: Important Analysis on FX Pairs, Stock MarketIn this video I got over some important outlooks on the EUR/USD, GBP/USD and USD/JPY along with outlook on the stock market.
The U.S. Dollar has been getting absolutely crushed along with the stock market which usually has the opposite effect. Considering we may be into a stagflation scenario, this is not surprising.
Tariffs have spiked volatility and puts the Federal Reserve in a very tight spot of Interest Rate Policy. Interesting times ahead to say the least.
From a pure technical analysis point of view, the USD may be set for much further losses as monthly patterns suggest a big move may be on the horizon. Will be keeping a very close eye on these as we move forward in these stormy waters of the U.S. economy.
As always, Good Luck & Trade Safe.

Bullish Breakout from Falling Wedge | Upside Potential Ahead!Market Overview:
The Bitcoin (BTC/USD) 4-hour chart is displaying a Falling Wedge pattern, a well-known bullish reversal structure. This indicates that the downtrend is weakening, and a potential breakout could lead to a strong upside move.
🔹 Key Technical Analysis
1️⃣ Falling Wedge Formation & Breakout
Bitcoin has been trading inside a falling wedge, marked by lower highs and lower lows, signaling a contraction in volatility.
A breakout above the upper trendline of the wedge is forming, suggesting a bullish reversal and the start of an uptrend.
Falling wedges typically lead to a rally equal to the height of the pattern, giving a measured move target of $114,334.
2️⃣ Price Action & Confirmation Levels
A clean breakout above $87,000 would confirm bullish momentum.
If price successfully retests the wedge’s upper boundary and holds support, further bullish continuation is expected.
The psychological level of $100,000 could act as an interim resistance before the final target is reached.
3️⃣ Upside Target & Resistance Zones
The measured move suggests a potential rally towards $114,334, aligning with previous resistance zones.
This target represents a 30.55% gain from the breakout level.
Traders should watch for pullbacks and retests as part of the breakout confirmation.
📈 Trading Plan - Long Setup
🔹 Entry: Look for a confirmed breakout above $87,000, or a retest of support.
🔹 Stop Loss: Below $84,000, protecting against false breakouts.
🔹 Take Profit: $100,000 - $114,334 (previous resistance & measured move target).
🔹 Risk-Reward Ratio: Strong bullish setup with favorable upside potential.
🛑 Risk Factors to Consider
⚠️ A failed breakout and a drop below $83,000 would invalidate the bullish setup.
⚠️ External factors such as macroeconomic events, regulatory news, and BTC ETF developments could influence volatility.
Final Thought
The breakout from the falling wedge signals a potential bullish continuation for Bitcoin, with targets set around $114,334. Traders should watch for confirmation above $87,000 and manage risk accordingly.

(ETH/USD) Breakout from Falling Wedge – Bullish Momentum Ahead?Ethereum (ETH/USD) Breakout from Falling Wedge – Bullish Momentum Ahead?
This 4-hour Ethereum chart shows a breakout from a falling wedge pattern, a bullish reversal formation. The price has started forming higher lows, signaling potential upside movement. The projected target is around $2,411, indicating a significant recovery.
A successful retest of the breakout level could confirm further upward momentum. Traders may consider long positions while monitoring resistance levels.
📌 Key Levels:
Support: ~$1,879
Target: ~$2,411
Resistance Zones: $2,100 - $2,200
Would you like me to refine this further? 🚀

Bitcoin (BTCUSD) - Bullish Breakout from Strong Falling WedgeBitcoin is currently showing signs of a potential breakout from a strong falling wedge pattern on the 4H chart, which is a classic bullish reversal signal.
🔍 Technical Highlights:
The falling wedge has been forming since late January, creating a series of lower highs and lower lows.
Price action is now consolidating near the wedge resistance, indicating an impending breakout.
A previous bullish leg saw a price rally of 25,428.16 (+30.29%), suggesting strong historical momentum.
If BTC breaks out cleanly, we could see a similar or stronger move—projecting a potential rally of 28,086.24 (+31.12%).
📈 Expected Target : ~$118,141, aligning with the measured move from the wedge breakout.
🧠 Trading Insigh t: Watch for a confirmed breakout with strong volume above the wedge resistance zone. Retests of the breakout area can offer ideal entries for continuation trades.

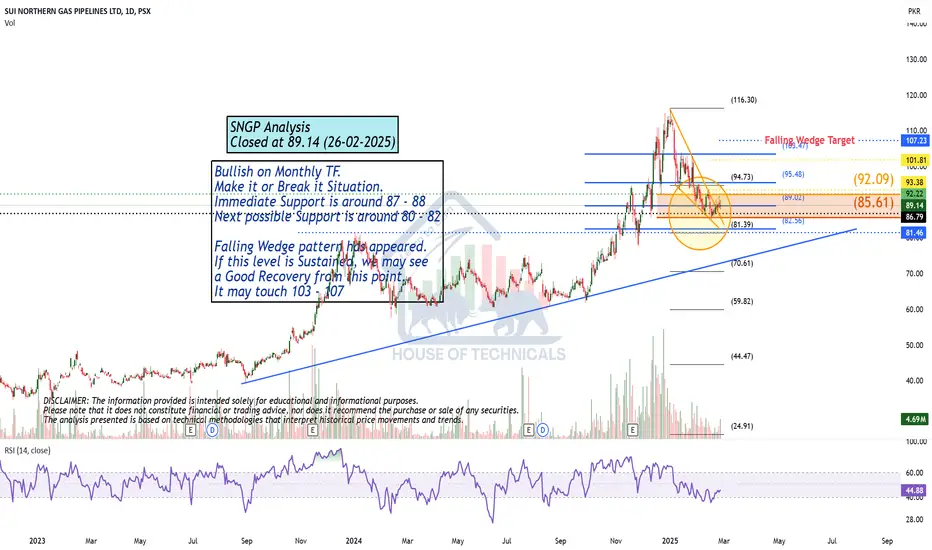
Bullish on Monthly TF.Bullish on Monthly TF.
Make it or Break it Situation.
Immediate Support is around 87 - 88
Next possible Support is around 80 - 82
Falling Wedge pattern has appeared.
If this level is Sustained, we may see
a Good Recovery from this point.
It may touch 103 - 107
BERA Defies Market Trends, Eyes 160% Surge Amid Bullish MomentumIn a market facing significant volatility, BIST:BERA has emerged as a top-performing Layer 1 (L1) blockchain coin, surging 13% in 24 hours and inching closer to its all-time high (ATH) of $15.20. With a resurgence in buying pressure, increased spot inflows, and a strong technical outlook, BIST:BERA is positioning itself for a remarkable recovery.
Why is BIST:BERA Pumping?
- Strong Buying Pressure: The Chaikin Money Flow (CMF) indicator stands at 0.04, signaling bullish inflows.
- Capital Movement: After witnessing $2.6 million in outflows, BIST:BERA has now recorded $316K in fresh spot inflows, indicating renewed investor interest.
- Investor Sentiment: Holders are choosing to accumulate rather than sell, reinforcing long-term confidence in the asset’s value.
Moby Expands to Berachain, Strengthening Its DeFi Ecosystem
A pivotal development for the Berachain ecosystem is the launch of Moby, the No.1 options protocol on Arbitrum, on the Berachain Mainnet. Moby has facilitated over $3.5 billion in total trading volume and is now set to transform on-chain derivatives trading within the Berachain network.
Berachain distinguishes itself as an EVM-identical Layer 1 blockchain that operates on the revolutionary Proof of Liquidity (PoL) consensus mechanism. Unlike traditional Proof-of-Stake (PoS) networks, PoL embeds liquidity provisioning directly into the security model, ensuring that validators, applications, and users benefit from a seamless and capital-efficient ecosystem.
Moby’s selection for Berachain’s prestigious Request for Application (RFA) program signals its critical role in the ecosystem. The protocol has also forged key partnerships with Kodiak, Infrared, PumpBTC, and GMX, further expanding its influence in DeFi.
Technical Outlook: BIST:BERA ’s Bullish Setup
At the time of writing, BIST:BERA is up 4%, ranking among the top-performing altcoins of the week. Despite a 65% decline from its listing price, key indicators suggest that BIST:BERA could be on the verge of a substantial breakout:
- Relative Strength Index (RSI) at 65: Holding strong, indicating sustained momentum without being overbought.
- Falling Wedge Pattern: A classic bullish reversal pattern, hinting at an imminent uptrend.
- Potential 160% Surge: BIST:BERA could aim to reclaim its previous ATH of $15.20, presenting a significant upside opportunity.
Conclusion
With a combination of **strong technical indicators, surging capital inflows, and an expanding DeFi ecosystem**, BIST:BERA is well-positioned for a significant rally. As the asset gains traction, traders and investors should closely monitor its price action, as the next leg up could be the most explosive yet.
Will BIST:BERA reclaim its ATH and set new records? The market is watching, and the momentum is undeniable.

Bitcoin Analysis—Bulls vs Bears—Who Will Win This Battle!?As I expected in the previous post , Bitcoin ( BINANCE:BTCUSDT ) attacked the Support zone($96,520-$95,720) and 100_SMA(Daily) but started to rise again. The increase in the last few hours has NOT been accompanied by high volume so far.
Bitcoin is moving in the Resistance zone($100,520-$97,200) and near the Potential Reversal Zone(PRZ) , the upper lines of the Falling Wege Pattern , the Monthly Pivot Point , and 50_SMA(Daily) .
According to the theory of Elliott waves , Bitcoin seems to have succeeded in completing the Expanding Flat(ABC/3-3-5) near the upper lines of the Falling Wege Pattern . If Bitcoin goes above $99,200 , this wave count will expire .
Educational tip : If you cut the falling wedge pattern exactly in half, you will notice that most of the candles are in the lower half, and whenever Bitcoin hits the upper lines, it starts to fall immediately, which means that the power of sellers is more than buyers. Although the wedge pattern is a bullish pattern, we cannot expect an increase until the upper line is validly broken.
I expect Bitcoin to re-attack the 100_SMA(Daily) and Support zone($96,520-$95,720) in the coming hours, and if it breaks , it will also attack the lower line of the falling wedge pattern .
Note: If Bitcoin breaks the upper lines of the falling wedge pattern in huge volumes, we should most likely wait for the break of the Resistance zone($100,520-$97,200). However, the main resistance of Bitcoin is the $107,000 range.
Note: If Bitcoin manages to break the lower line of the falling wedge pattern and 100_SMA(Daily), we should wait for Bitcoin to attack the Heavy Support zone($93,300-$90,500) and Support lines.
Which scenario do you think will happen to Bitcoin?
Please respect each other's ideas and express them politely if you agree or disagree.
Bitcoin Analyze (BTCUSDT), 1-hour time frame.
Be sure to follow the updated ideas.
Do not forget to put Stop loss for your positions (For every position you want to open).
Please follow your strategy and updates; this is just my Idea, and I will gladly see your ideas in this post.
Please do not forget the ✅' like '✅ button 🙏😊 & Share it with your friends; thanks, and Trade safe.

$NYSE:OKLO breaking a Wedge/Flag with short term 25%-60% upsideNYSE:OKLO is breaking out of a consolidation pattern (falling wedge) And what appears to be a flag pattern.
Confirmation is a 24% uptick in price along with strong volume.
Initial Price Target is ~$34.50 to complete the falling wedge pattern, which is a short term 25% upside.
Secondary Price Target is ~$42.90 to complete the flag pattern, which is a longer term 60% upside
Good Luck!

How Far ADA (Cardano) Can Make??
We've enjoyed awesome rally in November 24 in #ada. But After then CRYPTOCAP:ADA is forming a falling wedge Pattern.
This falling wedge's breakout can make #adausdt to rally upto 2$. Also with micro elliott wave count, wave 3 also aligns with wedge target.
Although by macro wave count, we can see #ada rallying upto 2.4-2.6$ region in upcoming #altseason.

BTCFDUSD to touch 92000 AgainThe price action tells all ,just read the number and check its historical data.
The price will have to fall .

$NASDAQ:LIDR breaking out of falling wedge on newsNASDAQ:LIDR appears to be breaking out on news of additional funding. Confirmation - huge uptick in volume as well as
Buy-in Aggressive - $2.45; Conservative - Price after closing above $2.30
Price Target $9.79
Good Luck!

$NASDAQ:LCID Going for the break out?Up 8% after testing lower, but holding the $3.20 support line in the previous trading day.
Upside is to ~$8/share.
Check for end of day volume for confirmation, should be relatively high volume spike.

$NASDAQ:LCID Monitoring for a 168% breakoutWatching Lucid for a breakout from its falling wedge pattern. This may retest the support at ~$3.20 before breaking out.
Entry: ~3.30
Confirmation: A spike in volume and a good % uptick in the price.
Stop loss: 200 day moving average (~$2.92)
Price Target: 8.84

Uptrend & Downtrend Bullish Falling Wedge Pattern TutorialA bullish falling wedge is a charting pattern that signals a potential reversal from a downtrend to an uptrend. Here's a breakdown of its key characteristics:
Shape: The pattern forms a wedge that slopes downward, with the upper trendline connecting the highs and the lower trendline connecting the lows. The key is that the highs and lows get closer together as the pattern develops.
Trend: It typically forms during a downtrend, indicating that selling pressure is decreasing.
Breakout: The pattern is bullish when the price breaks above the upper trendline. This breakout suggests that the downward trend is losing momentum, and an upward trend may follow.
Volume: During the falling wedge formation, volume tends to decrease, which supports the idea that selling pressure is diminishing.
Retest: After the breakout, it's common for the price to retest the upper trendline, and if it holds, it provides further confirmation of the bullish reversal.
Example
Imagine a stock that has been falling for several months. The price forms lower highs and lower lows, creating a narrowing wedge. Suddenly, the price breaks above the upper trendline with increased volume, signaling a potential reversal and the start of an upward trend.
