NIO FALLING WEDGE On the chart we can see the falling wedge pattern.
Our strategy is to open a long position when the price breaks above the upper resistance.
Targets are shown on the chart.
Fallingwedgepattern

MRNA a medical Technology Stock LONG MRNA is a medical technology company. It is in the vaccine sector and competes ( well) with
NVAX and PFE among others. Earnings are upcoming on 8/3 in about a week.
On the 30 minute chart it appears to be in a descending wedge pattern which is typically
a bottoming with a breakout over and beyond the descending trendline. The relative
trend indicator shows the downtrend to be a slow grinding type trend with some minor
corrections along the way. As might be expected the RS lines are low in the indicator's
channel. I see this as a setup for a pre-earnings play with the expectation that MRNA
could breakout above the resistance trend line and move toward the horizontal resistance
of the triple top earlier in mid-July. I see medical stocks as a good alternative to technology
stocks that may be overextended and stressed by the current financial chaos pressuring
the markets. Another approach is a two call options targeting $ 125 expiring 8/11
and running the first until 100% profit or 8/2, the day before the expiration whichever
comes first and letting the other run through earnings into the middle of the following
week at 8/9. I always like to cut these short of expiration by a few days to diminish the
effects of time decay.

SOLUSDTSOLANAUSDT has formed falling wedge and now break through the wedge. a little bit of consolidation was also formed but bullish divergence has play the role to break that consolidation as well.

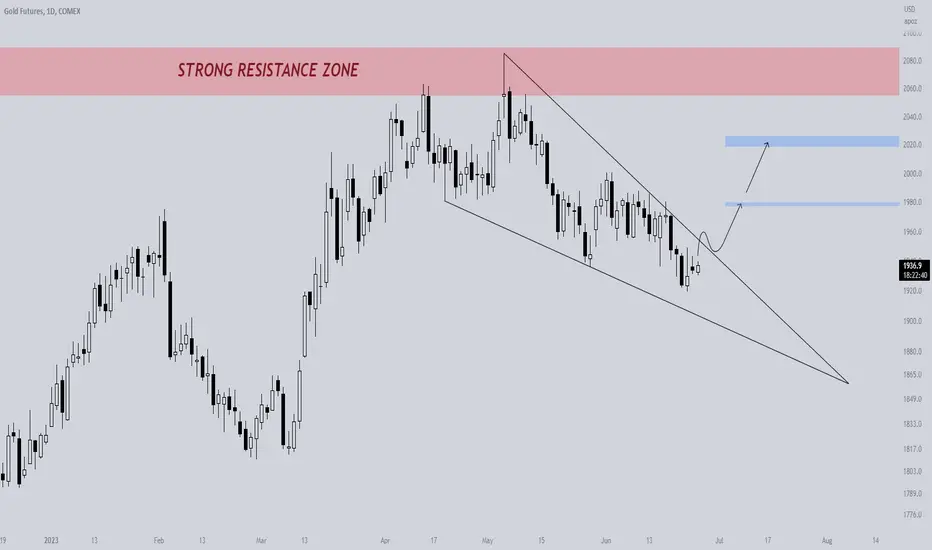
GOLD - Falling wedge pattern
- 1D
Currently, gold is drawing a Falling wedge pattern.
It is likely to try to break through the top of the wedge soon.
Let's see.
🚀📈 Massive Profits: 20% Gains on $UPWK and 78% Surge on $SUNW📈🔥 Get ready to witness the power of falling wedge patterns as we share our latest triumphs! Our TradingView predictions were spot-on last month as we called out the breakout of the falling wedge pattern on NASDAQ:UPWK , resulting in a remarkable 20% gain. But that's not all! We also accurately identified and shared insights on the explosive NASDAQ:SUNW falling wedge breakout, which skyrocketed by an impressive 78%! Don't miss out on our exceptional TradingView ideas and analysis. Join us now to stay ahead of the game and unlock profitable opportunities in the market!
In this description, we highlight the success of the falling wedge patterns on NASDAQ:UPWK and NASDAQ:SUNW that were accurately called out on TradingView. We create a sense of excitement and urgency, encouraging viewers to check out our TradingView ideas for valuable insights and opportunities in the market.
#TradingViewAnalysis #TradingViewIdeas #FallingWedgePattern #StockMarket #ProfitableTrades #TechnicalAnalysis #StockTrading #TradingOpportunities #MarketInsights #TradingSuccess

📈 $APE Unveiling a Promising Node Falling Wedge Pattern! 🐵📉$APE/USDT has caught our attention with a notable Node Falling Wedge formation. This pattern signifies a potential bullish reversal and presents an intriguing trading opportunity. 🚀💥
Will $APE/USDT break out of the wedge pattern and ascend to new heights? Join the discussion and let's unravel the potential of this exciting cryptocurrency! 📊💬
#APE #NodeFallingWedge #BullishReversal #CryptoTrading #TradingOpportunity #TechnicalAnalysis
#Crypto #Trading #TechnicalAnalysis
Disclaimer: This analysis is for informational purposes only and should not be considered as financial advice. Always do your own research before making any investment decisions. Happy trading! 📈💰"
Remember, trade wisely and manage risk effectively!

Falling Wedge Alert on $TWT! Potential Reversal Opportunity? 💹Hey traders! Today, I want to share an exciting chart pattern I've identified on $TWT (Trust Wallet Token). Let's dive into the falling wedge pattern and explore the potential for a bullish reversal. 📊💡
Pattern: Falling Wedge 📉🔽
Symbol: $TWT 💰
Overview:
A falling wedge is a bullish chart pattern characterized by converging trendlines, with the upper trendline sloping downward and the lower trendline sloping upward. It typically indicates a potential reversal from bearish to bullish. Let's examine the falling wedge pattern on $TWT in more detail. ⚡💹
Key Features of the Falling Wedge on $TWT:
Converging Trendlines: Notice how the upper trendline connects the lower highs, while the lower trendline connects the higher lows. This pattern suggests a potential shift in market sentiment. 📈📉
Decreasing Volatility: Observe the gradual contraction of price range and decreasing trading volume as the pattern forms. These characteristics may signal diminishing selling pressure. 📉🔻📈
Breakout Expectations:
A falling wedge pattern often precedes a bullish breakout. Traders typically anticipate a decisive move above the upper trendline as confirmation. However, it is important to wait for a clear breakout before considering any trades. 🚀📈
Trading Strategy:
Entry Point: Consider entering a long position once $TWT convincingly breaks above the upper trendline of the falling wedge pattern. This breakout may suggest a potential trend reversal and the start of a bullish move. ⬆️💰
Stop-Loss: Set a stop-loss order below the lower trendline to manage risk and protect against potential downside. ⛔️📉
Target Levels: Identify potential resistance levels or previous swing highs as profit targets. Adjust your position size and take profits accordingly. 🎯📈
Risk Management:
Remember to implement proper risk management techniques, including position sizing, stop-loss orders, and adherence to your trading plan. It is crucial to carefully manage your risk exposure while trading $TWT or any other cryptocurrency. ⚠️💼💡
Disclaimer: Trading cryptocurrencies carries risks, and it is important to conduct your own analysis and seek professional advice before making any investment decisions.
#FallingWedge #TWT #Cryptocurrency #BullishReversal #TradingStrategy #TechnicalAnalysis #ProfitTargets #RiskManagement
In conclusion, the falling wedge pattern identified on $TWT indicates the potential for a bullish reversal. However, exercise caution and wait for a confirmed breakout before making any trading decisions. Stay tuned for further updates on $TWT! 🚀📊
(Note: This post is for informational purposes only and should not be considered as financial advice.) 💡💼📚

Bullish Reversal on DRIP/BUSD: Falling Wedge Pattern UnveiledGreetings, Traders! Today, I want to share an exciting technical analysis finding on the trading pair of DRIP (the DeFi protocol) and Binance USD (BUSD). A falling wedge pattern has been identified, indicating the potential for a bullish reversal in the near future. Let's delve into the details!
📈 Trading Pair: DRIP/BUSD
📅 Timeframe: Daily Chart
📊 Pattern: Falling Wedge
📉 Understanding the Falling Wedge Pattern:
A falling wedge is a bullish chart pattern characterized by converging trendlines that slope downward. Typically formed during a downtrend, it suggests diminishing selling pressure and the potential for a reversal. This pattern indicates the possibility of an upward price movement.
🔍 Identifying the Falling Wedge on DRIP/BUSD:
Upon analyzing the daily chart of DRIP/BUSD, the following observations come to light:
1️⃣ Recent downtrend: The trading pair has experienced a decline in price over the past weeks.
2️⃣ Converging trendlines: The upper trendline connects the lower highs, while the lower trendline connects the lower lows.
3️⃣ Decreasing trading volume: As the falling wedge pattern forms, the trading volume has been declining, indicating a potential reduction in selling pressure.
📈 Price Targets and Trading Strategy:
If the falling wedge pattern on DRIP/BUSD plays out as anticipated, a potential bullish breakout above the upper trendline may occur, leading to a reversal and potential price appreciation. Consider the following price targets:
1️⃣ Target 1: Resistance level near $40.00
2️⃣ Target 2: Psychological resistance near $50.00
🛡️ Risk Management:
Managing risk is essential for successful trading. Implement the following risk management techniques:
1️⃣ Set a stop-loss order below the lower trendline to protect against unexpected price movements.
2️⃣ Adjust position size based on your risk tolerance and overall portfolio management strategy.
🔔 Conclusion:
Keep a close eye on the DRIP/BUSD trading pair as it develops this falling wedge pattern. The pattern suggests the potential for a bullish reversal on the horizon. However, please note that technical analysis is not infallible, and market conditions can change rapidly. Combine this analysis with other relevant factors before making any trading decisions.
Disclaimer: This post is for informational purposes only and should not be considered as financial advice. Always conduct your own research and consult with a qualified financial professional before making any investment decisions.
Happy Trading! 📈💰
#tradingview #technicalanalysis #fallingwedgepattern #DRIP #BUSD #DeFi #cryptotrading #chartpatterns #bullishreversal #tradingstrategies #investing #finance #marketanalysis

Bullish Potential on $PYPL: Falling Wedge Pattern Greetings, Traders! Today, I'm excited to share an intriguing technical analysis discovery on the stock of PayPal Holdings Inc. ( NASDAQ:PYPL ). A falling wedge pattern has been identified, indicating the potential for a bullish reversal in the near future. Let's dive into the details!
📈 Ticker: NASDAQ:PYPL
📅 Timeframe: Daily Chart
📊 Pattern: Falling Wedge
📉 Understanding the Falling Wedge Pattern:
A falling wedge is a bullish chart pattern characterized by converging trendlines that slope downward. Typically formed during a downtrend, it suggests diminishing selling pressure and the potential for a reversal. This pattern indicates the possibility of an upward price movement.
🔍 Identifying the Falling Wedge on NASDAQ:PYPL :
Upon analyzing the daily chart of NASDAQ:PYPL , the following observations come to light:
1️⃣ Recent downtrend: NASDAQ:PYPL has experienced a decline in price over the past weeks.
2️⃣ Converging trendlines: The upper trendline connects the lower highs, while the lower trendline connects the lower lows.
3️⃣ Decreasing trading volume: As the falling wedge pattern forms, the trading volume has been declining, indicating a potential reduction in selling pressure.
📈 Price Targets and Trading Strategy:
If the falling wedge pattern on NASDAQ:PYPL plays out as anticipated, a potential bullish breakout above the upper trendline may occur, signaling a reversal and potential price appreciation. Consider the following price targets:
1️⃣ Target 1: Resistance level near $320.00
2️⃣ Target 2: Psychological resistance near $340.00
🛡️ Risk Management:
Implement the following risk management techniques to protect your capital and manage risk effectively:
1️⃣ Set a stop-loss order below the lower trendline to safeguard against unexpected price reversals.
2️⃣ Adjust position size based on your risk tolerance and overall portfolio management strategy.
🔔 Conclusion:
PayPal Holdings Inc. ( NASDAQ:PYPL ) is exhibiting a falling wedge pattern, suggesting the potential for a bullish reversal in the near future. However, please remember that technical analysis has limitations, and market conditions can change. Incorporate additional analysis and fundamental factors before making any trading decisions.
Disclaimer: This post is for informational purposes only and should not be considered as financial advice. Always conduct your own research and consult with a qualified financial professional before making any investment decisions.
Happy Trading! 📈💰
#TradingViewAnalysis #TechnicalAnalysis #FallingWedgePattern #BullishReversal #PYPLStock #StockMarketAnalysis #ChartPatterns #TradingSignals #InvestSmart #FinancialMarkets #MarketAnalysis

Falling Wedge Pattern on $BLNK: Potential Bullish Reversal Greetings, Traders! Today, I'm thrilled to share an exciting technical analysis finding on the stock of Blink Charging Co. ( NASDAQ:BLNK ). A falling wedge pattern has been identified, suggesting the potential for a bullish reversal in the near future. Let's dive into the details!
📈 Ticker: NASDAQ:BLNK
📅 Timeframe: Daily Chart
📊 Pattern: Falling Wedge
📉 Understanding the Falling Wedge Pattern:
A falling wedge is a bullish chart pattern characterized by converging trendlines that slope downward. Typically formed during a downtrend, it indicates diminishing selling pressure and the potential for a reversal. This pattern suggests the possibility of an upward price movement.
🔍 Identifying the Falling Wedge on NASDAQ:BLNK :
Upon analyzing the daily chart of NASDAQ:BLNK , the following observations come to light:
1️⃣ Recent downtrend: NASDAQ:BLNK has experienced a decline in price over the past weeks.
2️⃣ Converging trendlines: The upper trendline connects the lower highs, while the lower trendline connects the lower lows.
3️⃣ Decreasing trading volume: As the falling wedge pattern forms, the trading volume has been declining, indicating a potential reduction in selling pressure.
📈 Price Targets and Trading Strategy:
If the falling wedge pattern on NASDAQ:BLNK plays out as anticipated, a potential bullish breakout above the upper trendline may occur, leading to a reversal and potential price appreciation. Consider the following price targets:
1️⃣ Target 1: Resistance level near $40.00
2️⃣ Target 2: Psychological resistance near $45.00
🛡️ Risk Management:
Effective risk management is crucial for successful trading. Implement the following risk management techniques:
1️⃣ Set a stop-loss order below the lower trendline to protect against unexpected price movements.
2️⃣ Adjust position size based on your risk tolerance and overall portfolio management strategy.
🔔 Conclusion:
Keep a close watch on Blink Charging Co. ( NASDAQ:BLNK ) as it develops this falling wedge pattern. The pattern suggests the potential for a bullish reversal in the near future. However, please note that technical analysis is not infallible, and market conditions can change rapidly. It's advisable to incorporate additional analysis and fundamental factors before making any trading decisions.
Disclaimer: This post is for informational purposes only and should not be considered as financial advice. Always conduct your own research and consult with a qualified financial professional before making any investment decisions.
Happy Trading! 📈💰
#tradingview #technicalanalysis #fallingwedge #bullishreversal #blnk #stockanalysis #chartpatterns #tradingstrategies #investing #finance #marketanalysis

Falling Wedge Pattern Spotted on $NIOPotential Bullish Reversal: Falling Wedge Pattern Spotted on NYSE:NIO
Greetings, fellow traders! Today, I bring your attention to an exciting technical pattern that has emerged on the stock of NIO Inc. ( NYSE:NIO ). A falling wedge pattern is forming, indicating a potential bullish reversal on the horizon. Let's delve into the details!
📈 Ticker: NYSE:NIO
📅 Timeframe: Daily Chart
📊 Pattern: Falling Wedge
📉 Understanding the Falling Wedge Pattern:
A falling wedge is a bullish chart pattern characterized by converging trendlines that slope downward. It typically occurs during a downtrend and signifies a potential reversal. This pattern suggests a decrease in selling pressure, with buyers potentially taking control and driving the price higher.
🔍 Identifying the Falling Wedge on NYSE:NIO :
Upon analyzing the daily chart of NYSE:NIO , the following observations come to light:
1️⃣ The stock has experienced a recent downtrend, with lower highs and lower lows.
2️⃣ Two converging trendlines can be drawn, with the upper trendline connecting the lower highs and the lower trendline connecting the lower lows.
3️⃣ Decreasing trading volume as the pattern unfolds, indicating a potential decline in selling pressure.
📈 Price Targets and Potential Trading Strategy:
Should the falling wedge pattern on NYSE:NIO play out as expected, a bullish breakout above the upper trendline could trigger a reversal and potential upward movement. Consider the following price targets:
1️⃣ Target 1: Resistance level near $50.00
2️⃣ Target 2: Psychological resistance near $55.00
🛡️ Risk Management:
Proper risk management is crucial when implementing any trading strategy. Employ the following risk management techniques:
1️⃣ Set a stop-loss order below the lower trendline to protect against unforeseen price fluctuations.
2️⃣ Adjust position size in accordance with your risk tolerance and overall portfolio management strategy.
🔔 Conclusion:
Keep a close eye on NIO Inc. ( NYSE:NIO ) as it continues to develop this falling wedge pattern. The formation suggests a potential bullish reversal in the near future. However, bear in mind that technical analysis has its limitations, and market conditions can swiftly change. Consider integrating this analysis with other pertinent factors before making trading decisions.
Disclaimer: This post serves for informational purposes only and should not be construed as financial advice. Always conduct your own research and consult a qualified financial professional before making investment decisions.
Happy Trading! 📈💰
#TechnicalAnalysis #FallingWedgePattern #NIO #BullishReversal #TradingView

USDCAD I Bullish CAD News but in the rangeWelcome back! Let me know your thoughts in the comments!
** USDCAD Analysis - Listen to video!
We recommend that you keep this pair on your watchlist and enter when the entry criteria of your strategy is met.
Please support this idea with a LIKE and COMMENT if you find it useful and Click "Follow" on our profile if you'd like these trade ideas delivered straight to your email in the future.
Thanks for your continued support!

US30 FALLING WEDGE, BIG MOVE 🚀🚀🚀Hey traders,
US30 has reached a demand zone, there is a big falling wedge pattern that has been forming, on the daily and weekly timeframes US30 is on an uptrend. Keep an eye on the bulls they are on their way to take over.
If you enjoy my analysis drop a like and comment down below👇.

NIO breakout from descending wedge NIO is shown on a 4H chart. It has been downtrending for 3 months. Howver, April and May
has high relative volume trying to reach the capitulation of a bottom. Thursday May 4th
marked a near term bottom. NIO is now rising and breaking out of a falling wedge drawn onto
the chart. It has crossed over the POC line of the volume profile ( This is the price level of
the highest volume of trading). Price is impending a mean anchored VWAP. Relative strength
has spiked. With this confluence of bullish signals, I have taken a long position which has
appreciated 4.6% in the first half of the trading day having opened the position in the pre-
market. I will now take a trade of call options striking $ 7.00 DTE 7/21. The rising dollar
strength has confounded TSLA's sales in China and the Nordic countries. NIO is on the ready to
pick up the slack.

US30 FALLING WEDGE BREAK OUT 🚀🚀🚀Hey traders,
US30 is just breaking out of the falling wedge pattern which kept narrowing & narrowing until price finally mitigating making the chart balanced⚖️ A big move is on the way don't miss this opportunity as this could potentially make you a bag 💰.
If you enjoy my analysis drop a like and comment down below 😘.

NAS100 FALLING WEDGE PATTERN BREAKKOUT!Hey traders,
Nas has just broken out of the falling wedge to the downside 12500 could be a possible target.
Cheers!

BTCUSD | Wave Projection 123 | Classic Reversal Move CUP&HOLDERBTC classic reversal move > Inverted head & shoulders turning into cup&holders
Target cup&holder at the same level of previous mega falling wedge
Possible a bull flag move forming holder pattern at 0.5 fibo retracement zone
SHORT ENTRY NOW! and Long at bull flag confirmation pattern breakout TP +70%

ATOM/USDT - SCALPING SHORT!analysis timeframe: 1d.4h.1h.
looking bearish from 11.400$.
target will be 10.800$.
stoploss 11.572$.
- falling wedge
- harmonics
- spread volume analysis
- support/resistance
- rsi
- channel
- short setup

US30 FALLING WEDGE PATTERN!Hello traders!
US30 is approaching the upper diagonal trendline, the move could be huge. Lets wait and attack! 🚀🚀🚀

NAS100 FALLING WEDGE PATTERNHey traders!
Nas has formed a clear falling wedge pattern, though the pair is on downward trend there is a divergence signaling a trend of change. Therefore, shortterm i see nas climbing some good pips.

JASMYUSDT wants the bounce?JASMYUSDT is forming a falling wedge pattern on the 0.005 support area, which could potentially provide a bullish signal for traders.
A falling wedge is a chart pattern that occurs when the price of an asset forms a series of lower highs and lower lows, but the range between the highs and lows narrows over time. This creates a wedge-like shape on the chart, and is typically seen as a bullish reversal pattern.
In the case of JASMYUSDT, the falling wedge is forming on the 0.005 support area, which means that the price has been consistently testing this level but has not been able to break below it. This could indicate that there is strong buying pressure at this level, and that traders are looking to enter the market.
For a potential bullish breakout to occur, the price of JASMYUSDT needs to create a breakout from the 0.006 resistance level, which has previously acted as a key level of resistance. If the price manages to break above this level and confirm it as a new support level, this could provide a strong bullish signal for traders.
According to Plancton's rules, a set of technical analysis rules used by traders, a breakout from the falling wedge pattern combined with a confirmed breakout above the 0.006 resistance level could indicate a new long position for traders.
–––––
Follow the Shrimp 🦐
Keep in mind.
🟣 Purple structure -> Monthly structure.
🔴 Red structure -> Weekly structure.
🔵 Blue structure -> Daily structure.
🟡 Yellow structure -> 4h structure.
⚫️ Black structure -> <= 1h structure.
Follow the Shrimp 🦐

Bitcoin at Falling Wedge Pattern As per #Bitcoin 1 Day #TA
Bitcoin weekly chart Still moving under #Bearish #Descending Triangle Pattern, while as per 1 Day analysis, from last 25 days moves under Falling Wedge Pattern, its last cut-off point is $21k on 11-12 March, after that some chances to be Retest again for $25k, but maximum chances to break next Divergence of $19.5k-$18.5k.
March to June is #Bearish struggling zones for BTC

3-1 Falling Wedge Reversal? Or Continuation Pattern?Watching where we are currently which is following a definition of a falling wedge reversal pattern. Have an exciting day! Continuation? Or Reversal on the Hour.
