DODOUSDT wants to go higher?DODOUSDT has recently experienced a massive breakout from a falling wedge pattern.
The falling wedge is a technical chart pattern that occurs when the price of an asset is in a downtrend and begins to consolidate within a narrowing range, forming a wedge shape. This pattern typically signals that a bullish reversal is imminent, as the price is likely to break out from the wedge pattern and continue higher.
In the case of DODOUSDT, the price broke out from the falling wedge pattern in the $0.1 area and experienced a massive bullish impulse.
This breakout was likely driven by increased demand for it, as well as positive news or developments within the DODO ecosystem.
However, in order for the price to continue its upward trend, it will need to create a new breakout from the daily resistance level. This may require a period of consolidation or even a retracement, as traders take profits and reassess their positions. According to Plancton's rules, this could present a buying opportunity for long-term investors who believe in the potential of DODO USDT.
–––––
Follow the Shrimp 🦐
Keep in mind.
🟣 Purple structure -> Monthly structure.
🔴 Red structure -> Weekly structure.
🔵 Blue structure -> Daily structure.
🟡 Yellow structure -> 4h structure.
⚫️ Black structure -> <= 1h structure.
Follow the Shrimp 🦐
Fallingwedgepattern

Falling wedge pattern on SAVA A falling wedge pattern seems to be forming the daily chart. Waiting for confirmation for entry.

ITEL | Elliott Wave Projection | Falling Wedge BreakoutPrice action and chart pattern trading
> Elliott wave downtrend falling wedge breakout
> Inverse head & shoulders reversal pattern with breakout
> Entry @ pullback B-wave retraced near neckline zone
> Target @ 0.386 retracement of (A) wave - volume profile point of control zone
> Stoploss @ the lowest head position -10% downside
> Risk reward ratio: 2:1
Always trade with affordable risk and respect your stoploss

1H Analysis on NZDJPYHello traders. On this 1H analysis of NZDJPY, we have a falling wedge setup with a support level within the buy zone identified. There is good rejection from the support level and this area would be a good entry point for a long position. A good place where price may go next would be to the resistance level in the 83.800 region. A SL should be appropriately placed below the buy zone identified.

Is the EUR/USD poised for a 2023 bull run?This is a Quarterly chart of the EUR/USD and it's something I'm keeping an eye on. What appears to be a falling wedge and MACD bullish divergence developing. Could we see another Euro 1.2200 again in 2023?
Will keep watching the price action going forward on Bullish momentum. The first hurdle will be 1.1100.

1120: Al Rajhi (Bullish setup)Falling Wedge Pattern
Watchout for Breakout
Retracement from Golden Pocket considering Rally from Covid-19 and retracement
HH, HL formation until top of falling wedge Resistance
Bulls need to take control for further ride and breakout
Entry at current level (Aggressive) or Watch for Breakout
Stop Loss is specified
Fib/Horizontal support Levels are specified for TPs
Ride the trend and Trail your stop loss
Manage your risk properly

2010: SABIC (Falling Wedge Breakout)Falling Wedge Breakout Observed
Short term and long term Bullish setup is available
HH, HL formation
Wait for HL formation for Entry or at current level
Stop Loss is specified
Same setup for new entry if reach SL
Fib/Horizontal support Levels are specified for TPs
Ride the trend and Trail your stop loss
Manage your risk properly

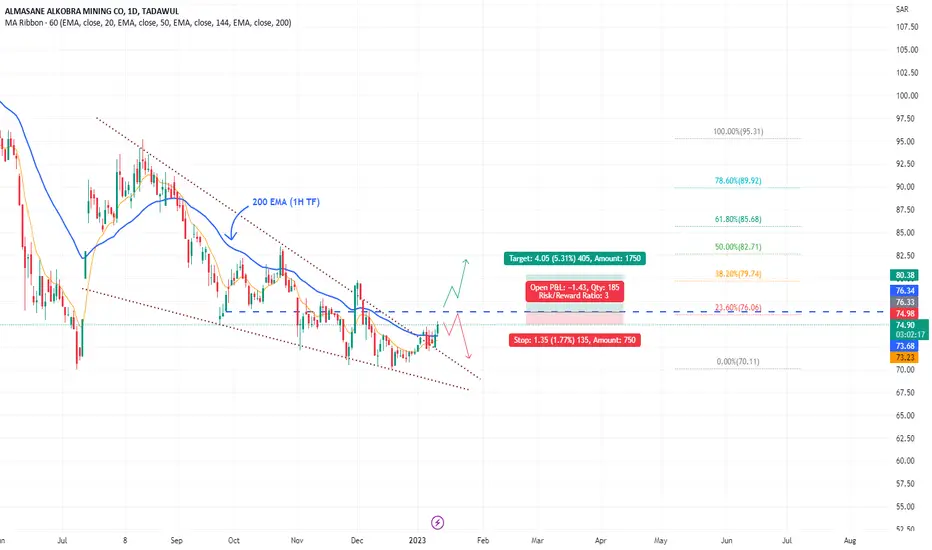
1322: AlKobra Mining (Falling Wedge; Watch for Breakout)Price within Falling Wedge
Breakout observed crossing top of falling wedge (resistance)
Formation of HH, HL
Support from 200EMA (1H TF); Imposed on Daily Chart
Entry at current level (Aggressive)
Watch for breakout of Horizontal support (Conservative Entry)
Trade with stop Loss (Risk:Reward Ratio)
Fib Levels are specified for TPs
MCDOWELLMCDowell broke out of falling trend line on 30 min TF with good volumes.
Could be bought with mentioned stoploss & target.

Bitcoin 2W falling wedge Pattern Breakout soon 30KBitcoin 2W falling wedge Pattern Breakout soon 30K

PfizerFalling Wedge Pattern Breakout; Retest in progress (wait for HL formation)
Formation of HH and HL (Dow Theory; Bullish trend)
Support from 61% fib retracement
Entry after formation of HL (50.5)
Trade with specified Stop Loss
TP levels are specified
Ride the trend with trailing stop Loss
Manage your risk accordingly

Johnson & JohnsonFalling Wedge Pattern Breakout and Retest
Formation of HH and HL
Support from 61% fib retracement
Entry after formation of HL (176.34)
Trade with specified Stop Loss
TP levels are specified
Ride the trend with trailing stop Loss
Manage your risk accordingly

GrasimGrasim made falling wedge pattern & it broke & susatinig above it comfortably with good volumes.
Could be bought with mentioned stoploss & target.

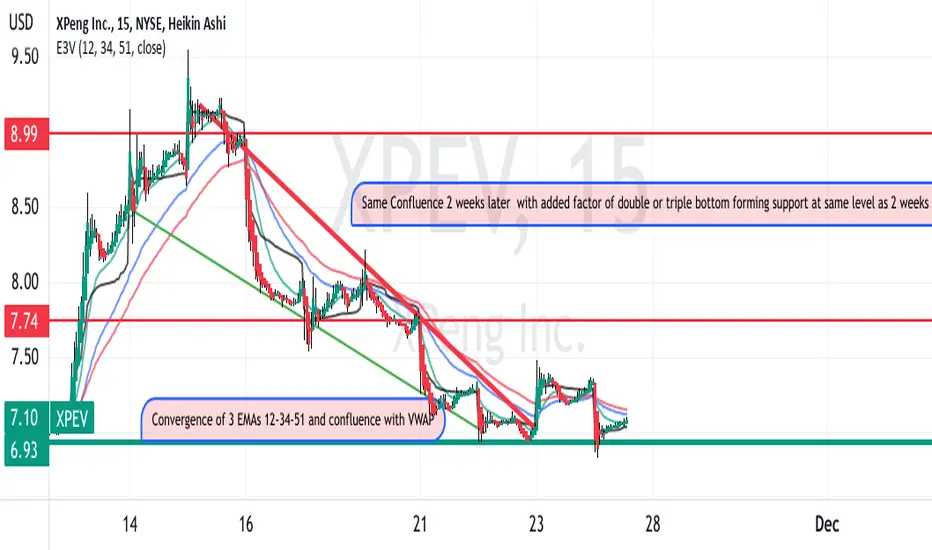
XPEV is forming a reversal pattern perhaps following TSLAXPEV is presently finishing out a falling wedge pattern.
As shown on the 30-minute chart, exponential moving averages
are falling and converging in the narrow area where VWAP
is trending. At lower time frames a "Golden Cross pattern"
A stop loss can be set under the double or triple bottom
with a target being the 1/2 of the way to swing high about 10% higher
based on a routine retracement. This seems to be a quality
swing long setup based on a breakout of a falling wedge
and a confluence of moving averaged and anchored VWAP
I took some call options with a strike of $ 8 and an expiration
on 12/16 while expecting over 100 % profit.
SMRA Falling WedgeSMRA . W1. Falling wedge pattern.
SL 540
TP1 720
TP2 800
TP3 985
⚠️ Manage your expectation to set your entry. The SL is 11% from the last closing price (615).
⚠️ See detail in my previous post (SMRA in daily timeframe).
IDX:SMRA
DYOR.
Disclaimer On.

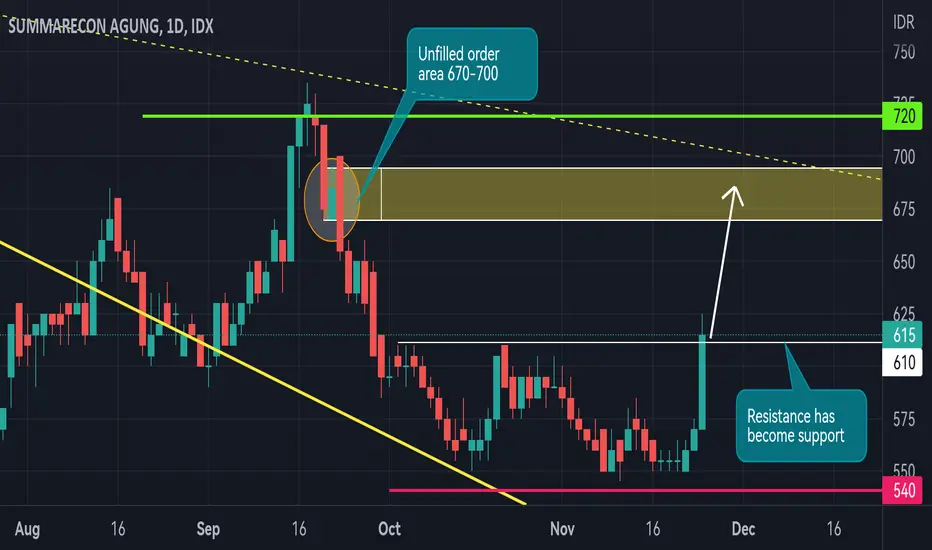
SMRA Falling WedgeSMRA . D1. Falling wedge pattern.
SL 540. Manage your expectation, because the SL is 11%.
SMRA had broke the resistance. Then the resistance has become support. So it potential to go to unfilled order area (level 670-700).
My personally set the entry at 590, 610, 615 (layering). And if it closed under the support (610) I will exit, even though in theory the SL is at 540.
Mind your money management. IDX:SMRA
Bullish Falling Wedge And RSI Divergence WeeklyThis Is an updated chart of my previously published idea on FRONTUSD Token.
Once breakout confirmed target is previous all time high close of around $4.40.
Looks like a nice pattern. What do you think? is this a bullish falling wedge?
Possible entry could be on confirmation of bullish weekly candle that will
complete 21 November 2022. Could also wait for upper trendline resistance
breakout around $0.30.


PRINCR PIES, RSI SUPPORTmy support got supported by today's price action.
already that support was previously was supported to times.
this was a bear trap. and now the stock is ready to give a range breakout!
have a look at the increasing volume too.
RSI IS SHOWING A FALLING WEDGE PATTERN!
great time to enter!!

JPM with Bullish Divergence on Weekly Chart!J.P. Morgan Chase NYSE:JPM has bullish divergence in confluence with a falling wedge pattern!
-Bullish divergence was identified on the weekly chart.
-The falling wedge was identified on the daily chart.
Bias-Bullish
Peace, Love & Abundance,
MrALtrades00

GOOGL | Wave Projection | A-wave Correction Bullish DivergencePrice action and chart pattern trading setup:
> A possible A-wave correction zone at 0.618 fib retracement from previous 5-wave uptrend as well as the head & shoulders target with a bullish divergence RSI indicator in weekly timeframe which is showing a strong reversal signal.
> In daily timeframe, the price breakout SMA20 with a small double bottom pattern and MACD golden cross signal line just below zero and now consolidating at upper key level resistance.
> If breakout, the upside is opened to a possible B-wave ABC uptrend with a target 0.5 - 0.618 retracement between +20 - 25% with its double bottom downside -7%, estimated risk reward ratio at 2.5:1
Good Luck
Always trade with affordable risk and respect your stoploss, nothing is 100%.

Bottom of this Bear Market - Dump Before a Mega Pump Bitcoin is breaking out of the falling wedge and breaking the resistance line it has never broken from its all-time high. In my view, this is a fakeout and we will see a correction to 12k where we have two support lines to give us a mega bounce and that will be the bottom of this bear market. Let me know your thoughts on all this.
