EURCAD LONGEURCAD reached a key level last week and has currently formed a falling wedge.we are expecting a bouncend bulls to takeover .we are going long on this one with TARGET@ 1.48273
STOPS BELOW 1.43073
LIKE ,SHARE LET ME KNOW WHAT YOU THINK
Fallingwedgepattern

AMC Possible Bullish HammerToday AMC experienced a volatile strong start all the way to $41.94 which was near my .618 resistance although I was wrong because I thought perhaps $41.10 was more of the resistance. And then dip harshly today. Even so today AMC played my falling wedge. Now with today price action $AMC broke down the bull liquidity zone of $39 to $38.82 in the last 30 minuts but was quickly recover in the last 15 minutes and closing at $39.23. Interesting I notice a bullish hammer today closing of the the 30 min chart at $39.23 similar to the closing red candle that close at $39.15. What I expect tomorrow is a strong reversing. Otherwise any more lower dips either cause a falling wedge extension or I have to readjust. I will adjust if any changes occur.

AMC: Falling Wedge: A New Higher Low:We saw a symmetrical triangle as one of the possibility it will form. I did notify about a bearish divergence. As I expected it retrace back around $41 today. In the last 1.5 hours I was giving a glimpse of dipping red price. Is this the first sign of a falling wedge?
What I expect this week? I expect a volatile week trapping both bulls and bears. What I want to see is the price goes back to $42 trapping the bulls and then smacking down. This will confirm a falling wedge. If not it will go much higher. So if a falling wedge is to be form this and next week in the 30 min chart. I expect the new higher low to be $38 trapping the bears. Beyond that I am bullish. Anything below $37 will break this pattern.

Head And Shoulders plus Falling WedgeThere seems to be a couple of clear patterns that compliment each other. Both a head and shoulders and falling wedge, Once the falling wedge is broken clearly with confirmation i expect we will complete the right shoulder of the pattern. Neck has already been confirmed at 1689. Expecting a minimum of around 1900-1950 for the peak of the right shoulder before returning to 1689.
Maybe more useful for short-medium term traders but even if you're a day trader its always good to know which was the wind is blowing.
Remember, always DYOR. Trade Safe.

Falling Wedge is in Control of FET/BTC #FET $FET Here you can clearly see we are in a Falling Wedge - but this will break Bullish because it's part of a Bullish continuation in an uptrend on our FET daily chart . We are very near the end of this wedge structure and will be breaking upwards from it . Notice there is very low volume now near the end of this wedge - that is actually confirmation of our wedge . A big volume burst should happen on breakout - and it's very possible there will be retest of that line after breakout . But then we should continue back up at least to the previous recent highs - and beyond . By the end of October this should be going up again.
Of course our previous triangle structure got invalidated - that happens sometimes - but this Wedge seems valid and I believe this will play .

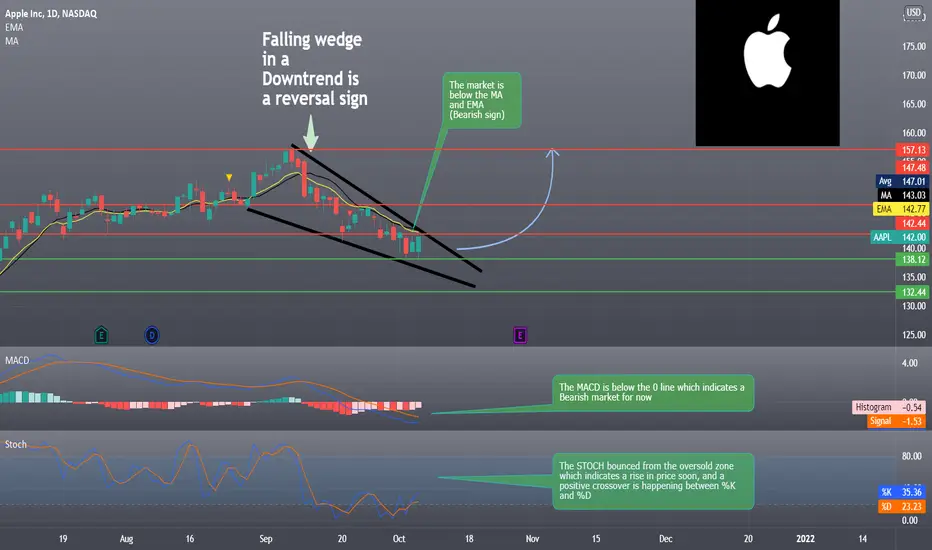
Apple Reversal sign, Falling Wedge Hello everyone, as we all know the market action discounts everything :)
_________________________________Make sure to Like and Follow if you like the idea_________________________________
The Apple stock turned Bearish back on September 8, The value of the stock was in the 157.13 zone and dropped and hit 138.40 yesterday almost a 12% drop in a short period of time.
AAPL has an average volume of 77287300. This is a good sign as it is always nice to have a liquid stock.
It seems that the stock is trading in a Falling wedge pattern which indicates a reversal soon, (Falling wedge in a downtrend is a sign of a Bullish reversal)
the stock right now is trading at 142.00 with different technical indicators showing a bearish short-term trend but a Bullish long-term trend, It is expected that the market will turn Bullish as soon as the market breakout of the falling wedge pattern.
Possible Scenario for the market :
The stock is trending at 142.00 today, if the bearish trend continues then we will see the stock price reach the $138 level or even the $132 before breaking out of the wedge pattern, where the trend will pick up and start moving back up to the $157 zone.
Technical indicators show :
1) The market is below the 5 10 20 50 MA and EMA but still above the 100 and 200 which indicates a Bearish short-term trend but Bullish long-term trend.
2) The MACD is below the 0 line which indicates a Bearish market for now, With a negative crossover between the MACD line and the Signal line.
3) The STOCH bounced from the oversold zone which indicates a rise in price soon, and a positive crossover is happening between %K and %D.
Weekly Support & Resistance points :
support Resistance
1) 139.18 1) 146.03
2) 135.72 2) 149.42
3) 132.33 3) 152.88
Fundamental point of view :
AAPL's Return On Assets of 26.32% is amongst the best returns of the industry. AAPL outperforms 96% of its industry peers. The industry average Return On Assets is 1.78% and the stock Profit Margin of 25.00% is amongst the best returns of the industry. AAPL outperforms 96% of its industry peers. The industry average Profit Margin is 3.14%.
It's always good to know that the Altman-Z score of 7.43 indicates shows that AAPL is not in any danger of bankruptcy at the moment.
Apple stock weighs around 6.1% in the S&P 500 index, so it is important for the whole broad stock market picture. Since early September it has been declining from the record high. Recently, the stock broke below the support level of around $142, marked by the previous local lows. The $142 price level is acting as a resistance level right now.
This is my personal opinion done with technical analysis of the market price and research online from Fundamental Analysts and News for The Fundamental point of view, not financial advice.
If you have any questions please ask and have a great day !!
SLP/USDT TRADE SETUP!Hello everyone, Welcome to this altcoin trade setup. If you didn't follow me yet then hit the follow button now for more latest updates and profitable altcoins setups.
Let's get to the chart. SLP is breaking out from the big falling wedge channel and currently facing some resistance. If you want to buy SLP then I"ll recommend not to buy here because it's already 20-30% up. Wait for a little pullback then you can buy some.
Best entry range:- $0.06-$0.08
Target1:- $0.12
Target2:- $0.18
Target3:- $0.27
SL:- $0.54
If you like this idea then hit the like button and also share your views in the comments section.
This isn't financial advice. DYOR before investing.
Thank you!

What are Falling and Rising Wedge Patterns?What Is the Wedge Pattern and Its Common Characteristics?
1. Wedge patterns have converging trend lines that come to an apex with a distinguishable upside or downside slant.
a. Wedge with an upside slant is called a rising wedge
b. Wedge with downside slant is called falling wedge
2. It has declining volumes as the pattern progresses.
3. It breaks out from one of the trend lines.
Why We Should Pay Attention to Wedge Patterns?
Some studies suggest that a wedge pattern will breakout towards a reversal rather than a continuation more often than two-thirds of the time. Therefore as the rule of thumb, people generally treat a falling wedge as a bullish pattern and a rising wedge as a bearish pattern, especially a falling wedge would be a more reliable reversal indicator than a rising wedge.
Since we know a wedge pattern has a higher probability to reverse and due to the fact that the price of wedge pattern converges to a smaller area, we can trade the reversal set up with a relatively close stop loss to its entry price, which provides us with a good trading opportunity with a decent Risk:Reward ratio.
Examples of a Bullish Rising Wedge and Bearish Falling Wedge.
Sadly, there is nothing that works 100% in trading. Not every rising or falling wedge will reverse as one might expect. Every trader must properly manage their risk by setting stop losses and not just trading based on price patterns. Below are two examples.
Bullish Rising Wedge (ETHUSDT during 15/NOV/20 - 28/DEC/20)
In the early stages of the epic 20-21 bull market, if traders blindly treat the rising wedge as a bearish signal and trade accordingly, they would pay a heavy price.
Bearish Falling Wedge (LTCUSD during 14/AUG/18 - 14/NOV/18)
On the contrary, in the late stage of the 2018 bear market, any trader who blindly trades the falling wedge to bet on a reversal would also learn a hard lesson.
Comment down your thoughts on Ascending Triangle Pattern in the comment section.
Disclaimer:
This is just an educational post. Never trade just any pattern. And please do your research before making any trades.
Happy Trading!

MATIC/USDTMATIC/USDT
Another Cup and handle setup
Buy the break out of the falling wedge.
Always depended on BTC to coorperate.
Targets on chart.
Scale in.
Scale out.

$VISLNo changes to the price of Vislink Technologies Inc. stock on the last weeks trading day (Friday, 24th Sep 2021).
During the day the stock fluctuated 7.41% from a day low at $1.89 to a day high of $2.03.
The price has risen in 4 of the last 10 days, but is still down by -3.02% for this period.
The stock is currently coming towards the end of its falling wedge so it might be a good time to keep your eyes on this one for a possible run.
MACD looks like it’s ready to curl
RSI flat.
Wait for confirmation.
Keep this on your watchlist.
- Factor Four

ETHEREUM/USDTThe chart is based on the 4h time frame of ETH. My take on ETH :
Initiate a position and buy break out, if the price breaks above the upper line of the falling wedge.
Take profit level:
Target 1 - 3320$
Target 2 - 3475$
Target 3 - 3690$
Target 4 - 3970$
Questions, comments, likes, and follows are greatly appreciated.
Trade at your own risk!

$CHPTEven with the electric vehicle revolution in full swing, not everyone sees the bull thesis for ChargePoint.
Indeed, CHPT stock was cut in half from the the beginning of 2021 to mid-September, so clearly investor sentiment is at a low point.
This could present an opportunity for folks with a tolerance for volatility. After all, the essence of contrarian investing is to get excited when others are fearful.
There’s something about the $20 price point — it’s like a magnet for CHPT stock in 2021.
Without a doubt, it’s probably frustrating for the long-term stockholders.
As you may recall, ChargePoint shares propelled as high as $44.50 in January of this year.
The sentiment was riding high, but it wasn’t the best time to take a long position. CHPT stock slipped to $20 in March.
Believe it or not, the stock rose and fell back to that same $20 level in April, and then again in May, and once more in August. As of Sept. 23, it was back to $20 and change yet again.
At least we can say there’s strong support at that level.
When we look at the chart you can see price has been stuck in a fall wedge foe quite sometime now.
As it comes to the end of it’s pattern and sits right at long term support it might be something you want to keep your eyes on for a break to the upside.
Along with that, you also have the MACD flat.
RSI below 50.
I suggest keeping this on your watchlist.
- Factor Four

Bull case BTCBull case BTC. Falling wedge. We breakout around October 14th 2021, and we head for around 53K. During these next few weeks, scalping the top and bottoms of the falling wedge is key to success. We drop to around 37-38K then bounce upward to 53K

BTC massive falling wedgeHi all.
Today we have a huge red candle for BTC and even bigger ones for the rest of the crypto;
Not everyone is bullish but whenever this happens I try to zoom out and see the broader picture.
I see a huge falling and condensing wedge is forming on the 1-D chart which if remains valid has the price targets into mid 50k!
The bottom of this wedge also coincides with an important Fib level and previous support near 41 k.
BTC should hold the support areas I've shown for this pattern to remain valid. I think we will complete this pattern by mid-October.
Historically September has been a slumpy month for BTC, but long-term forecasts predict better days for BTC for Q4 2021 which also supports my idea. Please share your thoughts with me on this one.
Thank you for your likes and comments in advance

RSR in a falling wedgeRSR seems to be forming a falling wedge and according with Fib retracement we're on a potential reversal level, however we're also close to a resistance around 0.04USDT (not shown here not to mess up the chart) and we're currently below ichimoky cloud and EMA 200. Basically we need a volume to increase to push price over such resistance zone.
RSR could go another 2 bounces inside the wedge before breaking upward, should this be the case I expect price to orbitate a little bit below 0.618 but not to touch 0.786. If buy volume spikes I think we can break at the next touch of the wedge's upper resistance.
If you wanna enter do it now and set a stop loss at 0.033USDT from current price (0.037 at the time I'm writing). You can also use a lower SL if you want, I think this is due to another pump which, eventually will take it over 0.1USDT.
Overall it's a good buy, even to hold for mid and long term.
Good luck

SOL is looking Bullish#Sol is about to Dhoom Again
Currently formed a #Falling wedge in 2HR TF.
Keep eyes on it.

Possible 55% chance with Fonar (Fonr)Hello guys :)
As you can see we broke out of this beautiful falling wedge. Fonar could retest the black support again and then reach milestones like 20,00$ and 26,00$. Therefore I am waiting for a confirmation retest or outbreak.
Do your own research :
NOT FINANCIAL ADVICE/RECOMMENDATION


SMBR Breakout Falling Wedge - IHSGPrice has closed above the falling wedge upper resistance. Putting a trading plan in motion.
Disclaimer: This content is intended to be used and must be used for information and education purposes only. It is very important to do your own analysis before making any investment based on your own personal circumstances. Accordingly, the writer will not be liable in respect of any damage, expense, or other loss you may suffer arising out of such information or any reliance you may place upon such information.

$AMCPrice broke out of falling wedge last week.
We could be simply seeing a retest before a continuation up.
Price closed on a bullish hammer on Friday.
MACD curling & RSI about to go above 50.
Keep this on your watchlist.
- Factor Four


Wil DEFI rise again?DEFI INDEXES showing continuation potential here.
Falling wedge pattern awaits breakout and volume confirmation.
###NOT FINANCIAL ADVICE###
