False break above key resistance in major downtrendWe might be seing a transition from the bearish into a new bull trend long term. Buyers managed to push through resistance around 0,68800 but the selling back below the level was pretty strong so this might be a false break.
If the buyers really were in control they should have managed to keep price above this level.
IF and only if we get a weak pullback into the level I would be open for a potential false break setup and short trade. Since the structure is indicating a transition, first target should be kept fairly close (0.65000) in case we see new buying strength coming in around that area if there really is a transition. If the sellers are able to maintain control and 0,65000 folds, the logical second target would be around 0,62500.
Only a new forceful push and close beyond 0,68800 would negate this bearish/false break scenario in my opinion.
Falsebreak

Dax can't cope with the round 10000 levelGerman Dax index was ahead of the 10.000 point big figure, after a false break turns down heavily...
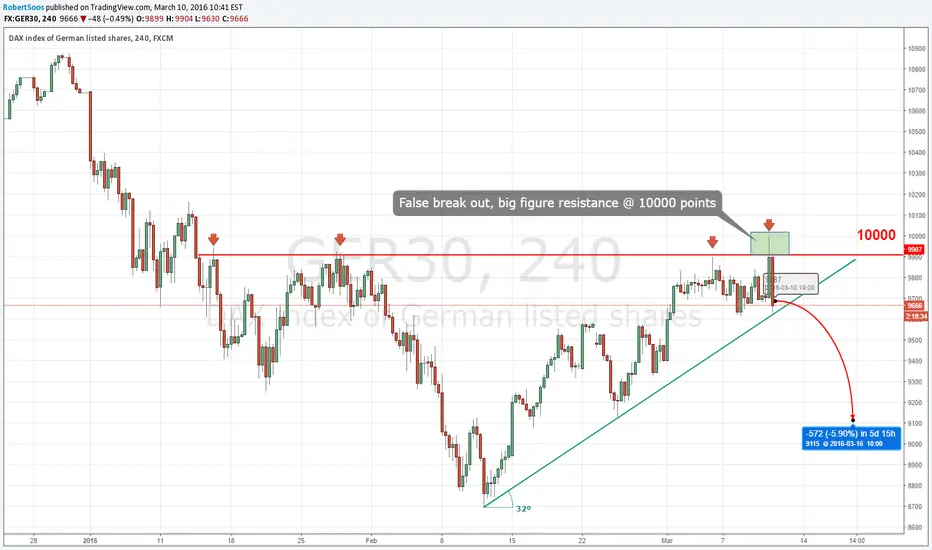
DAX false break out, nose diveGerman Dax index was ahead of the 10.000 point big figure, after a false break turns down heavily...

Gold Sell SignalSpike or false break above the last high together with divergence and we have a sell signal.
For a more conservative entry wait for the trend line break
Target 1: $1100
Target 2: $1090
Stop Loss: Above $1135

Holidays Season Trading - Increased volatility and riskI've been asked a lot about trading during Holidays Season.
There are several things you need to be aware of if you intend to trade during Holidays Season that starts this week:
1. Low liquidity - Market is thin as banks, funds, institutions and pro traders take time off
2. Unexpected moves and increased intra-day volatility. Aggressive price reaction to minor events.
3. Frequent False Breaks - Especially in volatile pairs like $GBPNZD
This $GBPNZD chart is a great example of how 300-400 pips range with 3 major structure zones held for more than 2 weeks. Notice the multiple False Breaks to all structure zones.
In order to manage through the Holidays period here are 3 tips:
1. Use smaller positions size.
2. Use wider stop loss - Focus on Major structures and trend lines
3. Take profits on short term targets and move stop loss to BE.
Tomer, The MarketZone
This analysis is part of the Weekly Markets Analysis newsletters
To read more interesting technical reviews for the week - goo.gl
To subscribe to the newsletters - goo.gl
Follow my blog - goo.gl
Subscribe to my Youtube channel - goo.gl

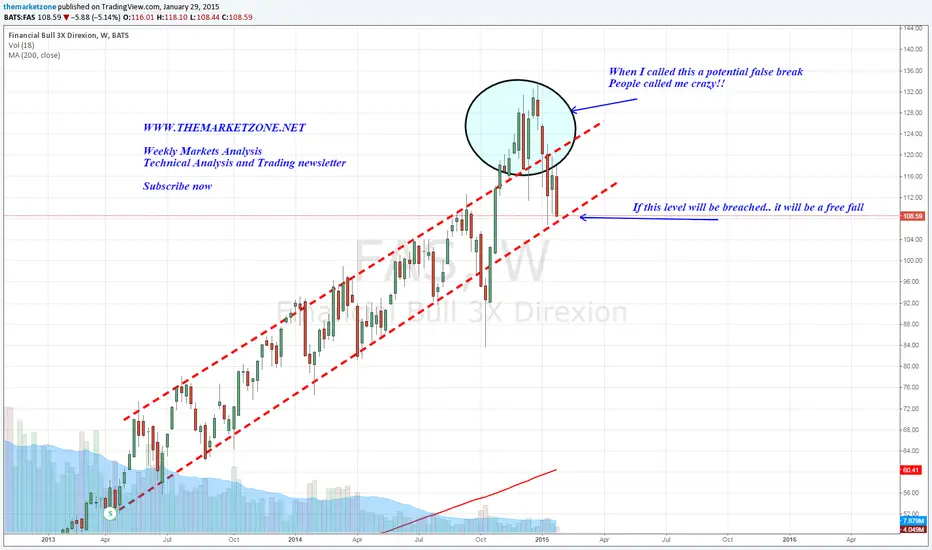
Major weekly false break - What's next$FAS is testing the bottom of a weekly channel. Critical support zone to watch but on the longer term, I'm bearish
GBPAUDReferring to my earlier analysis on the daily chart for this pair in the link below, this market has gone deep into the identified support zone and pushed beyond the lower end of the zone before rallying back up into the zone at the point of writing this post.
The candle in H4 chart is not closed yet. Will wait and see if this is the false break I have been waiting for to send the price up.

USDJPYLast week, market tested and broke resistance zone around 102.75 three times but failed to close above it. From the chart, we can see the three candles with long upper wicks showing rejection of resistance zone. Will be looking for short opportunities from any retracement back to 102.75 level.
