EURCAD Sell IdeaH4 - Bearish divergence followed by bearish convergence. So we may now expect a correction to happen and once the correction completes itself, we can start looking for sells.
M15 - Two bearish divergence in a row, two false breaks. If the price breaks and closes below 1.5625, we can look for sells.
Protection – Above last high.
Invalidation – If the price moves higher and breaks above 1.5655, then this setup is invalidated.
Falsebreak

USDCHF Buy IdeaH4 - Two false breaks.
H1 - Triple cycle up, bearish divergence formed.
If we get a double wave correction, we can then go long with the breakout of the most recent trend line.

CHFJPY Buy IdeaD1 - Price reached uptrend line, hidden bullish divergence formed.
H4 - Bullish divergence.
H1 - Multiple false breaks, alternative trend line false break, bullish divergence. The price has broken above the downtrend line and also it has currently broken above the middle point at 115.186.
We can now join the bulls aiming the price to reach the target zones marked in the screenshots, based on the retrace level of the cycles.

EURUSD - balance range (1.2218-1.2295)EURUSD is in balance (consolidation) now with a range levels 1.2218-1.2295. In Friday we saw a false break down of this balance.
What to do now?
There are 3 options in this case:
p 1. Trade after consolidation will be break up.
If the price breaks out level 1.2295 and holds above, we must wait for a correction to upper balance level and than buy.
p 2. Trade after consolidation will be break down.
If the price breaks out level 1.2218 and holds below, we must wait for a correction to lower balance level and than sell.
But you must remember - if false break out/down happens and the price will return back into the balance you need to close position immediately.
p 3. Trade inside the balance from the lower balance level (it's not recommended to trade against a false break out/down). In this case you need to put stop below the false break down.

POWR/BTC Volume Analysis Prediction 2/7/2018Power coin made a false break down of strong supoort level 6485.
Also the price break out the trend line.
On intraday chart we have a strong bullish trend.
In summary, buy priority with a great potential.
Trade recommendation:
Entry point: 7890 (buy limit), 8602 (buy stop).
Stop: 7349
Target1: 9850
Target2: 10900
Target3: 11700
Glossary of terms
Point of Control (P O C) – The price level for the time period with the highest traded volume .
Value Area (V A) – The range of price levels in which a specified percentage of all volume was traded during the time period. Typically, this percentage is set to 70% however it is up to the trader’s discretion.
Balance - Accumulation Area.


CL - long opportunitypreferably is to wait False Break of level 63.03
long - 63.03
stop - under false break
target - 66

USDCAD Buy IdeaH1 - Bearish divergence, pullback with false break, one leg divergence, price broke below the low at 1.25031. We might see the price pushing lower now.
M30 - If the price moves lower and creates one more leg down with bullish divergence. Then we can go long with the breakout of the most recent high.
Invalidation: If the price moves higher and breaks above the high at 1.256658 before creating one more leg down, then this setup is invalidated.

EURUSD - false break signalFalse break of balance - is a strong signal.
Stop loss must be below the false break.
Trade recommendation:
Buy - 1.2347
Stop Loss - 1.2311
Target 1 - 1.2415
Target 2 - 1.2475

USDJPY Double ScenarioSell Scenario
D1 - Price reaching the bottom of the range. and I believe we are going to continue lower as there is big bearish pressure. Bullish divergence forming, so we may expect the price to break below the bottom of the range and the previous lower, then a correction to happen. Once this correction completes itself, we can look for sells.
Buy Scenario:
H4 - Double wave down, second leg is nearing the 100 fibo expansion level which coincides with the bottom of the daily range. We may expect the price to move lower now, which might form a special cycle which is then going to create another false break, then the up move is very much possible.
Once the price reaches the 50% of the range look for bearish evidences and only after we get confirmations for bearish momentum look for sells. In case if the price breaks above the 50% of the range then there is a good possibility that the price might reach the top of the range again.
H1 - Alternative trendline, we may expect the price to respect it.

AUROPHARMA Short term Positional Call (2-3 days)Aurobindo Pharma Limited Trading technical call for short term
Buy Above 663 Closed basis SL 648 Targets 675 678 683
For education purpose only

USDCHF Buy IdeaH4 - We got one false break, we might look for one more false break. Price broke below alternative trend line. Double wave formed and the second leg reached the 161 fibo level and a reversal is happening now.
M30 - We may now look for a correction to happen (this could be higher than the most recent low or lower than the most recent low) both are fine.
After the correction once we get bullish evidences, we can look for buys.
Alternative Scenario:
Look for the price to provide some sort of correction and then one or two more waves down. After that once the price breaks above the middle point, we can start looking for buys.

Bayer Buy IdeaW1 - Double wave down, Price moving higher after reaching critical zone. Bullish divergence formed.
D1 - Special cycle completed, we may expect the price to reach 50% retrace.
H4 - False break on the bottom and also a false break on the top with convergence. Possible push to upside or at least in a corrective range.
As long as the low at 102.11 holds, we can look for buys until price reaches 38.2% and 50% of daily special cycle.
H1 - If we get a break above 104.84 and creates higher highs, we can then start looking for buys.

Bitcoin Cash Buy IdeaH4 - Price which was moving inside a triangular pattern has now broken out at the bottom of this pattern.
Currently the price is moving higher, if this turns out to be a false break then wait for the price to move higher and break above the top of this pattern and the most recent high.
Once that happens we can join the bulls.

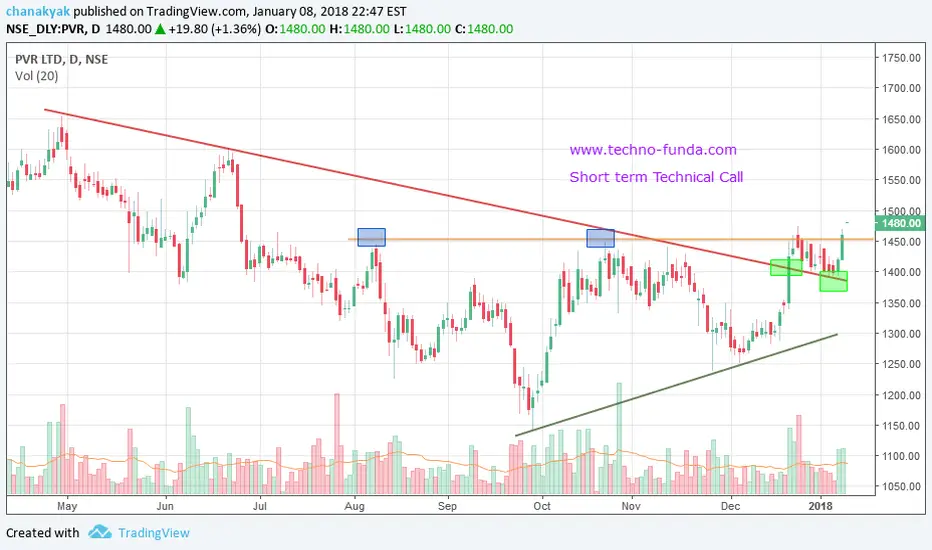
PVR LTD Short term positional callCMP: 1460, Closing based SL 1385, Targets 1519, 1540, 1575
Technicals:
Trend line Breakout
Swing high breakout
trendline support
false breakout retracement
Above SMA volumes
Note: All levels are for Education purpose and pls contact financial advisor before investing
EURGBP Sell IdeaW1 - Price moving inside range and is currently at the middle of the range.
D1 - Price moving inside a channel and is currently near the top of the channel. We may now expect the price to move lower until it reaches the 0.83 zone or so.
H4 - False break with divergence. Price has broken the last low and is moving lower. If this turns out to be a valid breakout, we can start looking for sells.

EURAUD Double ScenarioD1 - False break followed by higher highs, continuing bearish divergence (no PNP divergence yet).
We might see new highs with the price reaching 160.70 magnet zone but before that we might see a double wave correction.
H4 - We have first leg and it looks like a corrections is happening now. once the double wave completes itself in the 100 or 161.8 fibo level, we can go long with the breakout of the most recent trend line.
H1- We have double wave up and once we get a breakout of the uptrend line, we can look for sells.
If you want to be conservative then follow double trend line breakout principle.

USDCHF short term Sell
USDCHF in multi resistance zone : PA + fibonacci.
Looks like it can go down to 0.9825 zone and from there may be create pivot low to buy 38% retrace zone back up with the bigger trend to 1.0 zone but we'll need to wait and see price action there...
Best of luck :-)

NZDCAD Buy IdeaD1- After double wave down, price is moving inside a pattern. We have got two false breaks and bullish divergence.
H4 - We may expect double wave to form with price reaching the bottom of the pattern and then we may expect a bullish reversal.
H1 - We may expect triple cycle down, which will also form a double cycle on the H4 chart. We have a perfect magnet zone that has formed. Once price reaches this magnet zone we may expect a bullish reversal to happen and we can look for buys.

UK100 Sell IdeaH4 - Price broke the uptrend line.
We have bearish divergence with false breaks.
Price has also formed a double wave up and the price is currently moving lower breaking the most recent uptrend line. We can start looking for sells.

XAGUSD : looking to buy false break of the lowLooking to enter a buy position in 1H time frame due to main trend up + PA support + fibonacci confluence + 17.0 round number zone.
The plan is to wait for a false break of the low and gain low risk high reward position.
first target = 17.4 zone
second target = 18.5 zone
Best of luck :-)

XAUUSD : looking to buy untill 1300 zoneWaiting gold to spike down the lows and reject them.
If it will reverse on the support I'll buy untill the 1300 zone.
Levels marked on the chart...
Best of luck :-)

GBPJPY Sell IdeaW1 - False break of this double wave with bearish divergence. Keep in mind we could still see 160.00 based on the previous bearish special cycle.
H4 - Trend line break, bearish convergence and false break. Until we get any confirmation for bullish momentum, we can start looking for sells.
H1 - Any push towards the top of the pattern shown in the screenshot with bearish divergence to be formed could be a good opportunity for the sells.
