UCAD Bears Ready to Break 2 Month Long Falling Support??OANDA:USDCAD has been supported by a Falling Support Trend line since August 14th and here soon Price could potentially give us a Bearish Break to that Trend line!
Once a Breakout is validated, we could look for a Retest Set-Up for some Short Opportunities to take Price down to the Support Zone created by the August and September 2024 Lows.
An interesting fact to point out is if you observe the reaction of Price when it tests the Falling Support, we can see Price arc and the following reactions arc smaller, suggesting Bulls are losing strength on the push off of the Falling Support!
Price Action is being heavily driven by Fundamentals in the markets this week:
-USD-
ADP Non-Farm Employment - Previous 60K / Forecast 111K / Actual 37K
ISM Services PMI - Previous 51.6 / Forecast 52 / Actual 49.9
ISM Manufacturing PMI - Previous 48.7 / Forecast 49.3 / Actual 48.5
ISM Manufacturing Prices - Previous 69.8 / Forecast 70.2 / Actual 48.5
Unemployment Claims - Previous 239K / Forecast 236K / Actual 247K
*Average Hourly Earnings, Non-Farm Employment and Unemployment Rate are to be released tomorrow
-CAD-
BOC held Interest Rates @ 2.75%
Ivey PMI - Previous 47.9 / Forecast 48.3 / Actual 48.9
*Employment Change and Unemployment are to be released tomorrow
With BOC holding Interest Rates and the Federal Reserve possibly looking to cut rates because of a "softening labor market", this could fuel CAD to overcome the pair and put Bears in control to pull Prices lower!
www.tradingview.com
Falsebreakout

NZDUSD - growth ended with a false breakout NZDUSD makes a false breakout of resistance after strong growth in the Asian session. The dollar is correcting a bit before the news at this time, which may give a chance for the currency pair to correct
Scenario: Strong growth of 2.3% is tempered by a false breakout. The price is not ready to continue rising. Consolidation of the price below 0.60200 may intensify the sell-off and trigger a correction to the support at 0.5969 (0.5)

AU Bulls Make A Break For Higher Prices! Time To Long??OANDA:AUDUSD has practically been caught in an Ascending Channel for most of this year but that might not be for "Long"!
A few key things to point out:
- Early April delivered a False Breakout where Price reached the Previous 5 Year Low @ .5980 and was immediately sent back up into the Channel! (Liquidity Sweep??)
- Most of the Price Action that's occurred in this range has been contained to the Upper Chamber of the Channel between the Rising Resistance and Linear Regression.
- Price Consolidated tightly into a Pennant Pattern underneath the Rising Resistance for the past few weeks before delivering a Bullish Break just earlier this evening.
If Bulls are able to sustain Price outside the Channel, this could generate potential Long Opportunities on the Retest of the Break of the Ascending Channel!
Once a Breakout is validated and Retest is successful, the Price Target would be the Next Swing High @ .66875 where Bears were able to push Price down last.
Fundamentally, RBA will be releasing CPI y/y numbers on Tuesday, May 27th with analysts forecasting a .1% Decrease in Inflation from 2.4% to 2.3% after last week having made a 25 basis point rate cut from 4.1% to 3.85%.

GBPUSD may correct after false breakout The currency pair has overcome a huge 0.8% or 110 points since the opening of the session, having wasted all the potential and is trying to test the resistance. The potential for breakout and continuation of growth may not be enough and the price may make a false breakout and correction before the second impulse to the intermediate high, where the scenario with correction may be repeated
Scenario: Breakout of 1.3402. No possibility to continue growth, return under the level and consolidation below the level - further sales.
It is possible that the price will consolidate above 1.34 and will head towards the far, strong level of 1.34425 from which a false breakout and correction can also be considered.

GOLD consolidated below a key level on FridayGold is in a downtrend forming a counter-trend correction. Friday's trading session closes below the key level of 3203-3205. Buyers are weaker than sellers.
But, before the continuation of the fall MM is quite likely to test the resistance to provoke ordinary buyers before the fall
Scenario: the growth attempt may turn out to be false. A retest of 3203 resistance, a false breakout and price consolidation below 3203 is a sell signal.
Additional scenario: MM trap to provoke buyers to buy. A retest of the far resistance 3230, a false breakout and a price fixing below 3223 could start a decline

NAS100USD: Is this a False Break?Greetings Traders,
In today’s analysis on NAS100USD, we observe sustained bullish volatility, indicating that the institutional order flow remains decisively bullish. As such, our objective is to align with that momentum and seek opportunities to position ourselves accordingly.
Current Market Context:
Now entering the New York session, we can anticipate continued upward movement. A key technical development is the recent liquidity sweep—price action took out a set of sell stops, creating the appearance of a potential bearish break of structure. However, this movement aligns with a classic “Turtle Soup” scenario, where a false break is engineered to trap liquidity before the market resumes in its dominant direction.
Institutional Insight:
This sweep suggests that institutions have likely order paired against willing sellers, using their stops as entry liquidity. With that liquidity now absorbed and price rejecting lower levels, we look for bullish confirmations to join the smart money narrative.
Trading Focus:
We are now monitoring for lower-timeframe confirmation entries to validate bullish setups, ideally supported by institutional arrays or bullish order blocks that hold as support.
Let the market reveal the footprints of smart money—our role is to read and respond with discipline.
Regards,
The Architect

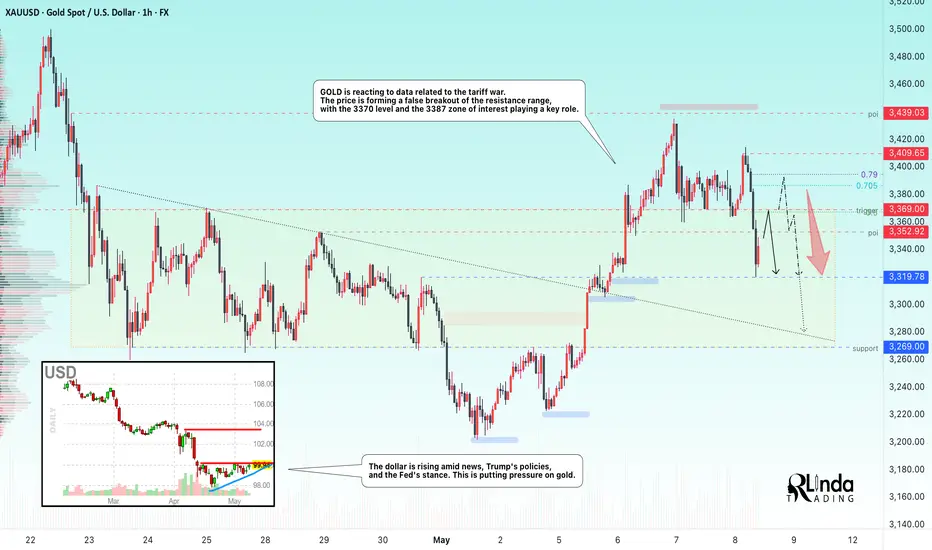
GOLD → Return to range. Fall from resistance...FX:XAUUSD is reacting to data related to the tariff war. The price is returning to the range and forming a false breakout of resistance. The level of 3370 and the zone of interest at 3387 play a key role.
On Thursday, gold rose to $3,400 amid a weaker dollar, increased demand for safe-haven assets, and continued uncertainty due to US trade policy and tensions in the Middle East and Ukraine. The Fed left rates unchanged and expressed caution in its assessment of the outlook, which also supports gold's rise.
However, in the European session, we are seeing gold react to the trade deal with Britain, most likely due to the easing of tariffs. Now the main focus is on the terms of the deal. We should not forget about China, where the situation remains tense, but everyone is waiting for a resolution.
Resistance levels: 3352, 3369, 3385
Support levels: 3319, 3269
The fundamental backdrop changes several times a day. At the moment, the situation is as follows: the rise of the dollar, the weakening of the tariff war, and the hawkish stance of the Fed may put pressure on gold. Therefore, I expect the decline to continue after a retest of 3370-3386. In this case, the target could be 3319.
Best regards, R. Linda!
Bull Trap – The Real Drop May Just Be Starting! (Crash Ahead?)The market appears to be gaining bullish momentum, giving the impression that the bear market is over—but what if it’s just getting started?
On this CRYPTOCAP:TOTAL chart, the current price action seems to mirror the 2021–2022 bear market cycle: a rally to new highs, a sharp drop, a deceptive recovery (bull trap), followed by a deeper correction and eventual accumulation.
If this pattern plays out again, we could be in the bull trap phase—right before a significant and unexpected drop.
What do you think?
Will history repeat itself, or are we heading to new highs?
Drop your thoughts in the comments!
Please support this idea with a LIKE👍 if you find it useful🥳
Happy Trading💰🥳🤗

GU Bear Flag Confirmed, Break & Retest Set-UpHere on the 1Hr Chart FX:GBPUSD has formed what seems to be a Continuation Pattern, the Bear Flag!
Now, with Price in a decline prior to entering the Consolidation Phase of the Pattern, this suggests that Price will continue further down if this Break is Validated and a Retest is Successful!
We will want to see:
1) Strong Breaking Candle that is followed by Accumulation of Bearish Volume!!
2) 10 - 20% of the Range, Past the Break
3) 3 - 5 Closing Candles, Outside of Break, Before Retest
This is considered the True or False Formula to determine if its a True Breakout or False Breakout.
RSI is Below the 50 in Bearish Territory with room to stretch Oversold strengthening the Bearish bias.

APTUSDT → Retest of the liquidity zone. Downward trendBINANCE:APTUSDT.P failed to realize its potential. The price made a false breakout of resistance and formed a reversal pattern. Correction or continuation of the downtrend?
Bitcoin is rebounding from resistance. Technically, the market may enter a correction or consolidation. Altcoins are reacting accordingly — correction
Within the downtrend but local ALT rally, APT failed to realize its potential and formed liquidity accumulation and a false breakout of the downtrend channel resistance before a possible decline...
Resistance levels: 5.2, 5.458
Support levels: 4.76, 4.48, 4.17
A consolidation of the price below the trend resistance or below 5.20 could trigger a continuation of the global and local trends. The coin is likely to remain near the bottom and test new lows...
Best regards, R. Linda!

EURGBP → False break of liquidity zone (resistance)FX:EURGBP within the distribution (news background) tests resistance 0.84616 and liquidity zone, but without the possibility of continued growth the price forms a false breakout
The dollar index falls amid Trump's introduction of new tariffs, which generally provokes a rally in the whole market. But before NFP, the market shifts to profit-taking because of the growing risks. There are quite important news ahead, which may provoke high volatility.
Technically, after a strong move, the currency pair forms a false resistance breakout and consolidates in the selling zone. If the bears keep the price below 0.84616, in the short term we should wait for a correction to 0.5 fibo or to the fvg zone.
Resistance levels: 0.84600
Support levels: 0.8427, 0.8396
The situation is quite complicated due to unstable background, but technically we have a classic situation with a false breakout of strong resistance, and as we know, according to statistics, the strongest movements start after it (in relation to the trade of level breakout).
Regards R. Linda!

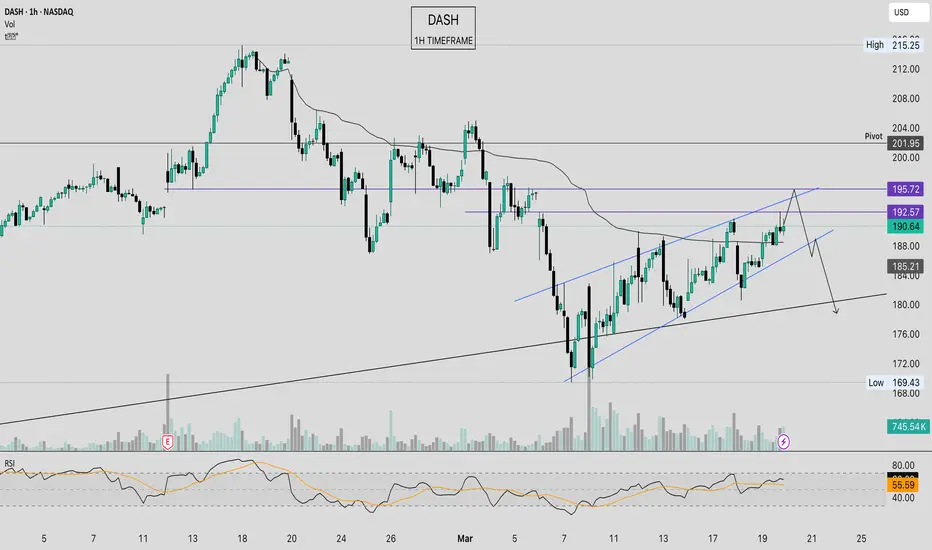
DoorDash: Is it another advantage or a liquidity trap?Reading a slightly bearish sentiment on DASH at the moment. We have the swing high anchored VWAP combined with a riding wedge. In the short term, it could potentially reach 195, potentially creating a false breakout and trapping long liquidity. Therefore, it’s advisable to exercise caution and closely monitor this situation. Let’s see how it unfolds!
CAKEUSDT → False breakout of resistance. Return to the trendBINANCE:CAKEUSDT is forming a false breakdown of key resistance as part of a bullish rally. Further altcoin decline may be influenced by bitcoin's decline, the flagship looks rather weak
Technically, the move in Cake looks like a counter-trend maneuver to gather liquidity before a further, possible fall. The altcoin market is weak and most coins continue to look for a bottom, while bitcoin is consolidating but with a hint of a decline to 91-90K.
CAKEUSDT is focusing on 2.6144 - 2.7288. If the bears keep the price below these zones, the coin could head down in the short to medium term
Resistance levels: 2.6144, 2.7288, 2.2964
Support levels: 2.420, 2.0634
Statistically, a false breakdown provokes the strongest movements, often even trend changes. In this case, it is a counter-trend movement and if the price reverses locally, the coin will be under the pressure of the trend again. A price fixing below 2.6144 may strengthen the fall to 2.42, 2.06, 1.04.
Regards R. Linda!

USDJPY → False break of support gives bulls a chanceFX:USDJPY bumps into support and forms a false breakdown of the lower boundary of the local trend. The dollar is strengthening at this time, which may give a chance for growth of the currency pair.
The price stops in the zone of strong support, the fundamental background has been unstable lately and depends more on the USA. Everyone has long forgotten about the growth of interest rates in Japan and follows the economic data from the West.
Technically, there are two triggers on the chart, one to buy and one to sell, but since the global and local trend is upward, the preference is to buy. If the currency pair is able to consolidate above 151.9 - 151.95, then in the short and medium term we should expect growth to the targets indicated on the chart.
Resistance levels: 151.94, 153.7, 153.97
Support levels: 150.95, 149.52
But, if the dollar continues the correction and the bulls fail to realize the false support breakdown, the price return to 150.95 may provoke the support breakout and fall to 148.64.
Regards R. Linda!

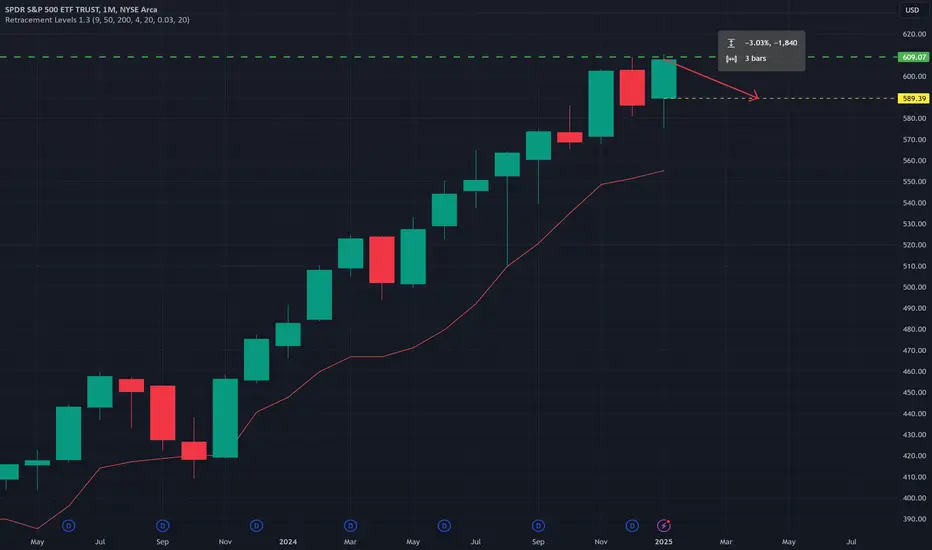
As Goes January So Goes the YearI have written and talked about this statistical superstition born out of trading almanacs of the "January Effect" which proposes that the month of January's direction (a green bar or a red bar) will determine the final close of the year as a whole. I plugged the data into a spreadsheet this year mid-January to get the updated statistic and for the last 97 years this adage has held true 68% of the time. Like all statistics when studying markets "nothing is 100%" but it is safe to say "more often than not" this is true.
The January 2025 Monthly open is -3.03% from the Friday close... SPY is going to open -2.19% as of writing this morning. We still have a whole week of trading days left in January to see how 2025 will MOST PROBABLY play out.
There's a lot of "reasons" talk this morning about some Chinese AI being the culprit of the selloff. I never take heed of the need for the media to publish digestible stories to give such reasons: they are never tradable prior to the event they claim and each is a one-off so knowing the "reason" (if even true) is totally worthless for making money.
The more logical answer according to price which is far more actionable to traders is the failed breakout last Friday. While SPY made a new All Time High the Weekly itself failed to close to confirm it. Not following through on such a move is a clear bearish signal going into a weekend. Now THAT is a much better "reason" to be focused on this week (and every time it happens in the future).
Analyzing BAJFINANCE: A Simple BreakdownOverview
The price action around the ₹7,440 resistance level tells an interesting story. Initially, the price broke above this key level with increased trading activity (volume), signaling strong buying interest. However, it couldn’t stay above ₹7,440 for long and fell back below the resistance in the following sessions. Despite this, the selling pressure was weak, as shown by the lower trading activity during the drop. This suggests that sellers weren’t very aggressive.
Signs of Buyer Strength
One important observation in the circled area is that the price has been forming higher lows. This means buyers are stepping in at slightly higher levels each time, showing they are still interested. The latest green candle, which has a noticeable increase in volume, further supports this idea. It indicates that buyers are regaining control and may attempt to push the price higher.
Was It a Failed Breakout or a Retest?
While the first attempt to break ₹7,440 failed, the price hasn’t fallen much. Instead, it seems to be consolidating in a range, with strong buyer support around ₹7,200–₹7,300. This could mean the price is preparing for another breakout attempt, making this a potential retest phase rather than a complete failure.
What to Watch for Next
The next big signal will come if the price closes above ₹7,440 with strong trading activity. This would confirm a successful breakout and could lead to further upward movement. Until then, traders might want to wait for clear confirmation to avoid getting caught in a false signal.
Study
The circled area highlights a battle between buyers and sellers. While the initial breakout failed, the price has shown resilience by holding above key support levels. If buyers continue to gain strength and push the price above ₹7,440, we could see a bullish trend emerge. Until that happens, patience is key.

GOLD → Correction after a false breakout. What's next?FX:XAUUSD reaches a key resistance that stops a strong rally. A false breakdown triggered a correction, which could be a chance for comfortable buys.
The gold price stabilized around $2,725 after a three-day climb, remaining under profit taking pressure. Strong data on China's economy failed to inspire the market as real estate concerns and possible U.S. tariffs dampened optimism.
Expectations of Fed rate cuts continue to support gold despite mixed data on the US labor market and retail sales. The Fed chief's statements about possible rate cuts in the first half of the year are adding support to the metal.
Next week, traders' attention will be focused on US housing and industrial production data.
Support levels: 2700, 2697
Resistance levels: 2712, 2721
Global and local trend is bullish. Counter-trend correction is being formed. Technically, the correction may reach the zone of interest 2700 - 2697, from which we should expect a rebound, for example, to 2712, or even the recovery of the bullish trend.
Regards R. Linda!

SOLANA → Will a false breakdown be the cause of the rally?BINANCE:SOLUSDT is testing a previously broken downtrend boundary as part of a correction. Bulls are employing aggressive methods to keep defenses above key support ahead of Trump's inauguration, keeping hopes high
On the weekly timeframe, the market is supported by SMA50 support indicating a strong uptrend. The focus is on two strong levels: 204.75 and 175. These are the boundaries of the current range. A breakdown of any of the boundaries will play a key role in further price movement. But I consider the realization of resistance as a priority.
On D1 yesterday a false break of strong support was formed in the form of previously broken downtrend resistance. This indicates that the market is still in a bullish plane and on the background of upcoming important news this could have a favorable impact for the coin.
Resistance Levels: 203-204
Support levels: 183, 175
If the price starts to retest the support at 175 and form a consolidation with a gradual downward compression, the risk of breaking the bullish pattern will increase.
But, based on fundamental data, I expect a consolidation above 183 and further growth
Regards R. Linda!

GBPUSD → Consolidation in the selling zone held by bearsFX:GBPUSD made an attempt to grow, but could not overcome the bears' pressure zone. The reasons for the growth are the dollar correction, which was short-lived. The main trend is not broken.
On D1 the price after breaking through the key support at 1.25 tested it already as resistance within the correction. A false breakout of resistance is formed and price consolidation in the selling zone. The sharp impulse was related to the dollar, which fell after Trump's comments on rumors related to his policy. The dollar returned to the upside creating another bout of pressure on GBP.
Technically, the main trend is bearish. The price is in the selling zone and bears are not ready to give up their positions.
The risk of trend change may come after the breakout of 1.26, but it is too early to talk about it...
Resistance levels: 1.2575, 1.26
Support levels: 1.2488, 1.2449
The price is trying to consolidate in the selling zone, which generally indicates which way the market intends to go. Bears are increasing pressure and if they keep the price below 1.2488 - 1.2449, we will see a fall in the short and medium term.
Regards R. Linda!

Strong EUR? - A EUR/USD AnalysisEUR/USD has displayed bullish characteristics over the last couple of weeks.
- We have reach a high in the market @ 1.095.
- This high was made after a bullish A,B,C,D pattern aka (Trend).
- In bullish markets, prices tend to find support at the previous high, the previous high in this market (To me) is @ 1.085.
- We currently have made a bullish pin bar rejection candle on 3/19/2024.
- Currently we have untapped orders at 1.098, this is where I believe prices want to go in the next month.
- Breaking the 1.098 level, could lead to a bigger move up toward 1.11.
** as always, trade smart, trade responsible, and manage the risk as much as the reward **

BITCOIN → False breakout of $ 65,000. What's next ↓ ?BINANCE:BTCUSD entered a strong buying zone (above 65K), but the bulls failed to realize the potential. The price returned in the channel boundaries, eliminating the positively-minded... A false breakout is forming relative to 65K.
After the liquidation and strong impulse, a small correction is formed, directed to the imbalance zone. The retest may end with the bears holding the defense below 65K, in this case the price may start a gradual decline due to the lack of opportunity to break through 65K (in this case the all-time favorite pattern “Head and Shoulders” may form here). The focus is on the support 62745, below which an ogrom pool of liquidity is formed, if the price enters this zone, the market may spill down.... The global range of 65K - 55K is still relevant. It is not excluded that the resistance can be broken quickly, but for the moment the fight for 65K is still going on... Bears will be able to confirm their victory provided the price consolidates below 62800.
Resistance levels: 65K, 66K
Support levels: 62745, 61320
As the fight for 65K continues, the bulls may make another attempt on the background of the retest. If they will be able to consolidate above the 65-66K zone, the price will head to the global resistance - 68-69K, where a more serious, fierce struggle will develop...
Rate, share your opinion and questions, let's discuss what's going on with ★ BINANCE:BTCUSDT ;)
Regards R. Linda!

Bearish scenario for the weekThis is the bearish scenario for the week. We have two clusters of liquidity. One at GETTEX:64K and at $65k. I expect a sweep of the previous FWB:65K highs and then a reversal if we turn into an correction.

This is NOT Bullish for the Stock Market!This week The Fed lowered rates and everyone was "SURE" that this would lead to a huge market yeet in stocks and Bitcoin INDEX:BTCUSD ... but are we getting it?
Price closed the week with an attempt to break higher on the S&P 500 futures CME_MINI:ES1! BUT closed BACK INSIDE the prior All Time High. THIS is a key sign of a potential reversal. In this video I look at similar instances to demonstrate how this simple element of price action is often all one needs to correctly identify reversals whether it is Bitcoin, individual stocks, or the market as a whole!
