False breakout ??....False breakout ??....
I will short the structure until there is a real break out....
Falsebreakout

CADJPY Short, false breakoutFX:CADJPY
If the daily closes below trend line it would confirm a false breakout, I'll be looking for an entry in the 4H with a SL above swing high with around 1 ATR buffer.

Could it be a trap? $BTC (Bulltrap)Current thought, so far $BTC is showing some good bullish signs. But, too many people think itll BO. Yet, nothing good or useful has been released or shared. Not even the Futures, can’t help but think this will be a trap for a dip to $3,000-$3,500 or worse. Shorting higher.
Worst case, I’ll take my loss like a champ. Reverse my order and okay the bull run. Too much hype.

Who is in control? I'm not kidding! I warned!Now give me hopeful people at BITCOIN. What is the main trend? What is the largest volume? Who's in charge of this game?
What are the technical indications that the game has changed?
People are full of hope in TOP TRADING VIEW, they are highly manipulative people. They need to live, they need to sell their expertise on their call. They live on it. They lie!
Take your money and go buy knowledge, not SHITCOINS cheap service. This is not an investment.
An investment in knowledge pays the best interest. Benjamin Franklin
Buy books. This market is far from over.
Stop fighting the trend. Is she your friend.
Now go look at my studies.
I'm not famous.
I do not want your money
I will not fool you
Now go!

False breakout - ShortFollowing false breakout, pair has put in double top. Bearish divergence on RSI confirming that, the bullish move is over. Looking for pullback back to the previous structure support(now resistance)level, to get the best risk reward ratio, before shorting this bad boy. Stop loss above the double top.

USDCHF SELL, big resistancehas hit a big resistance, had a false breakout, then retest then a big rejection, sell from here, first target is 0.786, (pigs get slaughtered)


A false breakout in SMHSMH has falsely break out of the 98 double top resistance level on the back of some positive general market sentiment.
However, the break was short lived and it has been quickly auctioned back into the old trading range.
A false pattern is a powerful pattern in itself as a failure at one side of the range tend to fuel move to the other side of the range. Now I am eye it to break the 88 major support and open doors to a much bigger move to the down side.
The massive contracting triangle at the high would imply at least two legs down. Now we only have seen the first leg. The break of the 88 support would be the beginning of the second leg.

SPX SHORT ACCUMULATION OPPORTUNITYWell guys.. the divergence started right away.. The volume leads the way..Both equity to derivatives..
It's amazing to me that on rally days the problems globally are forgotten..Are these people high..I find it hard to go long on equity at this time..
From the largest shippers to the largest most popular phone and gadget company lowers by 10 billion to warnings that it's harder to maintain profit margin..WTH
Manufacturing has pulled back to 2008 numbers..
Because the FED agrees that the global economic contagion could reach our shores and they may react to the data. So people jump hand over fist to get more shares of the overvalued companies???
No matter which way it goes i will hopefully continue to pick up the markers before it happens so I CAN TRADE IT..
For now I'm bearish

GBPNZD DAY BEST LUCKY STAR DOJI STRATEGYTrading Doji candlestick as a stand-alone trigger signal is a bad idea. Price usually whipsaws around doji.
Note #1: In technical analysis, the Doji candle is a neutral pattern if it’s used as a stand-alone candlestick.
However, if the Doji candle it’s used in conjunction with the preceding price, we can establish a bullish or bearish bias.
A whipsaw pattern involves price moving chaotically above and below a certain key support and resistance level. Whipsaw patterns are also referred to as false breakouts. We have developed our Japanese Doji trading strategy around this price feature.
Step #1: For short trades we need a steady move downward, below the 14 –day MA
Even though most traders used this Japanese candlestick pattern as a reversal pattern, we have found out through some testing that the Doji candle performs best as a continuation pattern. So the first step we need to undertake is to determine the trend direction.
When we see the price moving steady downwards below the 14-day MA we have enough reasons to believe a downtrend is in progress.
Step #2: Look for a Doji Candlestick to develop near the 14-day MA and inside the previous candle price range.
Next, there are two more conditions that need to be satisfied for a valid trade setup. The first thing to consider is the location of the candlestick setup. We need the Doji candle to develop near the 14-period MA.
Secondly, we need the Doji candle to be contained inside the price range of the previous pattern. Basically, this will lead to the formation of another pattern called an inside bar.
So, we have a pattern within a pattern.
Step #3: Whipsaw pattern: Look for a false breakout above the previous two-bar pattern. Go short once we recover and break below the Doji candle opening price
Now, we’re going to bring to light how we use the whipsaw pattern to our advantage.
The Doji candles are very well-known candlestick patterns for producing a lot of false breakouts. We also know that a break of a level against the prevailing trend has fewer chances to success.
So, by putting all these pieces of the puzzle together we were able to develop one of the best Doji strategies, which eliminate the scenario where your stop loss is prematurely triggered.
After the false breakout, we wait for the price to recover and we only sell once we get price breakouts the bearish Doji candle opening price.
Note #2: We want everything to happen within the first candle after the Doji bar. So the false breakout and our entry should be immediately on the next bar following the Doji candlestick.
Let’s now determine an appropriate place to hide our protective stop loss and a proper way to exit our trade.
Step #4: Place protective SL above the current daily candle high. Take profit once we break below the inside bar pattern or a support level.
We aren’t going to stay in this trade for a very long period of time. That’s the reason why we exit our profitable trade once we break below the inside bar pattern or nearest sup/res. When it comes to placing our protective stop loss, we can hide it above the high of the candle that triggered our entry.
Long trade is just opposite setups.

Very very serious question for you guys.....why do guys like me who get NEARLY ALL OF MY CALLS ALMOST SPOT ON!!!!! get like 200 views with 4 likes... as seen here
but guys like this
www.tradingview.com
who were dead wrong and this
ARE GETTING LIKE 15,000 VIEWS AND HUNDREDS OF LIKES!!!
I really truly do not understand does everyone on trading view like loosing all of there money? do they thoroughly enjoy loosing more and more with every trade instead of making loads of money every trade and becoming rich is that really what they want... okay then...

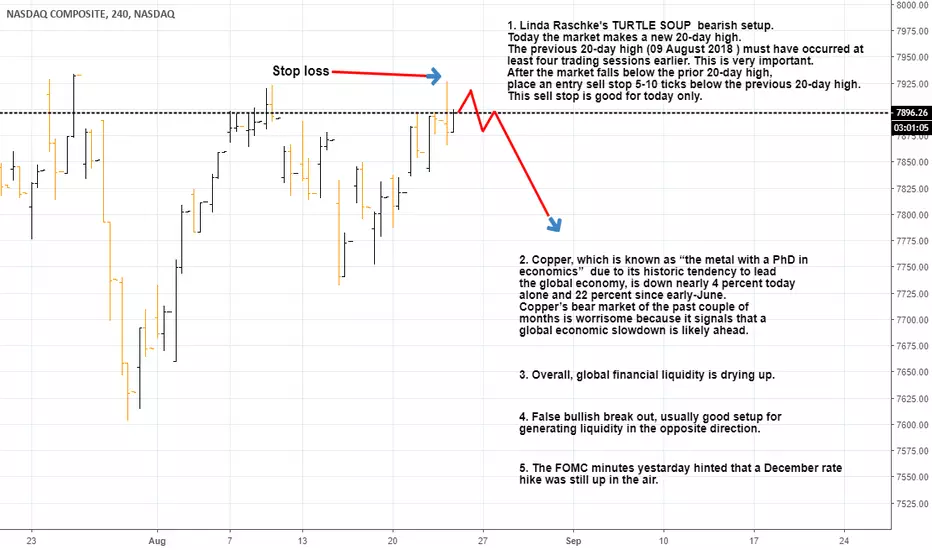
Bearish setup on 4H in NASDAQ with tight stop loss.Bearish setup on 4H in NASDAQ with tight stop loss. This is a technical setup, called Turtle Soup by famoous trader Linda Raschke. The trade is good for today only.
LCAM3 false breakout?BMFBOVESPA:LCAM3 released results and the market made a breakout in the opening. However, the price closed below yesterday, showing a false breakout. We are expecting a correction in prices until mma21.

Breakout or False Breakout? On the HTF we see BTC/USD create significant support zones at the $6,100.00 level. Price respected this support line several times as the lower highs using the $6,100 as a base creates a triangle pattern.
We have already experienced a breakout which got us to the $8,400 levels with a retest and bounced back, using that former resistance trendline as support. However, this bullish activity could simply be a false breakout as we noticed a 5% drop placing BTC under the 0.61 fib zone and minor resistance level of $7,800. We must keep our eye on the close of the daily candle above that zone if we are to expect bullish momentum. Otherwise, we can expect the price to once again test that $6,000 zone again.
Using fibonacci extensions and previously structure as reference points we can create several take profit zones if the candle does close above the triangle pattern once more. The targets are as follows: $9,200 (0.78), $10,100 (1.281), $17,150 (2.68).

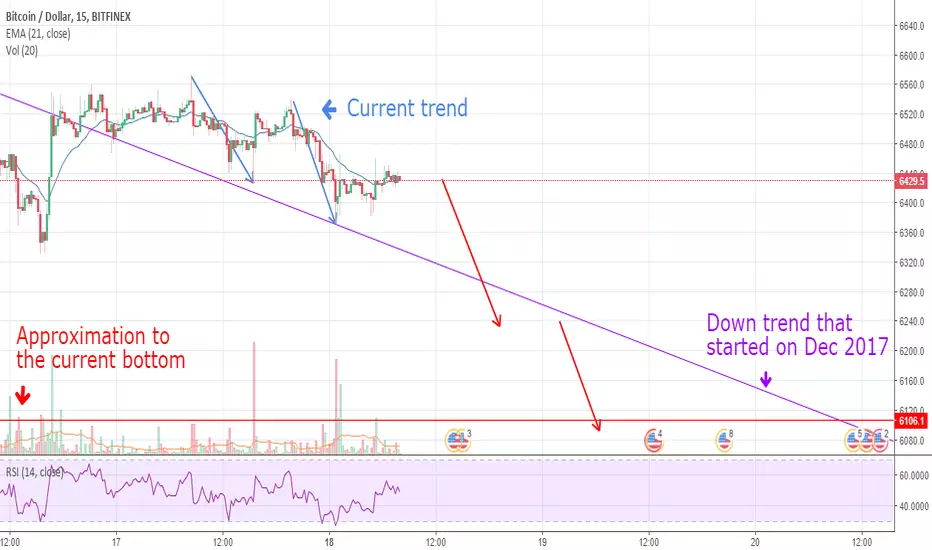
Bitcoin downtrend will continueI think we need to test the established bottom before we could go up. I'm expecting COINBASE:BTCUSD to go down and the bots will stage a false breakout, after that we will probably stabilize around the current bottom or go up.
EURCAD false break outEURCAD failed to clear all stops and close above triangle resistance, causing a trend reversal. Furthermore, the price has pushed through the trend line support and it looks eager to test triangle support.

CL - sell opportunityWe saw a false breakout of the balance. For now we can wait for the retest of higher balance level and sell at 65.58 with stop 66.57
The target is the middle level of the balance (62.63 - target1) or the lower balance leve (59.09 - target2)

I smell a BULL TRAP.I felt uncomfortable when the candles move up and down in square wave in matter of minutes on H1 chart as if nobody is trading it.
This movement shouldn't appear in a bullish market.
Also, the volume for each daily candles are too low compare to panic selling during 2018-03-06 - 2018-03-17 and 2018-03-25 - 2018-04-01.
The volume for each candle should be around 60K to 100K, but there's only 20K - 40K.
The rally is up too much, too fast, too easy.
I compare a slope for this rally among other uptrends.
The closest one that I can find was during 2017-08-03 to 2017-08-19.
They have higher volume than the false rally.
I smell a BULL TRAP. A big one.
I think it will land around 7500 back to the old long term support.
With the red line resistance become support, we will have 2 fold up trend, and the real battle will begin.
For those who buy the dips before 12th April (the big bounce). You are still safe (almost).
Just don't panic sell it and cause price to go lower :wink :wink.
For now, leave it alone don't do anything irrational.
Always trade with the trend, not counter it.
If you're still on the rally. Put your stop loss ready. You can ride it for a while, but be cautious.

(4 HOURLY) GBPJPY (SHORT)-Description
potential false breakout, price closed above channel but was unable to sustain this and re-entered the channel. i am anticipating price to fall to the support of the channel or moving averages may act as dynamic support so, i am anticiapting 2 enteries, 1st held till moving average (dark blue MA), 2nd held till channel support.

(DAILY) GBPUSD (SHORT)-Description
potential shooting star with price closing below resistance
potential false breakout of resistance
currently my bias is a swing trade short to support line.

AUDUSD in midst of 60 min / 15 min Supply zone This looks like a bull trap after a retail breakout (0.77151) resistance.
The trap is a clutch of sell orders ready to go in the 0.77219 - 0.77256 range.
Sell in this range, 20 -25 pip stop.
1x and 2x targets are in range.
Good luck
Tim

ES - sell opportunityWe saw a false breakout of the balance and the price returned back into the balance
For now we can wait for the retest of higher balance level and sell at 2785 with stop 2803,75
The target is the middle level of the balance (2733) or the low level of the balance (2696.75)

EURUSD : Stoploss Hunters in ActionA simple analysis of trading psychology that was recently happened on EURUSD.
1. Price broke through the upper trendline, breakout players jumping in and start buying the pairs.
2. The big players(institutional, hedge funds, etc) let the market ran for a while to wait until a lot of bulls entered the market.
3. Most of novice traders are easy to read, so the big players can predict their entries and stoploss. In this case, most of the entry and stoploss triggers are probably set on these 2 lines.
4. Once the bullish momentum slowly built up, those big players started pouring sell orders in huge chunks, drowning all the retail traders who had taken buy position thinking the breakout would continue.
5. Price slowly going down even though most of traders were sure the breakout was a sign that price might go higher. Some novice might have thought that this bearish movement was just some retracement before price launch like a rocket.
6. The institutional traders, this time, managed to push price down until it started hitting the stoplosses of the retail traders. A stoploss of a long position equals as a sell order when triggered.
These triggered stoploss, combined with new sellers that jumping in after seeing a strong selling pressures, can only fuel the bearish momentum even more, resulting in an even bigger selling pressure.
