FB

Meta Platforms in red. FBWe are not in the business of getting every prediction right, no one ever does and that is not the aim of the game. The Fibonacci targets are highlighted in purple with invalidation in red. Fibonacci goals, it is prudent to suggest, are nothing more than mere fractally evident and therefore statistically likely levels that the market will go to. Having said that, the market will always do what it wants and always has a mind of its own. Therefore, none of this is financial advice, so do your own research and rely only on your own analysis. Trading is a true one man sport. Good luck out there and stay safe!

DWAC Epic Market On Close VolatilityInto the final minutes, $DWAC was trading at $39 a share at about 3:58pm. It then flushed to $36.69 by 3:59 only to reverse and close at $42.29 by 4pm. It hit a high of $59.39 before closing at $55.40 after hours. This is off of news that they have reached a fundraising target. With Jack gone and the recent distribution in names like $TWTR and $FB, is this a rotation into a competitor? Or is it a rotation from meme stocks such as $GME, $AMC, $CLOV, $BB, and $BBBY that have recently rolled over? Either way, this is nothing short of epic volatility.

Meta Platforms price target for the comming week!FB could move toward 325-320once again and this means put options have high return potentials this week!
Important price patterns in the Multi-Timeframe Analysis:
You can see the most important support (green lines) and resistance (red lines) to watch in the coming days in these charts!
Best,
Moshkelgosha
DISCLAIMER
I’m not a certified financial planner/advisor, a certified financial analyst, an economist, a CPA , an accountant, or a lawyer. I’m not a finance professional through formal education. The contents on this site are for informational purposes only and do not constitute financial, accounting, or legal advice. I can’t promise that the information shared on my posts is appropriate for you or anyone else. By using this site, you agree to hold me harmless from any ramifications, financial or otherwise, that occur to you as a result of acting on information found on this site.


Facebook ( Metaverse) to Test 315$ and bounce back to 338$Facebook ( Metaverse) to Test 315$ and bounce back to 338$

FB - STOCKS - 17. NOV. 2021Welcome to our Weekly V2-Trade Setup ( FB ) !
-
4 HOUR
Bearish break towards previous highs.
DAILY
Expecting another push to the upside..
WEEKLY
Great price action, looking for more bullish breakouts..
-
STOCK SETUP
BUY FB
ENTRY LEVEL @ 342.58
SL @ 323.06
TP @ Open
Max Risk: 0.5% - 1%!
(Remember to add a few pips to all levels - different Brokers!)
Leave us a comment or like to keep our content for free and alive.
Have a great week everyone!
ALAN

Meta is going down ?Hello there Im new to investment just hope this help it looks like in trendlines of 4hr timeframe the fb broke the lines well hope it helps somoene thank you for reading NASDAQ:FB it looks like it broke trendlines at 4hr chart and it looks like it would go down for quite a bit for now (ps i wish i could upload a picture but I still can't hope it helps with information and hope in a future i will be able to givbe more info)

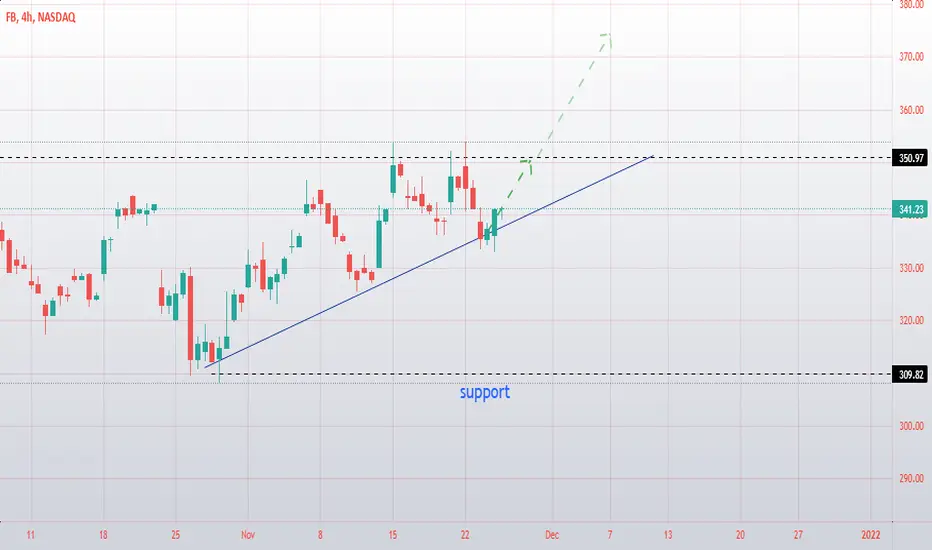
What do you think?the price reached support. Two scenarios are possible here. after such a fall, it is easier to expect a breakout. What do you think?

A false breakout of support is possible. Be carefulThe price is gaining momentum. Our forecast is working. A false breakout of support is possible. Be careful
FBFacebook seems to be targeting 355-366 on a bullish move. I really want to see this hold 336 for a move to the upside, if it can't hold that lvl it will unfortunately see downside momentum ! Good luck on the trades but I'm very confident on Facebook leading QQQ ! !! ! !! Happy Thanksgiving one last time !

FB/Meta - Resistance Turned SupportWeekly chart for FB and newly named Meta
It can be seen along the 1/1 Gann line that a previous resistance (red oval) has turned into a support (green oval)
The 50MA can also be seen as a point of support in both points
Now is the time to go long, with the new Metaverse pursuit and the consistency of price displayed through history by Meta

Don't forget about stopWe are still waiting for growth above the previous maximum. Don't forget about stop

FB Meta Platforms sold by ARK InvestIs it overvalued?
Is a crash about to happen?
ARKF sold 43,188 shares of FB yesterday, equivalent of 14.55Mil usd.
And it`s not the first time!
FB has a strong support in the $285 area!
Looking forward to read your opinion about it.

enter the positionAfter breaking through the resistance, the price went up and now a correction is expected. After pulling back from support, you can enter the position

Long | FB | Weekly Swing end 11/27NASDAQ:FB
Possible Scenario: LONG
Evidence: Price Action , Dark pool activity, Options flow.
TP1: 155$
TP2: 161$
*This is my idea and could be wrong 100%

This is not a good sign!looking at the charts, most big techs have long upper shadows or a long red candle! Apple is an exception!
Today smaller tech companies are hammered so hard which is not a good sign as well!
Taking profit or raising stop loss could be a good strategy!

Meta, 22 Nov. Will the Head & Shoulders Work Out?FB printed a large inverted H&S pattern and consolidates at the neckline. However, price is currently in the 50-61% reversal zone so that we need to observe positions carefully.
Elliott:
We can count a wave (i) and wave (ii) in blue, which retraced precisely 50%. Now we count the unfolding wave (iii) on a smaller degree (green waves).
Geometry:
Price reacts nicely to the current pitchfork. A breakout above the upper boundary (blue dashed line) confirms that we are indeed in a wave (iii), because it would also catapult price above the .618 retracement fib. This is important.
Gann:
Support: 340, 312
Resistance: 370
How I trade it:
The idea is to trade the inverted H&S pattern with an entry above the Gann level (341). The target of the pattern is 383. The 355 level (.618 retracement of the previous wave down) is critical because price could drop from here. In that case we are able to close at breakeven and invert the trade.

$FB | WEEKLY WATCHLIST 11/22This setup looks primed to continue running up! Beautiful inverse head & shoulders pattern as well as a bull flag breakout on Friday. Looking for a pullback into the $339.6-344.17 range to buy the dip on Monday/Tuesday. Targeting $370 to the upside.

Buying FB shares though I don't have FB accountI don't have FB account but technically the charts for this stock looks interesting.
I will buy 50% of its single share (fractional share) as soon as 5EMA cross the filter line. Refer to the linked related ideas on the trading system.

FBLooks like a potential winner to me in tech for the next couple days/weeks while a name like AAPL just got near its s/t top iMO.
355 367 384 400 R lvls to the upside
337 330 support on downside.

Facebook over 400$ Facebook hits the strong support line and goes up again, i think facebook will blow up over 400$ in the next 2-4 months. all the EMAs are supporting
what do you think?

FB slow downFB moved towards support and began to slow down near the support line. Rebound and takeoff possible. What do you think?
