DAX Trading plan within this 1H Channel DownDAX is within a Channel Down pattern on the 1H time-frame and just bounced back to its top (Lower Highs trend-line), hitting the 1H MA50 (blue trend-line) immediately. As long as the price remains within the Channel Down, sell and target the Inner Lower Lows trend-line at 15525.
With the 1H MACD just forming a Bullish Cross that high for the first time since September 01, it is equally likely to see a bullish break-out above the Channel. We will buy if it breaks above the 0.5 Fibonacci level, which should coincide with a 1H MA200 (orange trend-line) test. In that case our target will be 15940 (the 0.786 Fibonacci).
-------------------------------------------------------------------------------
** Please LIKE 👍, FOLLOW ✅, SHARE 🙌 and COMMENT ✍ if you enjoy this idea! Also share your ideas and charts in the comments section below! **
-------------------------------------------------------------------------------
💸💸💸💸💸💸
👇 👇 👇 👇 👇 👇
FDAX1!

DAX Buy opportunity on the 1D MA200 and bottom of Channel Up.DAX is on the 3rd straight green 1D candle after it almost hit the 1D MA200 (orange trend-line) last Friday, which is intact since November 10 2022. This rebound comes as a natural reaction to the long-term Support dynamic of the 1D MA200 as well as the presence of Support 1 from the July 07 Low.
As long as it holds, we will take it as a buy opportunity and target 16700 (Internal Higher Highs trend-line). If it closes a 1D candle below the 1D MA200, we will take the small loss and open a sell targeting Support 2 at 14470.
Notice how even the 1D RSI almost hit the 34.70 Support and is rebounding, which is an additional buy signal. Don't neglect also the fact that Friday's low was formed at the bottom of the 7-month Channel Up pattern.
-------------------------------------------------------------------------------
** Please LIKE 👍, FOLLOW ✅, SHARE 🙌 and COMMENT ✍ if you enjoy this idea! Also share your ideas and charts in the comments section below! **
-------------------------------------------------------------------------------
💸💸💸💸💸💸
👇 👇 👇 👇 👇 👇

DAX Found Support on the Megaphone's Higher Lows.DAX is on the 8th straight sideways 1D candle as it found Support on the bottom (Higher Lows trend-line) of the long-term Bullish Megaphone pattern. The 1D MA50 (blue trend-line) is the short-term Resistance while the price is trading around the 1D MA100 (green trend-line) as pivot.
We are bullish, targeting the Internal Higher Highs trend-line at 17000, as long as the Megaphone's bottom holds. The bullish extension may be even higher considering the fact that the medium-term pattern could be an Inverse Head and Shoulders (IH&S) that technically targets the 2.0 Fibonacci extension at 17400.
If however the price breaks below the Higher Lows trend-line, we will short-term sell targeting the 1D MA200 (orange trend-line) where a 1D candle close below it, would justify a bearish extension to Support 2 at 14470.
For now the trend remains bullish, as illustrated by the 1D RSI also which is on an 8-month Support Zone.
-------------------------------------------------------------------------------
** Please LIKE 👍, FOLLOW ✅, SHARE 🙌 and COMMENT ✍ if you enjoy this idea! Also share your ideas and charts in the comments section below! **
-------------------------------------------------------------------------------
💸💸💸💸💸💸
👇 👇 👇 👇 👇 👇

DAX: Bullish above the 1D MA50.DAX is pulling back today after a rejection on R1 (16,530), the biggest 1D red candle since July 6th. The 1D technicals are bullish (MACD = 102.900, ADX = 31.239) but the RSI close to becoming neutral (RSI = 55.835), which indicates the slow pace of this uptrend. The 1D MA50 made an emphatic hold four days ago, so as long as it holds we expect the index to continue reproducing the February-May fractal. Our final target is again on the HH trendline (TP = 16,650).
Prior idea:
## If you like our free content follow our profile to get more daily ideas. ##
## Comments and likes are greatly appreciated. ##

DAX above the 1D MA50, has already started the new rally.DAX broke yesterday above the 1D MA50 (blue trend-line) again after rebounding at the bottom (Higher Lows trend-line) of the December 2022 Bullish Megaphone pattern. This is the new technical bullish leg that will aim to form the next Higher High. On a similar way with the previous bottom rebound on March 20, the Low was also priced after the 1D MA100 (green trend-line) broke.
Their RSI patterns are also identical, with the current attempting to test its Lower Highs trend-line before breaking it. The MACD Bullish Cross that was just formed is also in line with the previous two (March 29 and January 03). Every Cross below 0.0 is a long-term buy opportunity.
Our target is just under the Internal Higher Highs trend-line at 16800.
-------------------------------------------------------------------------------
** Please LIKE 👍, FOLLOW ✅, SHARE 🙌 and COMMENT ✍ if you enjoy this idea! Also share your ideas and charts in the comments section below! **
-------------------------------------------------------------------------------
💸💸💸💸💸💸
👇 👇 👇 👇 👇 👇

DAX First strong buy signal after 1 monthDAX is testing the MA50 (1d) following a rebound on the MA100 (1d).
That was also the bottom of the short term dashed Channel Up as well as the medium term yellow Channel Up.
Technically this is the strongest buy opportunity since May 31st.
Trading Plan:
1. Buy when a (1d) candle closes above the MA50 (1d).
2. Sell if it closes under the Channel Up.
Targets:
1. 16500 (top of the short term Channel Up).
2. 15450 (bottom of the long term dotted Channel Up).
Tips:
1. The RSI (1d) hit its Rising Support level. Additional buy indication.
Please like, follow and comment!!
Notes:
Past trading plan:

DAX is rebounding on the 1day MA100. Bullish.DAX is on the 2nd straight green day after the rebound on the 1day MA100. That was also a Higher Low at the bottom of the mid-March Channel Up.
Buy and target Resistance A (16440).
Sell if a 1day candle closes under the 1day MA100 and target the bottom of the December 2022 Channel Up at 15310, where you can take an even lower risk buy.
Previous chart:
Follow us, like the idea and leave a comment below!!

DAX: Holding today's low can lead to 16,500DAX is trading inside multiple short and long term Channel Up patterns, an indication of a strong bullish trend, showcased by the green 1D technicals (RSI = 59.394, MACD = 107.100, ADX = 32.591). As long as the 1D RSI stays over the MA line, we remain bullish (TP = 16,500). If it breaks under it, we will target first the dashed Channel bottom (TP1 = 16,000) and after a 1D candle close under it, extend to S1 (TP2 = 15,635).
Prior idea:
## If you like our free content follow our profile to get more daily ideas. ##
## Comments and likes are greatly appreciated. ##

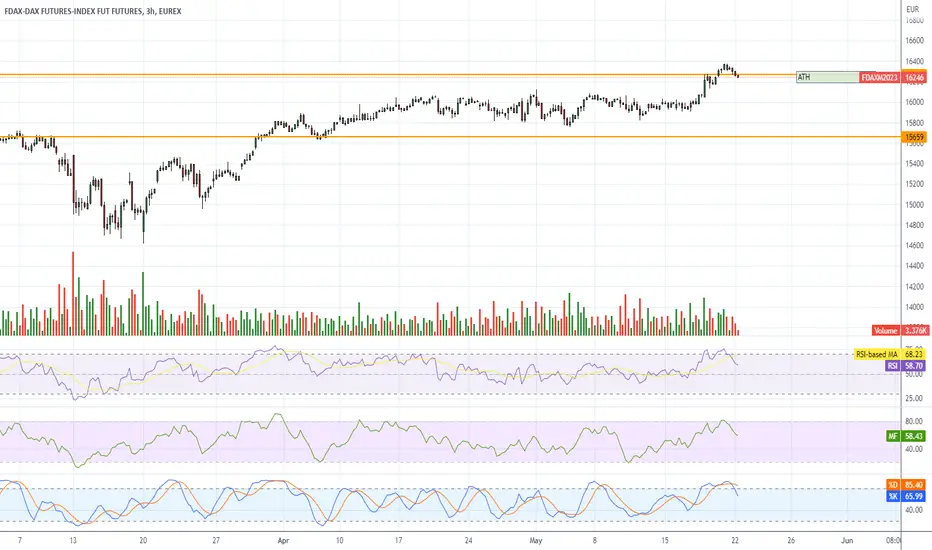
FDAX UpdateHit overbought on RSI and MFI. There's always a chance it breaks out to a new ATH like last time (see highlighted area), but this could be a double top.
I mean it all makes sense for Germany to break out while it's in an official recession, right? LOL, crazy market.

FDAX UpdateRSI overbought, MFI is ot there yet. Looks to me like it wants to double top because recession is apparently good for German economy.
I have no idea why the European market is so disconnected with reality. Anyways, I'm not just spouting recession, they are technically in one, in fact the whole Eurozone is.
www.cnbc.com

FDAX UpdateIndicators are neutral but chart pattern looks bullish. Looks to me like they want to hit a new ATH again while in a confirmed recession.
This market doesn't make much sense but Europe is full out ridiculous.

DAX: Inverse Head and Shoulders aiming for a new All Time High.DAX is trading around the 4H MA50 and 4H MA200 with technicals naturally neutral (RSI = 52.802, MACD = 10.300, ADX = 21.396) as on any consolidation. The pattern that was completed (inside the long term Channel Up) is an Inverse Head and Shoulders. Technically such formations target the 2.0 Fibonacci. Our plan is to traget the R1 initially (TP1 = 16,335) and then buy any pull back given and aim at Fibonacci 2.0 (TP2 = 16,600).
It is important to mention that the 4H RSI has been trading inside a Channel Up during the formation of the Inverse Head and Shoulders, giving an early bullish signal.
Prior idea:
## If you like our free content follow our profile to get more daily ideas. ##
## Comments and likes are greatly appreciated. ##

FDAX Update3 hr indicators show nothing, but MFI is about to hit oversold on the daily. Probably next week.
Probably gonna set a new ATH while in a recession. Crazy.

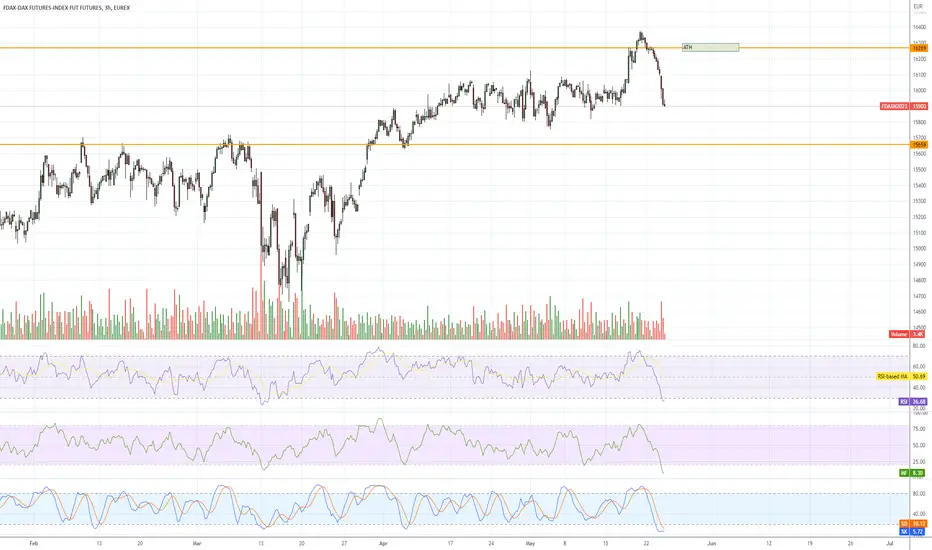
DAX potential pull-back.DAX had an excellent run since our buy signal (see chart below) more than two months ago (March 21) but after it broke above the former All Time High (ATH) on May 19, it has formed a top and is pulling back:
As long as the price is closing the 1D candle above the 1D MA50 (blue trend-line), it will be a buy opportunity targeting the top of the (dotted) Channel Up at 16600. If however it breaks below the 1D MA100 (green trend-line) we will quick sell towards the Channel's bottom at 15350 and add a new buy there. In either case, the target remains intact at 16600.
-------------------------------------------------------------------------------
** Please LIKE 👍, FOLLOW ✅, SHARE 🙌 and COMMENT ✍ if you enjoy this idea! Also share your ideas and charts in the comments section below! **
-------------------------------------------------------------------------------
💸💸💸💸💸💸
👇 👇 👇 👇 👇 👇


DAX Trade break outs only. Neutral at the moment.DAX has turned neutral after the 16340 top and the subsequent test of the MA50 (1d).
As long as those two levels hold, it will remain sideways with no action to take.
The long term pattern is a double Channel Up.
Trading Plan:
1. Buy if the price closes over Resistance (1).
2. Sell if the price closes under the MA50 (1d).
Targets:
1. 16750 (top of Channel Up).
2. 15200 (Fibonacci 0.618 level).
Tips:
1. The RSI (1d) is trading under the MA trend line, consistent with the previous two bottoms of the Channel Up.
Please like, follow and comment!!
Notes:
Past trading plan:

FDAX UpdateTrying to figure out who's still buying into this BS rally, it looks like it might be the Euros, FDAX MFI needs to hit overbought. So possibly another gap up tomorrow even if the market goes down today.
Snagged a few BUD puts this morning, just holding that. Got whipsawed out of my XLF puts but I might get another chance at it tomorrow, lol.
Note: I don;t trade the DAX, I use it as an indicator for US market gap direction

FDAX UpdateToday's morning pump was brought to you by the Euros because their market was oversold. PCE numbers came in high but the algos don't care....
I don't expect FDAX to bounce up to the top, GERMANY IS IN AN OFFICIAL RECESSION! I predicted it all year, and it happened yet somehow their market is at ATH which is crazy AF. One of the most absurd things I've ever seen on the stock market.
I'm expecting a gap up Tuesday for a pump and dump but there is absolutely no guarantee, FDAX really needs to head down further
Anyways, recession:
www.cnn.com

FDAX1! Will Go Up From Support! Buy!
Please, check our technical outlook for FDAX1!.
Time Frame: 6h
Current Trend: Bullish
Sentiment: Oversold (based on 7-period RSI)
Forecast: Bullish
The market is on a crucial zone of demand 15846.
The oversold market condition in a combination with key structure gives us a relatively strong bullish signal with goal 16115 level.
P.S
Please, note that an oversold/overbought condition can last for a long time, and therefore being oversold/overbought doesn't mean a price rally will come soon, or at all.
Like and subscribe and comment my ideas if you enjoy them!

DAX 4hour= good time for buy gap comes from cash DAX INDEX
ALERT= Trade DAX,index need minimum 5 year demo practice if you dont have experience, stay away from index

DAX Can decline more before finding a bottomDAX had an excellent run since our buy signal two months ago (March 21) but has since formed a top and is pulling back (see chart below):
The price is below the 4H MA50 (blue trend-line) and today is testing the 1D MA50 (red trend-line) for the first time since March 29. The 1D RSI is still neutral around the 50.00 mark, meaning that there is still more room left on this downside. The next technical Support is the 1D MA100 (green trend-line), which is on a significant Support cluster as it is just above the October 01 Higher Lows trend-line.
We expect a bottom to be made at 15500, it offers a solid R/R ration for buying and that is what we will go, targeting 16300 and the previous High, which was the first target of the late March rebound.
An addition signal to help with taking the best buy entry possible, can be the 1D RSI. A Double Bottom at least (especially as close to the 37.80 Support as possible) would be ideal.
-------------------------------------------------------------------------------
** Please LIKE 👍, FOLLOW ✅, SHARE 🙌 and COMMENT ✍ if you enjoy this idea! Also share your ideas and charts in the comments section below! **
-------------------------------------------------------------------------------
💸💸💸💸💸💸
👇 👇 👇 👇 👇 👇

FDAX UpdateOversold on both RSI and MFI, dropped the whole BS pump.
I think this drop is more about FDAX hitting ATH than it is about debt ceiling, why else would Europe be tanking?
FDAX UpdateNo longer overbought but looks awful bearish.
Interesting that DAX went down, and the US indices are gonna open flat (small caps green). Strange.