GBP/JPY Trap? Smart Money Might Be Setting Up the Next Drop📊 1. Technical Overview
Price broke the bullish structure decisively, closing below a key demand zone between 195.00–196.00, leaving a large unfilled imbalance.
Last week's recovery candle suggests a potential pullback toward 197.40–197.80, now acting as a resistance confluence.
The descending channel and weak RSI further support a continuation of the bearish trend.
Bearish targets: 193.50 and 192.20
📈 2. COT (Commitment of Traders) Report
GBP:
Non-commercials are cutting long positions (–5,961) and adding shorts (+6,637) → Bearish divergence developing on GBP.
JPY:
Non-commercials are heavily increasing short exposure (+15,113), but remain strongly net-long overall, indicating a potential exhaustion of bullish JPY positioning.
💭 3. Retail Sentiment
Positioning is neutral: 51% long / 49% short.
This balance suggests no excessive retail bias, leaving room for directional moves without immediate contrarian pressure.
📆 4. Seasonality
August is historically bearish for GBP/JPY:
• –2.82% (20Y average)
• –3.04% (15Y average)
• –1.44% (5Y average)
The data shows a consistent historical bias to the downside during this month.
🎯 5. Strategic Outlook
• Primary Bias: Bearish below 197.40–197.80
• Invalidation: Weekly close above 198.10
• Targets: 195.00 > 193.50 > 192.20
The confluence of technical rejection, bearish COT dynamics, neutral sentiment, and negative seasonality supports a corrective scenario for August.
Fed

Will Gold Make a New High Amid Prospect of Sep Fed Rate Cut?Fundamental approach:
- Gold gained this week, supported by renewed trade tensions following new US tariffs on major partners and rising expectations of a Fed rate cut in Sep.
- Safe-haven demand strengthened after weak US NFP data heightened concerns about economic growth and reinforced market bets on monetary easing, while US President Trump's tariff announcements drove risk aversion.
- Comments from Fed officials signaled openness to policy adjustments, keeping investors focused on future rate moves even as the US dollar softened and global equities stabilized.
- XAUUSD could remain resilient if upcoming US labor and inflation data continue to disappoint.
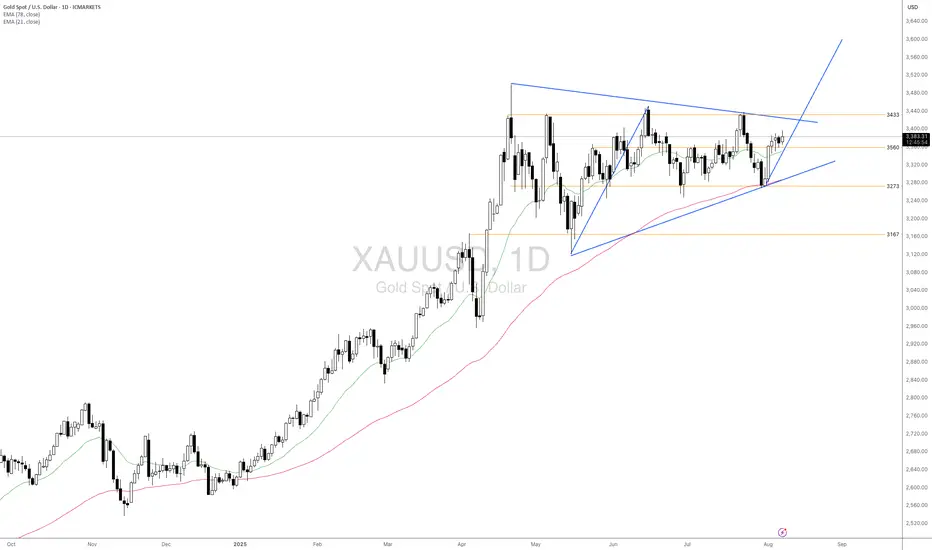
Technical approach:
- XAUUSD fluctuates within a broad range. The price is forming a big Triangle Formation, awaiting an apparent breakout to determine the next movement.
- If XAUUSD breaches above the Triangle Pattern and the resistance at 3433, the price may continue to advance with the measured target at 3600.
- On the contrary, closing below support at 3560 may prompt XAUUSD to continue range-bound movement by retesting support at 3273.
Analysis by: Dat Tong, Senior Financial Markets Strategist at Exness
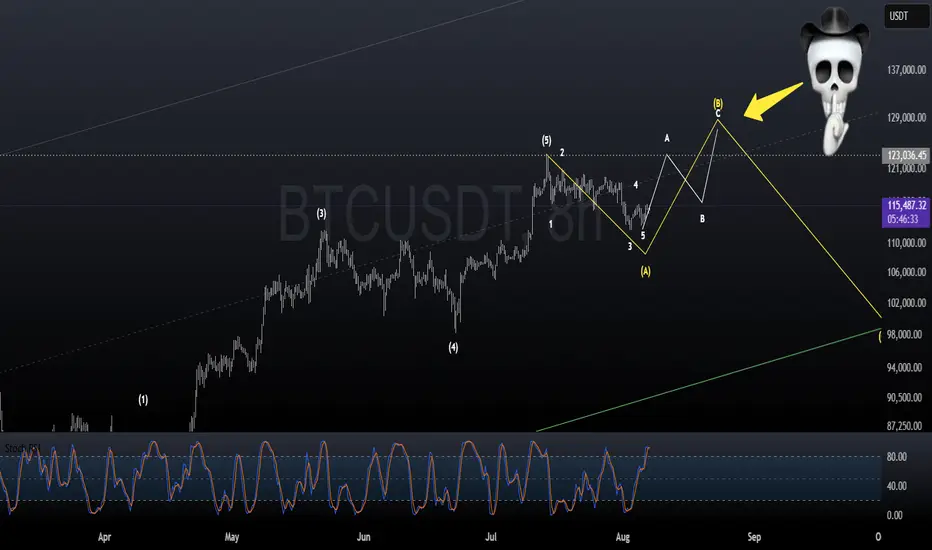
BTC, the clock is tickingLet the chart speak for itself. BTC will make new ATH before the Fed Pivot. After the pivot however, panic will occur and there will be blood on the streets.
You have been told.
P.S Not financial advice.
New Zealand's unemployment rate rises to 4½ high, Kiwi pushes hiThe New Zealand dollar continues to have a quiet week. In the European session, NZD/USD is trading at 0.5923, up 0.37% on the day. The kiwi has been under pressure, falling 3.4% against the US dollar in July.
New Zealand's employment report for Q2 was pretty much as expected, but the news wasn't good. The unemployment rate rose to 5.2% from 5.1% in Q1, below the consensus of 5.3%. This marked the highest unemployment rate since Q3 2020. Employment Change declined by 0.1%, down from a 0.1% gain in Q1 and matching the consensus. This was the third decline in four quarters.
The weak figures point to growing slack in the labor market as the economy continues to struggle. Global trade tensions remain high and New Zealand's export-reliant economy has taken a hit from softer global demand.
The Reserve Bank of New Zealand will be paying close attention to the weak job numbers, which support a rate cut in order to provide a boost to the economy. The RBNZ maintained rates in July after lowering rates at six consecutive meetings. The conditions for a rate cut at the Aug. 20 meeting seem ripe and the markets have priced in a quarter-point reduction at around 85%.
We'll get an updated look at the inflation picture on Thursday. Inflation Expectations rose to 2.3% in the second quarter, the highest in a year. This is the final tier-1 release prior to the August rate meeting.
Three FOMC members will speak later today and investors will be hoping for some insights regarding the Federal Reserve's rate plans. The Fed hasn't lowered rates since December but is widely expected to hit the rate trigger at the September meeting.

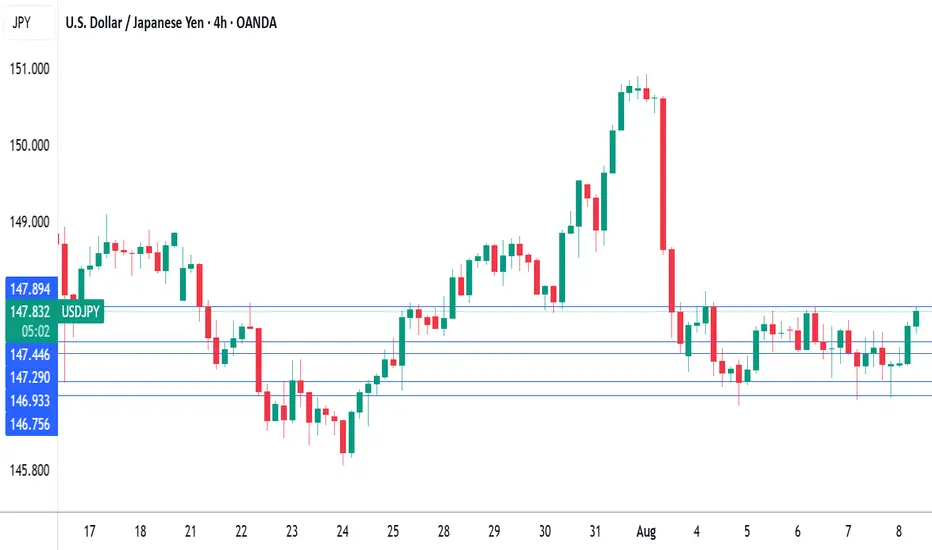
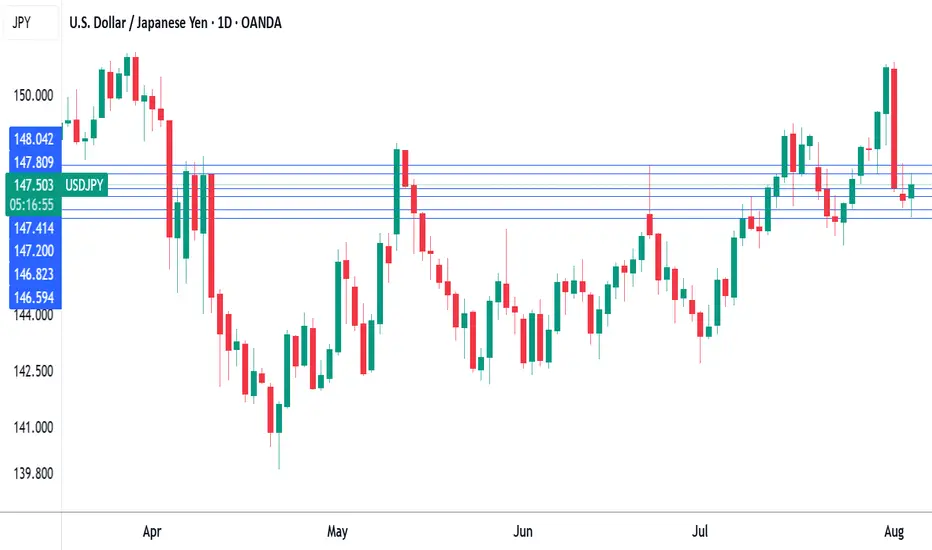
BoJ minutes indicate potential rate hike, yen slipsThe Japanese yen is lower on Friday. USD/JPY is trading at 147.66 in the North American session, up 0.38% on the day.
The Bank of Japan minutes from the July 31 meeting signaled that the BoJ remains committed to further rate hikes. This reiterates comments from BOJ President Ueda that he will raise rates, provided that growth and inflation are in line with the BoJs forecasts.
At the same time, members expressed concern about the uncetainty due to tariffs. Members acknowledged that the recent trade agreement between the US and Japan had reduced uncertainty and had made it more likely that inflation would be sustainable at the 2% target. Still, members noted that "high uncertainties remain regarding trade policies and their impact".
On Thursday, the government lowered its growth forecast for this fiscal year due to US tariffs and sticky inflation, which has hurt capital expenditure and consumer demand.
Speaking of consumer demand, Japan's household spending nosedived in in June with a decline of 5.2%. This was a sharp reversal from the May gain of 4.6% and well below the market estimate of -3.0%. Year-on-year, household spending eased to 1.3%, compared to 4.7% in May and shy of the market estimate of 2.6%.
The Federal Reserve is on track to lower rates in September, which would mark the first rate reduction since December 2024. Last week's soft July employment report saw nonfarm payrolls fall to 73 thousand. This was well short of the market estimate of 110 thousand and included sharp downward revisions to the May and June releases.
USD/JPY has pushed above resistance at 147.30 and is testing 147.45. Above, there is resistance at 147.89
1.4694 and 146.75 are the next support levels
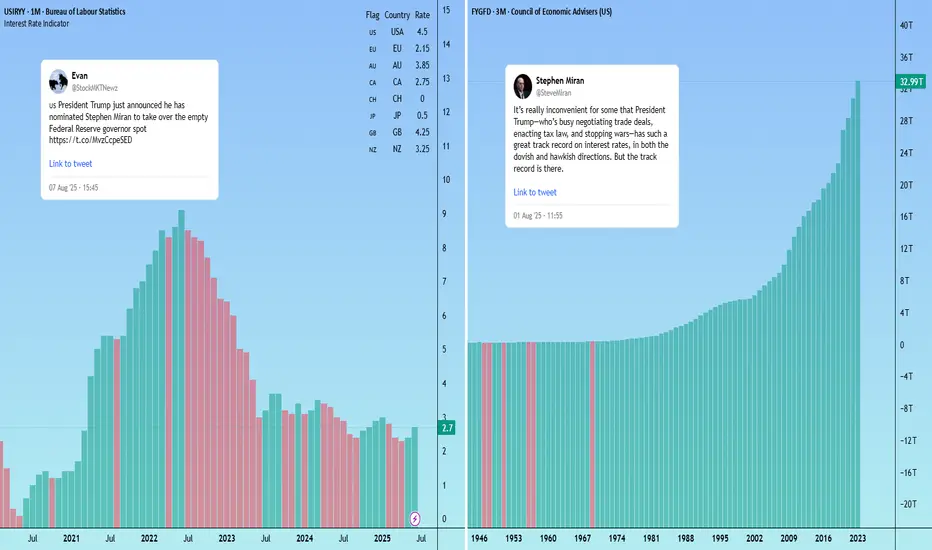
Trump’s Fed pick signals potential softer dollar US President Trump has named CEA Chair Stephen Miran as the temporary replacement for Fed Board member Adriana Kugler, serving until at least January 31, 2026.
As expected, Miran is closely aligned with Trump’s policy views, including support for tariffs and scepticism over the Federal Reserve’s independence.
Notably, Miran is a critic of the U.S. dollar’s current strength and is the author of the “Mar-A-Lago Accord” — a proposal to deliberately weaken the dollar to address the U.S. current account deficit.
The White House is also searching for a new Fed chair. If markets believe the next chair will prioritise Trump’s agenda over an independent monetary policy (a safe assumption at this stage) investors may demand higher yields on U.S. debt to hedge inflation risk. That could add volatility to US pairs.
Approachable Contracts for Trading Around Fed DecisionsCME Group E-Mini S&P Options ( CME_MINI:ES1! ) and Micro S&P Futures ( CME_MINI:MES1! ), #microfutures
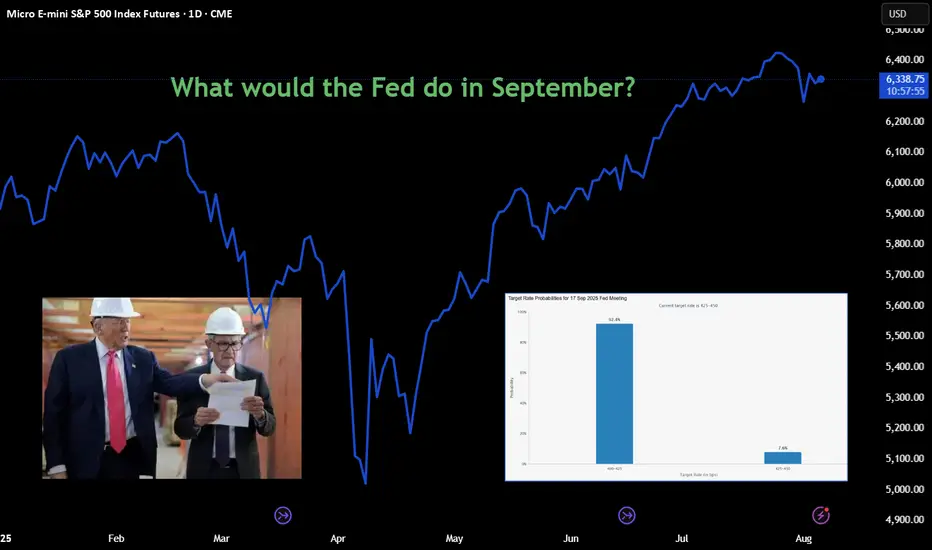
On July 30th, the Federal Open Market Committee (FOMC) decided to keep the Fed Funds rate unchanged at the 4.25-4.50% target range. Investors now turn their focus on whether the Fed will cut rates on the September 16th-17th FOMC meeting.
According to CME FedWatch Tool, as of August 6th, there is a 92.4% chance that the Fed will cut rates by 25 bps in September. My observation:
• Before July FOMC, market consensus was no rate cut, with the odds at 95.3% as of July 20th. Investors now overwhelmingly expect rate cuts to come at the next meeting.
• Two Fed governors broke the long-run consent and voted against the FOMC decision.
Today, I would like to explore two trading strategies focusing on the next Fed decision.
We will start by breaking down all possible Fed decisions as follows:
1) Cut rates by 25 basis points (92.4%)
2) No rate cuts (7.6%)
3) All others, such as cutting by 50 bps and raising rates by 25 bps (0%)
If we deem the 3rd option to be statistically insignificant, we now have an event with binary outcomes, namely, Cut and No Cut .
Since “Cut” is the market consensus, we will translate the possible outcomes as:
• Meet market expectations (Cut Rates)
• Exceed market expectations (No Cut)
Furthermore, financial markets will likely react calmly if the Fed decision meets expectations, while asset prices could swing widely if the FOMC exceeds expectations.
Typically, US stock market indexes, interest rate contracts and the US dollar exchange rates are very sensitive to the Fed decisions. Our discussion today will focus on stock indexes. I will follow up on the other two asset classes in future writings.
Based on the above analytical framework, we could design two sets of trading strategies:
Sell Call Options if a trader expects the Fed to cut rates
• Since the decision meets expectations, asset prices would not move a lot.
• Options may expire worthiness, which allows sellers to pocket the premium as profit.
Sell Futures if a trader expects No Cut
• Since the decision exceeds expectations, S&P prices could go down sharply.
• With build-in leverage in futures contracts, a trader could realize enhanced profit.
Now, let’s explore how to structure trading strategies using S&P futures and options.
Hypothetical Fed Decision 1: Meet Expectations
Cutting rates is bullish for S&P as it will lower borrowing costs for component companies. However, since market already priced in a Fed cut, stock prices will not move a lot.
If a trader shares this view, he could explore selling Out-of-the-Money (OTM) Call Options on CME E-Mini S&P 500 futures ( NYSE:ES ).
Each ES contract has a notional value of $50 x S&P 500 Index. On August 6th, the September ES contract (ESU5) is quoted at 6,341, making the notional value at $317,050.
• Call options at the 6500-strike are quoted at $42. By selling 1 call, options seller will receive $2,100 in upfront premium (= 42 x 50).
• Options expire on September 19th, two days after the FOMC. If ESU5 price does not exceed 6500, options seller will pocket the premium as profit.
• Warnings: selling options involves significant risks. Seller could lose more than the premium he collected. To cut losses, seller could buy back at the open market and exit the position. This will avoid losses to accumulate by expiration date.
Hypothetical Fed Decision 2: Exceed Expectations
Since rate cut is already priced in, an Unchanged decision will likely cause the S&P to fall sharply, as expected future borrowing costs will go up.
If a trader shares this view, he could explore selling CME Micro S&P 500 futures ( MSTAR:MES ).
Each MES contract has a notional value of $5 x S&P 500 Index. On August 6th, the notional value of ESU5 is $31,705. Buying or selling 1 futures contract requires an upfront margin deposit of $2,135 at the time of this writing.
Micro S&P 500 futures are 1/10 in notional comparing to its E-Mini counterpart. With smaller size and lower margin requirement, the micro contracts are more approachable for non-professional traders. At the same time, they also enjoy the leverage built-in the futures contracts. Micro S&P contracts tap into the liquidity pool with the broad S&P contract suite.
Hypothetical Trade
• Short 1MESU5 at 6,341, and set a stop loss at 6450
• Trader pays $2,135 for initial margin
A “Meet” Scenario: S&P go up 1.5% to 6,436
• Short position loss: $475 (= (6436-6341) x 5)
• The maximum loss will be $545 if the S&P moves higher, due to the stop-loss feature
An “Exceed” Scenario: S&P falls 5% to 6,024
• Short position gain: $1,585 (= (6341-6024) x 5)
• The theoretical return is 74.2% (= 1585/2135), excluding transaction fees
Happy Trading.
Disclaimers
*Trade ideas cited above are for illustration only, as an integral part of a case study to demonstrate the fundamental concepts in risk management under the market scenarios being discussed. They shall not be construed as investment recommendations or advice. Nor are they used to promote any specific products, or services.
CME Real-time Market Data help identify trading set-ups and express my market views. If you have futures in your trading portfolio, you can check out on CME Group data plans available that suit your trading needs www.tradingview.com
BoJ minutes indicate more rate hikes coming, yen dipsThe Japanese yen is in negative territory on Tuesday. In the European session, USD/JPY is trading at 147.74, up 0.45% on the day.
The Bank of Japan minutes from the June policy meeting were somewhat dovish, but the yen has still headed lower today. The minutes indicated that most BoJ members favored keeping interest rates unchanged, since there were downside risks to Japan's economy due to US tariffs. Still, Governor Ueda and most members support further rate hikes down the road, provided that inflation and growth continue to increase in line with the BoJ projections.
This stance was reiterated at last week's meeting, with the BoJ signalling that it planned further rate hikes if inflation and growth increased. At the meeting, the BoJ revised up its inflation forecasts for this fiscal year to 2.7%, from 2.2% in the April forecast. The central bank also raised its growth forecast by 0.1% from the April forecast.
The June meeting took place prior to the US-Japan trade agreement, which the BoJ said has reduced trade uncertainty. The trade deal should pave the way for another rate hike before the end of the year. The BoJ reacted positively to the agreement, which applies 15% tariffs on most Japanese imports to the US.
The ISM services PMI is expected to accelerate to 51.5 in July, compared to 50.8 in June. The services sector is back in expansion territory after a rare contraction (49.9) in May. Services purchase managers pointed to the uncertainty over tariff impacts as their number one concern.
On Friday, ISM Manufacturing PMI slipped to 48.0 for July, down from 49.5 in June. This marked the fifth consecutive contraction for manufacturing.
Will The Soft NFP Data Resume the Strength of Dow Jones?Macro approach:
- The Dow Jones Industrial Average advanced this week, rebounding strongly as risk appetite improved following last week’s pullback, supported by a soft jobs report and easing global tariff concerns.
- Sentiment was aided by the Fed’s increased hopes of a near-term rate cut after Non-farm Payrolls missed expectations, prompting a 1.3% surge on Monday. Broader market sectors responded favorably to resilient earnings and softer economic prints.
- The index may remain sensitive to upcoming US inflation data, US service sector data and Fed communications, with labor market softness and further trade headlines poised to influence direction this and next week.
Technical approach:
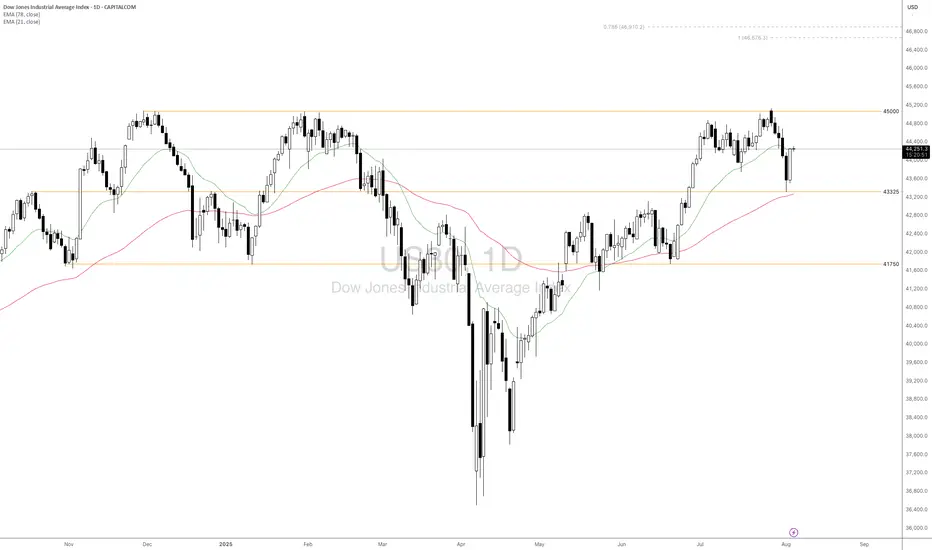
- US30 significantly rebounded yesterday, erasing half of the losses from the last 5-losing streak last week. The price is hovering around EMA21, indicating a short-term sideways momentum and await for an apparent breakout to determine the trend.
- If US30 breaks above key resistance at 45000, the price may surge further to test the Fibo Extension confluencing area around 46800.
- On the contrary, failing to hold above the support at 43325, confluence with EMA78, may prompt a deeper correction to the following support at 41750.
Analysis by: Dat Tong, Senior Financial Markets Strategist at Exness
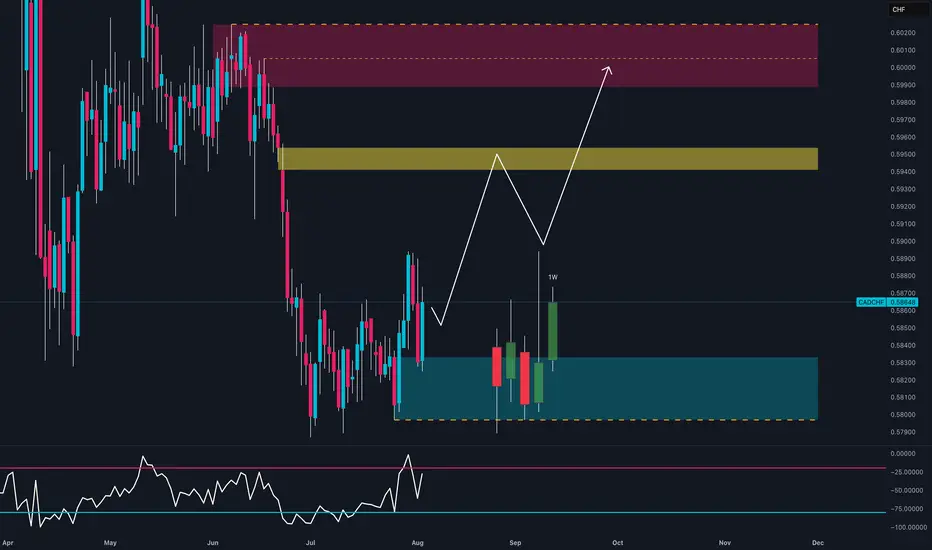
Everyone’s Short on CAD… But This Is Why I’m Going Long📊 CAD/CHF – August 4th, 2025 | Tactical Long Bias
🔹 Technical Outlook
The daily chart shows:
Strong bullish reaction within a weekly demand zone (0.5800–0.5830), confirmed by multiple lower wicks → growing buying pressure.
Weekly RSI bouncing out of oversold → potential mid-term reversal signal.
Structure may be shifting with a first target at 0.5950 (intermediate zone) and second target at 0.6000–0.6030 (major supply).
Recent bullish engulfing broke out of inside candle sequence → active technical trigger.
🧠 Commitment of Traders (COT) – July 29
Non-Commercials:
CAD: Aggressive increase in shorts (+3,888) and reduction in longs (-2,222) → heavily bearish speculative positioning.
CHF: Increase in longs (+936) and decrease in shorts (-1,095) → net bullish sentiment on CHF.
📌 However, CAD’s overstretched short positioning may lead to technical short-covering, especially if CHF starts to lose momentum.
📈 Seasonality – August
CHF: Range-bound or weak in August across all timeframes (20y, 15y, 10y).
CAD: Mild seasonal strength in August, especially on the 2y and 5y outlook.
➡️ Seasonal bias supports a tactical long on CAD/CHF during the first half of August.
✅ Trading Outlook
📌 Tactical Bias: LONG
🎯 First Target: 0.5950 → mid-level reaction zone.
🛑 Invalidation: below 0.5800 (demand breakdown).
🧠 Confluences: demand zone + RSI reversal + extreme COT positioning + seasonal support.
XAUUSD - Will Gold Continue to Rise?!Gold is trading above the EMA200 and EMA50 on the 4-hour timeframe and is trading in its medium-term ascending channel. A correction towards the demand zone would provide us with a better risk-reward buying position, and if it rises, we could consider selling it in the supply zone.
After a relatively quiet summer, the release of disappointing U.S. employment data brought a sharp shift in the gold market’s momentum, sparking a wave of optimism among Wall Street analysts. Gold ended the trading week near the short-term resistance level of $3,350—an area that, according to Kitco’s weekly survey, reflects a surge in bullish sentiment among market analysts.
This market turnaround happened rapidly. At the start of the week, gold came under selling pressure as economic data revealed that U.S. GDP grew by 3% in the second quarter. However, many economists questioned the reliability of this growth, noting its heavy dependence on volatile trade balance figures, which makes it a poor indicator of sustainable economic strength.
Midweek, another headwind emerged for gold. The Federal Reserve decided to keep interest rates unchanged, and in a press conference, Fed Chair Jerome Powell stated that no decision had been made yet regarding the September meeting. His cautious tone was captured in the statement: “We haven’t made any decisions about September.”
However, these remarks quickly lost weight. Just two days later, U.S. employment data significantly missed expectations, dramatically reshaping the outlook for monetary policy.
According to the Bureau of Labor Statistics, the U.S. economy added only 73,000 jobs in July—a number far below forecasts. Moreover, previous job gains for May and June were sharply revised downward, with a total of 258,000 jobs removed from earlier estimates. The updated figures showed only 14,000 jobs added in June and 19,000 in May. This disappointing data alone was enough to reignite expectations of a rate cut at the September meeting—an outcome that immediately boosted gold demand.
David Morrison, adopting a cautious stance, emphasized that although the jobs data favored gold, the market remains stuck in a narrow trading range, with limited evidence of a sustained short-term rally.
He explained, “Despite the significant gains last week, gold is still consolidating within a defined range. To break above $3,400 again—and more importantly, to hold it during any retracements—we’ll likely need a period of corrective volatility and price consolidation.”
Morrison also pointed out that the recent gold price rally was driven more by a sharp decline in the U.S. dollar than by internal factors within the gold market. “This sudden spike was largely a result of the unexpected downturn in the dollar following the release of the weak non-farm payroll report (NFP),” he said.
He further warned against over-interpreting a single data point: “Yes, the report has increased the odds of a rate cut in September, but we’re dealing with highly volatile data. It’s just one number—alongside a negative revision—and it can’t alone dictate the course of monetary policy.”
Meanwhile, investment bank Citi has raised its three-month gold price forecast from $3,300 to $3,500 per ounce. The expected trading range has also shifted—from $3,100–$3,500 to $3,300–$3,600.
According to Citi, this upward revision is driven by weak U.S. economic growth, heightened concerns about inflation linked to tariffs, and a weakening U.S. dollar. The bank also cited poor labor market data in Q2 and growing doubts about the credibility of the Federal Reserve and the Bureau of Labor Statistics. At the same time, investment demand for gold remains strong, with steady central bank purchases helping to sustain the metal’s favorable market position.

NAS100 - Stock Market Heading Down?!The index is trading in its medium-term ascending channel on the four-hour timeframe between the EMA200 and EMA50. However, if the index corrects upward towards the specified supply zone, it is possible to sell Nasdaq with better risk-reward.
In recent days and weeks, the Nasdaq Composite Index once again approached its historic highs, even setting a new all-time record. However, following the latest jobs data and the Federal Reserve meeting, the index experienced a price correction.
Unlike many previous bullish phases that were driven largely by short-term momentum or emotional reactions, the current upward trend in the Nasdaq reflects structural maturity and market stabilization. Institutional capital inflows and strong corporate earnings have together painted a picture of a more stable and predictable future for this index.
According to recent financial data, U.S. equity funds received over $6.3 billion in net inflows during the final week of July—marking the first positive inflow after three consecutive weeks of outflows.
The key engine behind this growth continues to be the robust performance of tech companies. Firms such as Meta, Microsoft, and AI-oriented companies like Nvidia and Broadcom posted exceptionally strong earnings reports. These results not only exceeded analysts’ expectations but also fueled significant gains in their stock prices, contributing to the Nasdaq’s momentum. Despite some sector-specific concerns—for instance, regarding Qualcomm in the semiconductor space—the broader tech sector has sustained its upward trajectory and even extended that momentum to adjacent industries, especially those involved in cloud and AI supply chains.
Meanwhile, advisors to Donald Trump revealed that he plans sweeping reforms at the U.S. Bureau of Labor Statistics (BLS). This announcement followed the July jobs report, which showed only 73,000 new jobs and sharp downward revisions to prior months’ figures.
On Truth Social, Trump accused the current BLS Commissioner, Erica McEnturfer, of politically manipulating employment data and ordered her immediate removal. Secretary of Labor Lori Chavez-DeRemer subsequently announced that Deputy Commissioner William Witrofsky would serve as acting head. Trump emphasized that economic data must be accurate, impartial, and trustworthy—and not politically skewed.
Following this leadership change, a broader debate has emerged around how employment statistics are collected and reported. While statistical revisions have long been a routine, non-political process since 1979, there are now growing questions about whether a better system for gathering and publishing this critical data could be developed.
As a nonpartisan branch of the Department of Labor, the BLS publishes its monthly employment report at 8:30 AM Eastern on the first Friday of each month. The data is gathered from surveys of around 629,000 business establishments.
Analysts have cited several reasons for the frequent need for revisions:
• Late responses from firms
• Delays from large corporations that distort preliminary figures
• Recalculations due to seasonal adjustments (e.g., holidays or weather)
• Demographic shifts impacted by immigration or deportation
• Annual revisions based on finalized tax records
With a relatively light economic calendar in the U.S. this week, traders have turned their focus to the latest developments in trade negotiations—particularly talks with countries that have yet to finalize trade agreements with Washington.
Although the U.S. has reached deals with key partners including the UK, EU, Japan, and South Korea, no formal agreement has yet been made with China to extend the current trade truce, which is set to expire on August 12.
The new U.S. tariff plan proposes a baseline 10% rate for most countries, but some—like India and Switzerland—face much higher rates of 25% and 39%, respectively. However, since implementation of the tariffs has been postponed until August 7, there’s still time for further negotiations and possible rate reductions. Sources close to the White House suggest the administration is eager to continue talks.
What’s now becoming clear is the sheer magnitude of the proposed tariff shifts—far beyond pre-trade-war averages. These changes could have more severe consequences than previously estimated, potentially pushing up U.S. inflation while simultaneously threatening global growth. As such, markets may be entering a fresh wave of volatility.
Compounding these concerns is the U.S. Treasury’s upcoming bond issuance schedule, which could add to market instability.
Also on the radar is the ISM Services PMI for July, due Tuesday. Its results will be closely watched for signs on the U.S. dollar’s direction and the Fed’s potential actions at its September meeting.
Notably, as of July 18, 2025, the widely-followed Buffett Indicator—measuring the ratio of market capitalization to GDP—was 2.3 standard deviations above its historical average. This level surpasses even the dot-com bubble era of the early 2000s. The indicator is now firmly in the “overvalued” zone, which often precedes market corrections or even crashes. For context, during the 2008 financial crisis, it was roughly 1.5 standard deviations below the historical norm.

Bitcoin - Will Bitcoin reach its previous ATH?!Bitcoin is below the EMA50 and EMA200 on the four-hour timeframe and is in its short-term descending channel. In case of an upward correction, Bitcoin can be sold from the specified supply zone, which is also at the intersection of the ceiling of the descending channel.
It should be noted that there is a possibility of heavy fluctuations and shadows due to the movement of whales in the market and compliance with capital management in the cryptocurrency market will be more important. If the downward trend continues, we can buy in the demand range.
In recent days, Bitcoin has stabilized below the $120,000 mark, a development that reflects increasing structural maturity in the market and strong institutional capital inflows. Unlike in previous cycles, where price rallies were largely driven by retail hype, the current liquidity flows are channeled through regulated and professional instruments like ETFs. During the month of July alone, Bitcoin ETFs attracted over $6 billion in inflows, marking the third-highest monthly inflow in their history. Leading this trend were BlackRock’s IBIT and Fidelity’s FBTC, which together recorded more than $1.2 billion in net inflows within a single week. This signals a shift in trust from traditional investors toward crypto markets—within transparent, traceable, and regulated frameworks.
On-chain metrics further validate this shift. The MVRV ratio, which compares market value to realized value, is currently fluctuating between 2.2 and 2.34. These levels do not indicate profit-taking extremes nor fear of major corrections, but instead point to a healthy and rationally profitable market. Meanwhile, the supply of Bitcoin held in non-exchange wallets is rising, while exchange-held balances have dropped to their lowest levels in a decade, now accounting for just 1.25% of total supply. This trend implies reduced short-term selling pressure, as coins transition from liquid to long-term holdings.
Trader behavior is also evolving. Unlike previous bull runs, profit-taking remains controlled. The SOPR index, which measures realized profit relative to purchase price, has not yet reached saturation levels. This suggests that current holders are not satisfied with existing gains and are anticipating higher price levels. Furthermore, metrics like daily active addresses remain stable, indicating a lack of speculative retail influx. The network’s current dynamics resemble those of mature traditional markets, where investment decisions are guided by analysis, discipline, and long-term perspective.
Analysts at major financial institutions believe that if this trend continues, Bitcoin could reach targets of $180,000 to $200,000 by year-end. A more conservative scenario places the $95,000 to $100,000 range as a strong support zone—especially if political, regulatory, or macroeconomic pressures intensify. Overall, the convergence of institutional capital, rational trader behavior, stable on-chain conditions, and regulatory clarity has transformed Bitcoin into a more structured and dependable asset than ever before.
Ultimately, Bitcoin is no longer just a speculative tool. It has secured its role as a legitimate asset within the portfolios of global financial institutions. Even if the pace of capital inflow is slower than in previous cycles, the underlying structure is more robust and sustainable—offering a clearer path toward broader global adoption and higher valuation.
Nonetheless, recent data from CryptoQuant suggests that long-term Bitcoin holders (LTHs) have begun net selling near the $120,000 resistance zone—a psychologically significant level in Bitcoin’s price history. Analysts interpret this as a potential sign that veteran investors—those who entered during earlier market cycles—are now realizing profits as prices reach historic highs. If short-term holders follow suit, this shift could amplify selling pressure and trigger heightened price volatility.

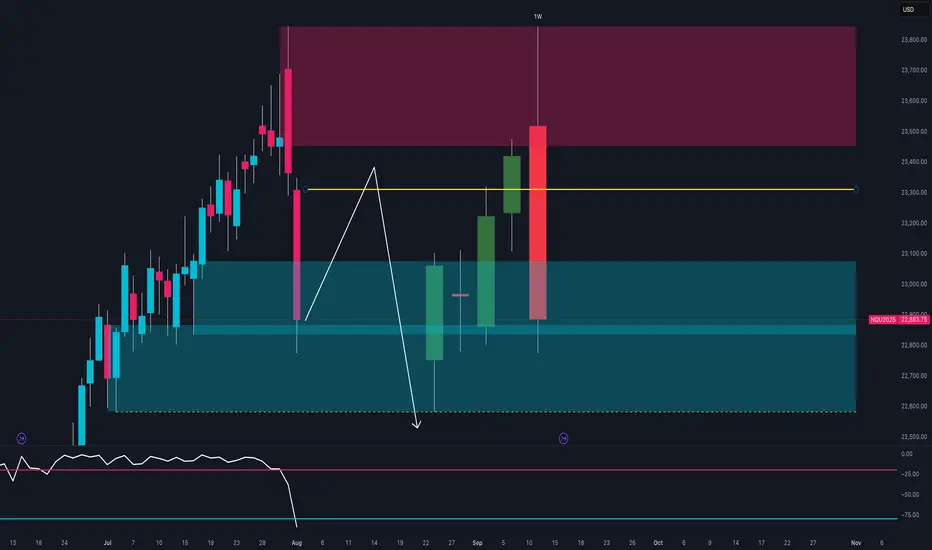
NASDAQ at Key Turning Point 🔍Technical Context
After testing the 23,600–23,800 supply zone, price printed a strong bearish rejection with a weekly engulfing candle.
The RSI broke decisively below the midline, signaling a clear loss of momentum.
Price is now trading back within the weekly demand zone between 22,800 and 22,950.
If a pullback toward 23,200 occurs, it could offer a fresh short opportunity, with downside targets around 22,600.
🪙 COT Report – July 29
Non-Commercials (speculators):
Long: +8,581
Short: +4,355
Commercials (hedging):
Long: +4,955
Short: +8,556
The market remains net long, but commercials are increasingly hedging with shorts.
The current imbalance — 88.6% long vs 11.3% short — suggests excessive bullish positioning, raising the risk of a correction.
🗓️ Seasonality – August
August is historically strong for the NASDAQ:
+222 pts (10Y)
+400 pts (5Y)
+912 pts (2Y)
While the trend is clearly bullish seasonally, caution is warranted:
Tops are often formed during the first half of August, followed by more pronounced corrections in September.
📉 Operational Summary
Primary scenario:
Wait for a retest of the 23,200–23,250 area
Look for rejection signals → enter short
Target 1: 22,800
Target 2: 22,600
Alternatively:
If 22,800 breaks on a strong weekly close, deeper downside scenarios may unfold.
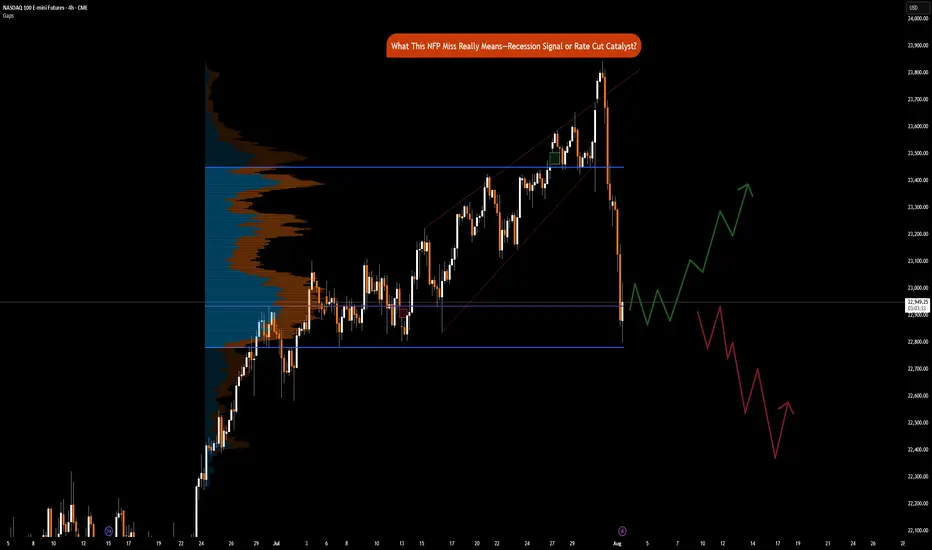
NFP Miss Implications: Recession Signal or Rate Cut CatalystCME_MINI:NQ1! CME_MINI:ES1! CME_MINI:MNQ1!
Happy Friday, folks!
Today is the first Friday of August, and that means the highly anticipated Non-Farm Payroll (NFP) numbers came in at 7.30 am CT.
US Non-Farm Payrolls (Jul) 73.0k vs. Exp. 110.0k (Prev. 147.0k, Rev. 14k); two-month net revisions: -258k (prev. +16k).
Other key labor market indicators were as follows:
• US Unemployment Rate (Jul) 4.2% vs. Exp. 4.2% (Prev. 4.1%)
• US Average Earnings MM (Jul) 0.3% vs. Exp. 0.3% (Prev. 0.2%)
• US Average Earnings YY (Jul) 3.9% vs. Exp. 3.8% (Prev. 3.7%, Rev. 3.8%)
• US Labor Force Particle (Jul) 62.2% (Prev. 62.3%)
Data and Key Events Recap:
What a year this week has been! It's been packed with high-impact economic data and pivotal central bank decisions, especially from the Federal Reserve. On top of that, trade and tariff announcements have dominated the headline.
U.S. economic data this week was broadly strong. Second-quarter GDP came in at 3.0%, beating expectations and signaling solid growth. The ADP employment report also surprised to the upside, printing 104K vs. the 77K forecast. Consumer confidence showed resilience as well, with the Conference Board’s reading rising to 97.2.
Inflation data was mixed but mostly in line. Core PCE for June rose 0.3% MoM, while the YoY reading ticked up to 2.8%, slightly above the expected 2.7%. The broader PCE Price Index also came in at 0.3% MoM, with a YoY print of 2.6%, slightly higher than forecast.
The Federal Open Market Committee (FOMC) voted to keep the federal funds rate target range unchanged at 4.25% – 4.50%. Notably, Governors Waller and Bowman dissented, favoring a 25-basis-point rate cut as expected, however, marking the first dual dissent by governors since 1993.
Changes to the FOMC Statement included a downgraded assessment of economic growth, reflecting slower real consumer spending. The Committee reiterated that uncertainty around the economic outlook remains elevated. It maintained its view of the labor market as "solid" and inflation as "somewhat elevated." Forward guidance remained unchanged, emphasizing the Fed’s readiness to adjust policy as necessary while continuing to monitor risks to both sides of its dual mandate.
Here’s a summary of key points from the FOMC press conference:
• On current policy stance:
“We decided to leave our policy rate where it’s been, which I would characterize as modestly restrictive. Inflation is running a bit above 2%... even excluding tariff effects. The labor market is solid, financial conditions are accommodative, and the economy is not performing as if restrictive policy is holding it back.”
Chair Powell commented on the need to see more data to help inform Fed’s assessment of the balance of risks and appropriate Fed Funds rate.
• On labor market risks:
“By many statistics, the labor market is still in balance... You do see a slowing in job creation, but also a slowing in the supply of workers. That’s why the unemployment rate has remained roughly stable.”
• On inflation and tariffs:
“It’s possible that tariff-related inflationary effects could be short-lived, but they may also prove persistent. We’re seeing substantial tariff revenue—around $30 billion a month—starting to show up in consumer prices. Companies intend to pass it on to consumers, but many may not be able to. We’ll need to watch and learn how this unfolds over time.”
Trade Headlines:
US President Trump announced tariffs on countries ranging from 10%-41%. Average US tariff rate now at 15.2% (prev. 13.3%; 2.3% pre-Trump), according to Bloomberg. US officials said that if the US has a surplus with a country, the tariff rate is 10% and small deficit nations have a 15% tariff, US officials said they are still working out technicalities of rules of origin terms for transshipment and will implement rules of origin details in the coming weeks. No details on Russian oil import penalty. Sectoral Tariffs White House said new reciprocal tariff rates take effect on Friday. Although Canada’s tariffs were increased to 35%, excluding USMCA goods, the effective rate is only 5%.
The economic data is showing strength, on the contrary, tariffs announcements for most countries have now been announced. Investors need to consider that tariffs are not just a tool to reduce trade deficit, it is also a geopolitical tool presently being used to shape alliances. The US wants to soften BRICS, China and Russian influence on the world stage.
Key to note is that these tariffs are substantially lower than what was announced on April 2nd, 2025.
The key question now remains, do participants buy the dip or ‘sell the fact’ is the current playbook?
Market Implications
Given the prior revisions in NFP data of -258K, July’s payroll came in at 73K, missing forecasts of 110K. What does this mean for markets? Markets are now pricing in 75% chance of a September rate cut. Prior revisions along with the current job market slowing down imply that risks to the downside are substantially increasing. Fed’s current policy is not just moderately restrictive but rather it may likely tip the US into a recession if Fed Funds rates remain elevated. The Chair asked to see more data, and here it is but I do wonder why they did not take this data into account for the July meeting. Surely, it would have been available to them.
Another question to ask would be, is it due to defiance of rate cut calls by the US administration? Is the Fed already behind the curve?
Fed’s dual mandate targets inflation and maximum employment. While inflation is sticky, the Fed may need to abandon their 2% mandate in favor of average inflation of 2.5% to 3%. A less restrictive policy will provide needed stimulus along with the fiscal stimulus provided via the BBB bill.
This drastically changes, in our analysis, how investors position themselves heading into the remainder of the year.
Markets (equities) may retrace slightly but the dip in our opinion will still be the play given weaker labor market data and increased rate cut bets. The bad news here means that the Fed has the data it wants to see to start cutting. Market pricing in 2 cuts seems to be the way forward for now.
You've Already Lost: The Bitcoin Delusion of FOMO and False HopeLet’s get one thing straight: if you’re staring at Bitcoin, squinting past the red flags, and convincing yourself it’s not a Ponzi scheme because of that one shiny feature that screams “legit,” you’re not investing—you’re auditioning for the role of “next victim.” And if your motivation is the fear of missing out (FOMO) or the fantasy of getting rich quick, well... congratulations. You’ve already lost.
The 99%: Red Flags Waving Like It’s a Parade
Let’s talk about the indicators—the ones that make Bitcoin look suspiciously like a Ponzi scheme. No, it’s not technically one, but the resemblance is uncanny:
- No intrinsic value: Bitcoin isn’t backed by assets, cash flow, or a government. It’s worth what the next person is willing to pay. That’s not investing. That’s speculative hot potato.
- Early adopters profit from new entrants: The people who got in early? They’re cashing out while newcomers buy in at inflated prices. That’s the classic Ponzi dynamic: old money out, new money in.
- Hype over utility: Bitcoin’s actual use as a currency is minimal. It’s slow, expensive to transact, and volatile. But hey, who needs functionality when you’ve got memes and moon emojis?
- Opaque influencers: From anonymous creators (hello, Satoshi) to crypto bros promising Lambos, the ecosystem thrives on charisma, not accountability.
- Scam magnet: Bitcoin has been the currency of choice for over 1,700 Ponzi schemes and scams, according to a University of New Mexico study cs.unm.edu . That’s not a coincidence. That’s a pattern.
The 1%: The “But It’s Decentralized!” Defense
Ah yes, the one redeeming quality that Bitcoin evangelists cling to like a life raft: decentralization. No central authority! No government control! It’s the financial revolution!
Except… decentralization doesn’t magically make something a good investment. It just means no one’s in charge when things go wrong. And when the market crashes (again), you can’t call customer service. You can tweet into the void, though.
FOMO: The Real Engine Behind the Madness
Let’s be honest. Most people aren’t buying Bitcoin because they believe in the tech. They’re buying because they saw someone on TikTok turn $500 into a Tesla. FOMO is the fuel, and social media is the match.
Bitcoin’s meteoric rises are often driven by hype cycles, not fundamentals. Tesla buys in? Price spikes. El Salvador adopts it? Price spikes. Your cousin’s dog walker says it’s going to $1 million? Price spikes. Then it crashes. Rinse, repeat.
This isn’t investing. It’s gambling with a tech-savvy twist.
The Punchline: You’ve Already Lost
If you’re ignoring the overwhelming signs of speculative mania and clinging to the one feature that makes you feel better about your decision, you’re not ahead of the curve—you’re the mark. And if your motivation is “I don’t want to miss out,” you already have. You’ve missed out on rational thinking, due diligence, and the ability to distinguish between innovation and illusion.
Bitcoin might not be a Ponzi scheme in the legal sense. But if it walks like one, talks like one, and makes early adopters rich at the expense of latecomers… maybe it’s time to stop pretending it’s something else.
INDEX:BTCUSD NYSE:CRCL NASDAQ:HOOD TVC:DXY NASDAQ:MSTR TVC:SILVER TVC:GOLD NASDAQ:TSLA NASDAQ:COIN NASDAQ:MARA

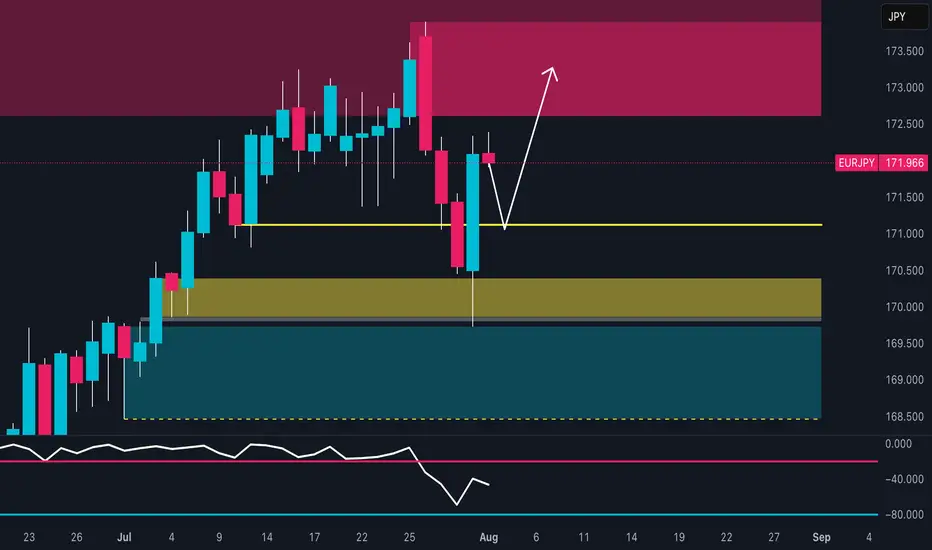
EUR/JPY Setup: Retail is 82% Short – Squeeze First, Drop After?🔹 Technical Context
Price reacted with a strong bullish wick in the 169.50–170.30 demand zone, signaling clear buyer defense. The RSI bounced from weakness but remains subdued, showing limited momentum.
📍 Current price action suggests a potential retest of the 172.50–173.30 area, which aligns with a supply zone, before a possible directional decision is made.
🗓️ Seasonality
Historically, August tends to be bearish for EUR/JPY:
5Y average: -0.48%
10Y average: -0.12%
15Y/20Y averages: -1.3% and -1.2%
📉 Seasonality indicates potential weakness, especially in the second half of the month.
🪙 COT Report (EURO & YEN) – July 22
EURO: Strong long accumulation by non-commercials (+6,284) and commercials (+17,575)
JPY: Net decline in both longs (-1,033) and shorts (-4,096), with a drop in total open interest
🧠 The market is heavily positioned on the Euro, while Yen positioning is fading. This creates a divergence between the two currencies, favoring a short-term technical bounce on EUR/JPY, though downside risks remain in the mid-term.
📉 Sentiment
82% of retail traders are short EUR/JPY
Volume: 1,564 lots short vs 352 lots long
📣 This extreme sentiment imbalance suggests a potential short-term squeeze against retail traders.
📊 Market Mood & DPO
Overall mood: Neutral
DPO at -9.0, Wyckoff score below 50
Momentum remains weak, but not showing a clear divergence.
🧩 Operational Summary
Retest of the 172.50–173.30 supply zone
Likely exhaustion in that area
Ideal setup: rejection + bearish confirmation
→ Targets: 170.30, then 169.00
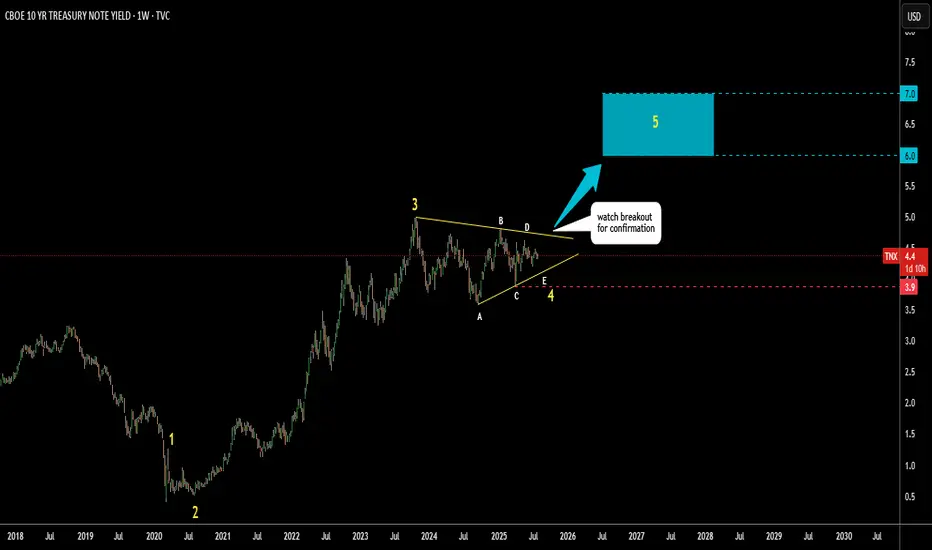
US 10Y yield: Triangular Consolidation, next 6-7%I’ve spotted a well-known triangular pattern forming on the US 10-year Treasury yield.
This appears to be the development of a large Wave 4.
Wave E of Wave 4 may still be unfolding.
Watch to see if it holds above the Wave C low at 3.9%.
A breakout above resistance near 4.7% would confirm the pattern.
The target zone is set between the 38.2% and 61.8% retracement levels of Waves 1 to 3,
highlighted with a blue box between 6% and 7%.
Could tariffs cause a major spike in yields—or will something else trigger it?
Share your thoughts in the comments below.
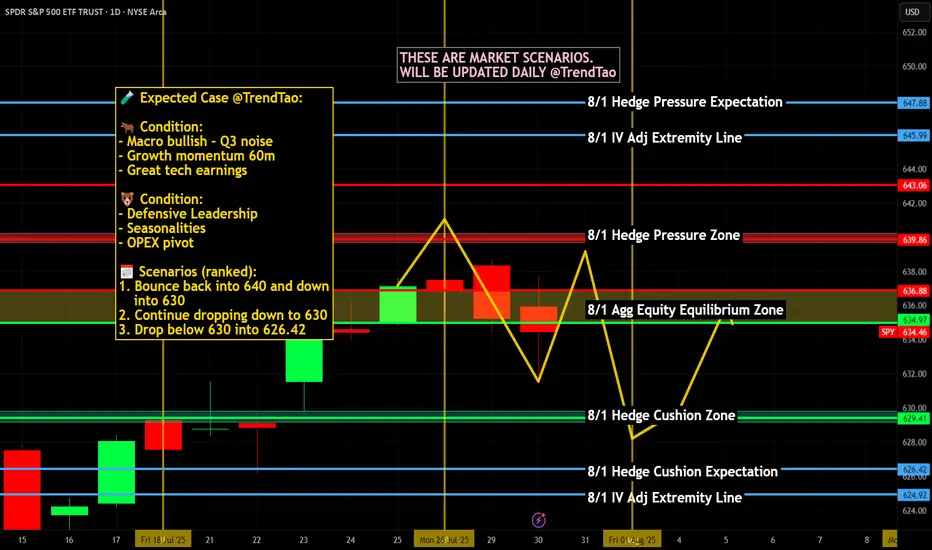
Nightly $SPY / $SPX Scenarios for July 31, 2025🔮 Nightly AMEX:SPY / SP:SPX Scenarios for July 31, 2025 🔮
🌍 Market-Moving News 🌍
🏦 Fed Holds Rates — Dissent Indicates Division
The Federal Reserve maintained its benchmark rate at 4.25%–4.50%. Notably, two governors—Christopher Waller and Michelle Bowman—dissented in favor of a 25 bp rate cut, underscoring internal divisions amid growing political pressure
📈 Strong Q2 Growth, But No Rate-Cut Signal
U.S. GDP expanded at a 3.0% annualized rate in Q2, rebounding sharply from Q1's contraction. Despite this, Powell emphasized persistent inflation, particularly from tariffs, reinforcing the Fed’s cautious policy stance
🛢️ Oil Climbs as Tariff Tensions Rise
Brent crude rose to ~$73.51 and WTI to ~$70.37 on fears of supply disruptions tied to President Trump’s threats of new tariffs on Russian oil and new tariffs imposed on Brazil and South Korea
📊 Key Data Releases & Events 📊
📅 Thursday, July 31:
8:30 AM ET – Initial Jobless Claims (week ending July 26)
Initial claims rose to 222,000, up from 217,000 previously—an early gauge of labor-market trends
8:30 AM ET – Employment Cost Index (Q2)
Quarterly growth in labor costs edged lower to 0.8%, down from 0.9%—a signal of moderate wage pressures
8:30 AM ET – Personal Income (June)
Data released on household income and spending patterns—crucial for assessing consumer resilience heading into Q3
⚠️ Disclaimer:
This information is for educational and informational purposes only and should not be construed as financial advice. Always consult a licensed financial advisor before making investment decisions.
📌 #trading #stockmarket #economy #Fed #inflation #jobs #technicalanalysis
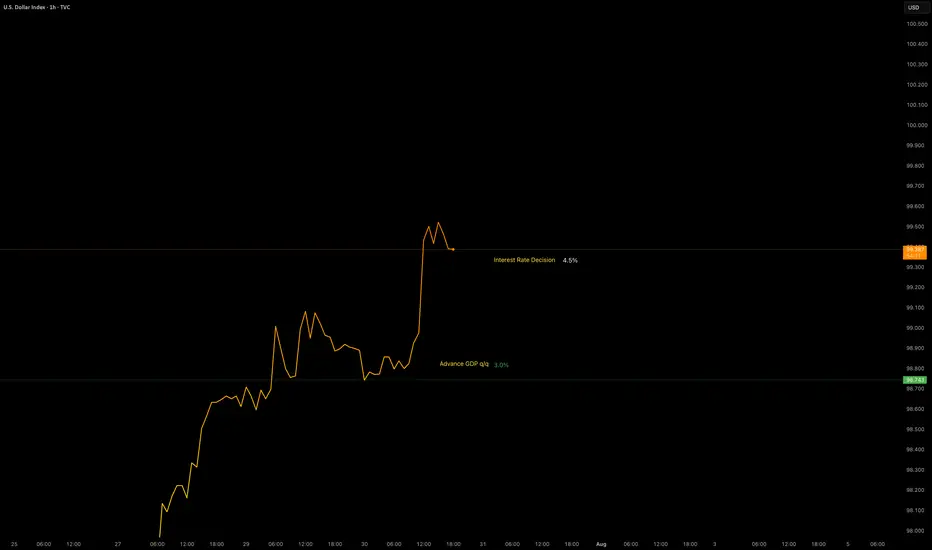
Data Release - Interest Rate DecisionJul 30 2025: Interest Rate Decision (4.5%)
Rates remain unchanged as expected.
OANDA:XAUUSD remains bearish with the help of GDP data.
TVC:DXY remains bullish with the help of GDP data. No major changes in either pairs.
Volatility is increased.
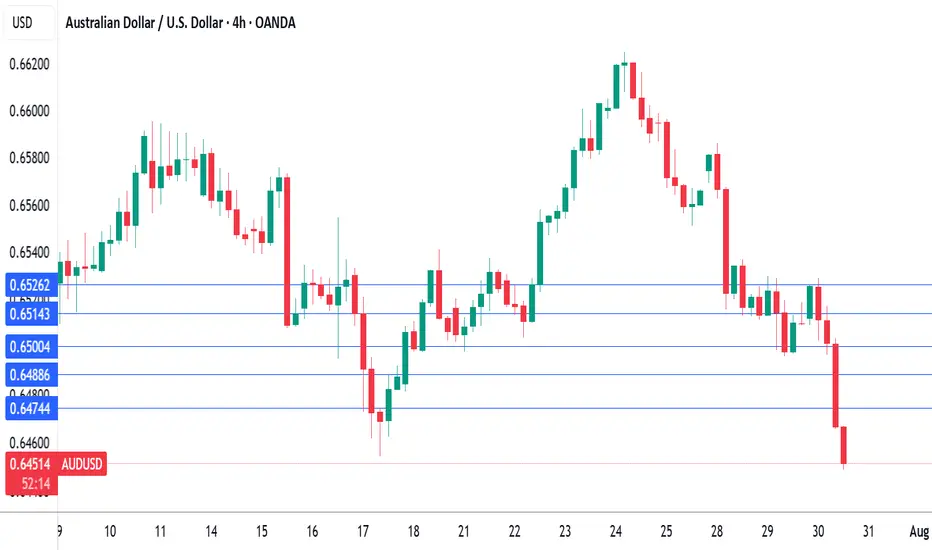
Australian inflation lower than forecast, Fed up nextThe Australian dollar is showing limited movement. In the European session, AUD/USD is trading at 0.6500, down 0.15% on the day.
Australia's inflation rate for the second quarter came in lower than expected. Headline CPI dropped to 2.1% y/y, down from 2.4% in the prior two quarters and falling to its lowest level since Q1 2021. This was just below the market estimate of 2.2%. Quarterly, CPI rose 0.7% in Q2, down from 0.9% in Q1 and below the market estimate of 0.8%.
Services inflation continued to decline and fell to 3.3% from 3.7%. The drop in CPI was driven by a sharp drop in automotive fuel costs. The RBA's key gauge for core CPI, the trimmed mean, slowed to 2.7% from 2.9%, matching the market forecast. This was the lowest level since Q4 2021.
The positive inflation report is a reassuring sign that inflation is under control and should cement a rate cut at the Aug. 12 meeting. The Reserve Bank of Australia stunned the markets earlier this month when it held rates, as a quarter-point cut had been all but certain. Bank policymakers said at that meeting that they wanted to wait for more inflation data to make sure that inflation was contained and today's inflation report should reassure even the hawkish members that a rate cut is the right move at the August meeting.
The Federal Reserve meets today and is widely expected to maintain the benchmark rate for a fifth straight meeting. Investors will be looking for clues regarding the September meeting, as the markets have priced in a rate cut at 63%, according to CME's FedWatch.
EURUSD ahead of the FEDEURUSD remains below the 1,1600 level following the trade agreement between the US and the European Union.
Today, all eyes are on the FED’s decision regarding interest rates.
Watch for a reaction around the support zone, as it may present an opportunity for the trend to continue.
However, it's advisable to reduce risk and hold off on new entries until after the news is released.

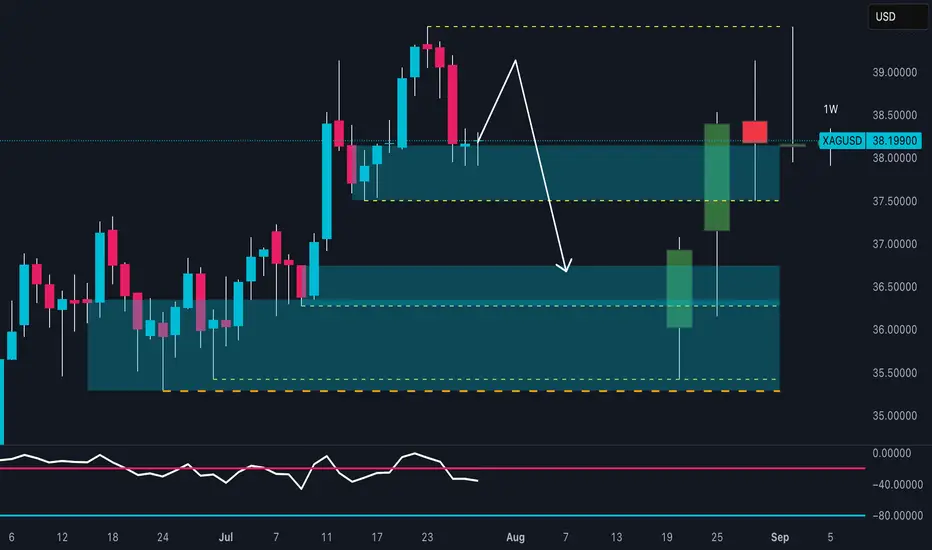
SILVER Is About to Collapse? Watch This Critical Supply Zone!Price recently tapped a high near 39.20 before sharply rejecting from the 38.80–39.20 supply zone, confirming strong selling pressure. The current structure shows:
- Supply zone tested and rejected
- Likely return to the previous demand zone (36.50–36.00)
- RSI is turning down, confirming loss of momentum
A pullback toward 38.30–38.50, followed by a bearish continuation toward the 36.50 area, which acts as a key structural and institutional support.
🗓️ Seasonality
Historically, July is bullish for silver:
Last 5Y average: +0.89%
Last 2Y average: +2.18%
However, August–September are bearish months:
August: mildly positive, but weak
September: consistently negative across all time frames (-0.86% to -1.10%)
This increases the probability of a downward move starting in early August, in line with current price action rejection.
🪙 Commitment of Traders (COT) – July 22
Non-Commercials (speculators):
Longs: +656
Shorts: -516
Commercials (hedging):
Longs: +1,337
Shorts: +916
➡️ Commercials are increasing both long and short exposure, while non-commercials remain net long — a sign of moderate optimism.
However, long positioning is slowing down compared to previous weeks. A potential exhaustion in bullish momentum is forming.
📉 Sentiment
52% short vs 48% long
Volume: more lots on the short side (492 vs 454)
Sentiment remains neutral to slightly contrarian bullish, but not extreme. This may allow for a fake breakout before a deeper move down.
🧩 Operational Summary
Main bias: Bearish short to mid-term (starting August), supported by:
- Technical rejection at supply
- Negative seasonal tendencies ahead
- RSI showing momentum loss
- COT showing stabilization, not accumulation