Gold: Under Attack, Key Support in DangerThe gold market is experiencing significant volatility, with prices undergoing a correction after approaching multi-month highs. Currently, XAU/USD is trading around $2,740, below the key resistance at $2,790, as recent declines reflect a mix of profit-taking, technical pressures, and macroeconomic factors. Recent selling has triggered a natural correction after prices neared significant resistance levels, while expectations for Federal Reserve rate cuts have been scaled back, strengthening the US Dollar and putting further pressure on gold prices. Algorithmic trading has also amplified the declines. Market sentiment has been impacted by comments from the US President regarding tariffs, which have boosted the dollar and reduced demand for gold as a safe haven. Additionally, weak PMI data from China in January has indicated economic contraction, fueling global risk sentiment and further weighing on gold.
Despite the recent drop, gold previously benefited from a weaker dollar and geopolitical tensions, which pushed prices near record highs. However, trade concerns and the recent strengthening of the dollar have reversed this trend. Technically, gold finds provisional support around $2,730, although further bearish pressure could push it toward $2,700 or lower. The key resistance at $2,790 remains challenging to breach without positive macroeconomic momentum or a weaker dollar, while $2,730 acts as the first defensive level, followed by $2,700, which could serve as a stronger base.
Traders should focus on upcoming events, including the Federal Reserve's rate decision on January 29, which will directly influence the dollar and, consequently, gold prices. A more hawkish stance could intensify pressure on gold. The European Central Bank’s decision on January 30 could also shift global sentiment, while US Q4 GDP data may play a role, as strong growth figures could further support the dollar and limit gold’s upside potential. Gold is currently in a correction phase, and while key resistance stands at $2,790, support near $2,730 remains crucial. If this support level breaks, gold could face additional downside pressure, though signs of a global economic slowdown or dovish signals from central banks could spark a recovery.
Fed

XAUUSD - Gold Enters the Last Week of January!On the 4-hour timeframe, gold is above the EMA200 and EMA50 and is in its ascending channel. If gold rises to the previous ATH, we can look for selling positions at the ceiling indicated by the target of the midline of the ascending channel. A correction of gold towards the demand zone will provide us with its next buying position.
Last week, the gold market showcased one of its most stable and impressive performances in recent months, seemingly adapting to the shocks and uncertainties introduced by the newly established U.S. administration.
Darin Newsom, Senior Market Analyst at Barchart.com, highlighted that given global markets’ reaction to the unpredictability of the new U.S. president, there appear to be few barriers to new record highs for gold. He stated, “At this point, we can set aside technical and fundamental analysis. Gold is acting as a safe haven against the chaos stemming from the new U.S. government. No one knows what the next statement or action will be.”
According to the latest U.S. Purchasing Managers’ Index (PMI) report released by S&P Global, the services sector index dropped to 52.8, marking its lowest level since April of last year and falling below market expectations of 56.5. Meanwhile, the manufacturing PMI rose to 50.1, exceeding the forecasted 49.7. The composite PMI also decreased to 52.4.
Although confidence in the services sector has declined from its 18-month peak in December, it remains the second-highest level recorded in the past year.Additionally, the services sector experienced the fastest rate of job creation in 30 months. Input costs and selling prices across sectors also rose at the fastest pace in four months.
Chris Williamson, Chief Economist at S&P Global, commented on the data, stating that U.S. businesses began 2025 with optimism about the new administration’s policies. In particular, growth expectations in the manufacturing sector have increased due to anticipated government support. He also noted that while GDP growth slowed slightly in January, sustained business confidence suggests this slowdown may be temporary. The rise in hiring rates, driven by improved business outlooks, is another encouraging sign.
However, Williamson warned about increasing inflationary pressures. Companies reported that rising supplier costs and higher wages, driven by labor shortages, have led to price increases. If this trend continues, concerns about inflation could intensify, prompting the Federal Reserve to adopt more hawkish policies.
Rich Checkan, President and COO of Asset Strategies International, predicted that gold might experience a price correction in the short term. He explained, “While the long-term trend for gold remains bullish, thanks to the mismanagement of fiat currencies, I anticipate a price correction this week. Gold has approached historical highs today, but uncertainties surrounding the upcoming Federal Open Market Committee (FOMC) meeting could prompt investors to take profits, leading to a temporary price pullback.”
This week, officials from major central banks worldwide will convene to make critical decisions. These meetings come as discussions about President Trump’s tariff threats resurface. The Federal Reserve, the European Central Bank (ECB), and the Bank of Canada (BoC) are all scheduled to hold their monetary policy meetings this week.

XAGUSD - Silver on the verge of a big week?!Silver is trading in its ascending channel on the 4-hour timeframe, between the EMA200 and EMA50. If the correction continues, we could see a break of the channel bottom. A consolidation above $30.8 would provide a path for silver to rise to the supply zone, where we can sell at a risk-reward ratio.
According to the annual report by StoneX Financial, silver has been highlighted as one of the top-performing metals among both precious and industrial metals in 2025.Benefiting from its dual nature as a monetary and industrial asset, silver is set to gain from rising gold prices and strong industrial demand. In the report, Rhona O’Connell, Head of Market Analysis at StoneX, and Natalie Scott-Gray, Senior Base Metals Analyst, forecasted that silver, alongside copper and tin, will outperform other metals in 2025.
Despite strong performance in 2024, with a 22% growth, silver is expected to continue its upward trajectory in 2025 as the top-performing metal. This projection is based on robust market fundamentals and promising future prospects that have attracted the attention of investors. Part of this growth stems from the long-term outlook for the solar industry, although new U.S. government policies might slow this trend.
Investment in silver is expected to remain strong, potentially even outpacing gold. While gold is predicted to peak this year, silver is anticipated to keep growing, with a price target of $33 by the end of 2025.
Copper and tin have also garnered attention due to their critical roles in the transition to green energy and digitalization. On the other hand, aluminum has been identified as a metal requiring cautious investment.
The report notes that silver has historically been recognized as a precious metal due to its history as a form of currency and its use in jewelry. According to the authors, “Silver’s relationship with gold has always played a key role in its price behavior, but in reality, this relationship is more complex.” They added, “Throughout much of last year, silver behaved like a precious metal during bullish trends and like a base metal during bearish ones. Statistical analysis confirms this. During U.S. economic recessions, silver’s price performance and correlation with gold and copper show that, more often than not, silver traded more in line with copper than gold. In inflationary periods, the opposite was true.”
StoneX attributes this to two primary reasons. They explained, “Firstly, the nature of silver’s supply, which is predominantly derived as a byproduct of base metals or from industrial scrap, prevents it from having a clearly defined equilibrium price in the market. Secondly, a small group of investors sees silver as an accessible way to capitalize on gold’s price volatility.”
They highlighted that “President-elect Trump’s suggestion that Mexico and Canada could face tariffs was enough to unsettle the market, even if these were likely negotiating stances rather than definitive decisions. Mexico accounts for approximately 25% of U.S. silver imports, and Canada accounts for 10%. Just the idea of such tariffs was enough to drive silver prices higher. However, as is often the case with silver, this movement was short-lived. This metal remains one of the most vulnerable to rapid and reactive price swings and should always be approached with caution.”
They concluded, “Silver will continue to respond to any significant activity in the gold market and will also see further transitions this year due to the ongoing fundamental investment deficit growth. While it may face headwinds from European recession and potential oversupply of solar cells, its long-term outlook remains bright, likely continuing to attract investors and speculative funds.”
Meanwhile, Lee Hardman, an analyst at MUFG Bank, noted that the depreciation of the dollar, following Trump’s statement that he would “prefer” not to impose new tariffs on China, might be limited. He argued that Trump is still likely to implement higher tariffs.
Trump has called for lower interest rates and a weaker dollar to support the U.S. economy. However, his policies of higher tariffs, stricter immigration controls, and tax cuts, if enacted, “are likely to bolster U.S. yields and the dollar for a longer period.” In an interview with Fox News, Trump stated that he “prefers” not to impose new tariffs on China, suggesting the possibility of a trade deal.

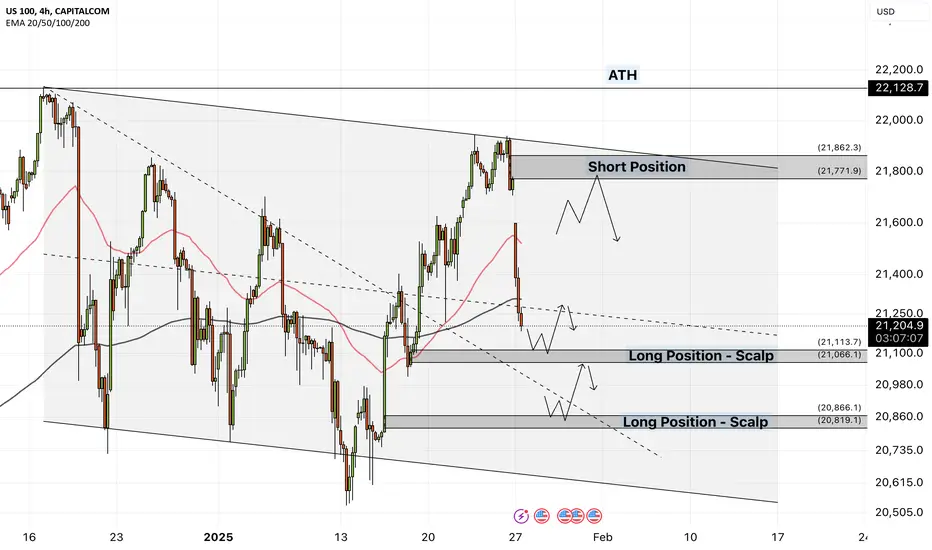
NAS100 - Is Nasdaq on track to record a new ATH?!The index is trading below the EMA200 and EMA50 on the 4-hour timeframe and is trading in its descending channel. If the index corrects towards the supply zone, we can look for further short positions on Nasdaq with a risk-to-reward ratio. Nasdaq’s position in the demand zone will provide us with short-term buying conditions.
President Trump announced that the U.S. government plans to invest $500 billion in artificial intelligence infrastructure. This project, carried out in collaboration with companies such as OpenAI, Oracle, and SoftBank, aims to create 100,000 jobs.Trump also pledged to support the project through emergency declarations.
OpenAI, along with SoftBank, Oracle, NVIDIA, and ARM, announced the start of their collaboration in technology development. This partnership includes Microsoft’s commitment to Azure, with plans extending until 2030.
Microsoft confirmed that it will maintain its strategic partnership with OpenAI and participate in the Stargate project. This collaboration includes new agreements granting Microsoft priority rights to utilize the new capacity. Additionally, Microsoft will leverage OpenAI’s intellectual property (IP) in its products, such as Copilot.
This week’s economic calendar is dominated by major events related to central banks. The U.S. Federal Reserve and the Bank of Canada will announce their interest rate decisions on Wednesday, while the European Central Bank will follow on Thursday.
Additionally, several significant economic reports are expected. On Monday, data on new home sales for December will be released. On Tuesday, reports on durable goods and the Consumer Confidence Index will be published. On Thursday, the U.S. GDP for Q4, weekly jobless claims, and pending home sales data will be announced. Finally, on Friday, the PCE index (the Fed’s preferred measure of inflation), along with personal income and spending reports, will be released.
It is projected that the U.S. economy will grow at an annualized rate of 2.6% this quarter, compared to 3.1% in the previous quarter. If the data surpass expectations, the likelihood of the Fed adopting expansionary policies may decrease. Similarly, inflation data from the PCE index and consumer income and spending reports on Friday will play a crucial role in shaping expectations for rate cuts.
Unlike the European Central Bank and the Bank of Canada, the Federal Reserve is expected not to reduce interest rates. The robust U.S. economy and inflationary pressures have left the Fed with limited room to lower borrowing costs. This situation existed even before Trump’s administration and the Republican-led Congress implemented tax cuts and tariff hikes.
Federal Reserve Chairman Jerome Powell has stated that the Fed has no predetermined path and may raise interest rates if new government policies lead to higher inflation. However, inflationary pressures have recently eased and could continue to decline in early 2025. Christopher Waller, a prominent Fed official, recently hinted at a possible rate cut in the first half of the year, but market reactions to his comments were muted, with only minor dollar weakening following news of Trump’s tariffs.
Several major companies are set to release their quarterly financial updates this week. Among them are some members of the Magnificent 7, as well as leading firms in technology, energy, finance, and manufacturing. Microsoft, Meta, and Tesla are scheduled to report on Wednesday, while Apple will release its financial information on Thursday.
Tesla’s report comes as Elon Musk, its CEO, has taken on a role in President Trump’s administration. The company’s recent vehicle delivery data fell short of analysts’ expectations.
Microsoft’s planned report follows last week’s announcement of a $500 billion AI initiative, which includes Microsoft-backed OpenAI. Meta’s report comes as the company raises its investment forecasts for emerging technologies such as AI. Meanwhile, Apple’s report is being released amid analysts’ downgraded ratings due to concerns about demand for its new iPhones.
BoJ hikes rates, yen pares gainsThe Japanese yen gained as much as 0.8% earlier today but has failed to consolidate these gains. In the European session, USD/JPY is trading at 156.03, dwon 0.02% on the day.
The Bank of Japan hiked its policy rate by 25 basis points earlier today, as expected. This brings the policy rate to 0.5%, its highest level since October 2008, during the global financial crisis. The Japanese yen climbed sharply after the decision but was unable to consolidate these gains.
The BoJ has been signaling that it planned to raise rates at today's meeting, although the BoJ tends to surprise the markets and a rate hike, while expected, was not a given. The BoJ statement expressed hope that this year's wage negotiations would result in strong wage increases, as was the case last year. Governor Ueda has said in the past that he would raise rates provided that inflation was driven by higher wages, which would show that inflation was sustainable. Wage growth has been moving higher and this resulted in today's rate hike.
Japan's inflation rate has been moving higher and the December inflation report, which came out today, showed core CPI climbed to 3%, up from 2.7% in November and in line with the market estimate. The core rate has hovered above the BoJ's 2% target for 2.5 years and at today's meeting, the BoJ upgraded its inflation outlook to above 2% until 2026.
Predictably, Governor Ueda didn't provide a timeline for the next rate hike at his post-meeting press conference, but a May rate hike is on the table if the wage negotiations result in higher wages and inflation does not weaken unexpectedly. Another key factor in the timing of the next rate hike will be President Trump's trade policy. Trump had promised to levy tariffs on US trading partners on his first day in office but has delayed the tariffs until at least Feb. 1. The BoJ will want to see which direction Trump's trade policy is going before raising rates again.
There is support at 154.78 and 153.27
156.49 and 158.00 are the next resistance lines

Brent - What will Trump's oil policies be?!Brent oil is in the 4-hour timeframe, between EMA200 and EMA50 and is moving in its medium-term ascending channel. We will look for oil selling opportunities on the supply zone. If the $75 level is broken, we can see the continuation of the downtrend. On the other hand, we can buy in the demand zone with a risk-reward approach.
When Donald Trump launched his election campaign, he threatened to impose 25% tariffs on America’s largest trading partners unless they addressed their trade surpluses with the U.S. Analysts described this idea as risky. However, Bloomberg has reported that, while this strategy is far from subtle, it has proven effective.
This threat turned importers into U.S. customers. Energy importers from Asian countries began purchasing more crude oil and liquefied natural gas (LNG) from the United States, aiming to appease Trump before he took any action on tariffs.
Saul Kavonic, an energy analyst at MST Marquee, told Bloomberg that U.S. trading partners view LNG purchases as a tool for negotiating tariffs with the Trump administration. He added that since last November’s election, orders for U.S. energy shipments have risen.
Shortly after the election, Trump specifically suggested that the European Union should buy more LNG from the U.S. to offset its significant trade surplus. At the time, Ursula von der Leyen, President of the European Commission, stated there was no reason why the EU couldn’t replace Russian LNG with American liquefied gas. However, her statement was perhaps not the most well-considered.
The EU’s preference for Russian LNG and its hesitation toward American LNG primarily stems from pricing issues. Even this year, the region’s purchases of Russian LNG have reached record levels. As reported by the Financial Times earlier this week, the EU is highly sensitive to price considerations. According to an EU official, price remains a critical and determining factor.
Bernd Lange, head of the European Parliament’s trade committee, previously remarked that Europe’s demand for LNG could align with America’s eagerness to sell more.He added that discussions on this issue are feasible. Trump has consistently emphasized his interest in deals that benefit the United States above all.
On his first day in office, Trump revoked Biden’s executive order that halted permits for new LNG export capacity. This decision will expand U.S. export capacity over the next four years, potentially lowering prices depending on demand levels.
The World Trade Organization’s chief warned that reciprocal tariff retaliation could result in a double-digit reduction in global GDP, a scenario that would have catastrophic consequences.

Bank of Japan expected to raise rates, yen calmThe Japanese yen is slightly lower on Thursday. In the European session, USD/JPY is trading at 156.25, down 0.16% on the day.
All eyes are on the Bank of Japan, which meets early on Friday. The BoJ is expected to raise interest rates by 25 basis points which would bring the cash rate to 0.50%. The BoJ has said that it will raise rates if it sees higher wage growth, which would indicate that inflation is sustainable. BoJ policymakers have expressed confidence that wages are moving higher and Deputy Governor Himino said last week that many firms plan to raise wages at least as much as last year.
Investors will be keeping a close eye on the BoJ's rate statement. The tone of the statement could be dovish as BoJ policymakers are concerned about President Donald Trump's threats to levy trade tariffs as early as Feb. 1, a move which could destabilize the financial markets. The BoJ will have to be cautious as it gauges the 'Trump factor".
Another factor supporting a rate hike is the poor performance of the Japanese yen, which has declined around 9% in the past three months. The Federal Reserve is sounding more hawkish and might raise rates only once or twice this year. If the BoJ stays on the sidelines again, the yen could fall further.
Overshadowed by the BoJ meeting, Japan releases December core CPI. Japan's core inflation rate has been climbing higher and is expected to climb to 3% y/y, up from 2.7% in November which was a three-month high. The core rate, which is closely watched by the BOJ, has hovered above the central bank's target of 2% for over two years.
USD/JPY is testing support at 156.20. Below, there is support at 155.68
157.04 and 157.56 are the next resistance lines

XAUUSD - Gold Awaits Weekend Data Releases?!Gold is trading above the EMA200 and EMA50 on the 4-hour timeframe and is in its ascending channel. If gold rises towards the channel ceiling and supply zones, we can look for short positions targeting the channel midline.
The gold market has kicked off 2025 with one of its best starts since 2023 and is on track to achieve its strongest monthly performance since September. Prices are currently testing the high range near $2,750 per ounce.
A fund manager noted that this robust start to January could signal another strong year for the precious metal, even after gold recorded a 27% price increase last year.
In his 2025 outlook report, Eric Strand, founder of the precious metals-focused AuAg Funds, projected that gold prices will surpass $3,000 per ounce this year. He stated: “We expect gold to break the $3,000 barrier during the year and possibly reach even higher levels by year-end, with a realistic target of $3,300.” Strand’s bullish target represents a 20% increase from current levels.
Strand suggested that the new Trump administration might usher in a period of more accommodative monetary policies and larger government stimulus programs. In his report, he explained: “Both Donald Trump and Elon Musk have built their empires on extensive borrowing while driving forward at full speed.
This approach will likely persist for the next four years as governments strive to avoid an economic downturn at any cost to create a positive boom. However, the price of this strategy will be monetary inflation. Such an inflationary boom creates a financial environment where commodity prices, including gold, rise significantly.”
As U.S. national debt has reached unprecedented levels, now exceeding $36 trillion, Strand highlighted that the United States is not alone in facing this challenge. He emphasized that governments worldwide continue to increase spending through deficit financing. He noted: “The amount of money circulating in the system is increasing without generating substantial real growth, which naturally means each unit of currency becomes less valuable.”
Meanwhile, gold prices remain near all-time highs against major currencies such as the euro, British pound, Chinese yuan, Canadian dollar, and Australian dollar.
Gold continues to stand out as a safe-haven global asset as the trend of de-globalization accelerates. Countries are moving away from dependence on the U.S. dollar and diversifying their currency reserves. (De-globalization refers to the process of reducing or reversing global integration, including less free trade, restricted capital flows, reduced interdependence, and a rise in nationalist and local policies.)
Strand stated: “We have seen the beginning of de-globalization, and it appears to be gaining momentum, particularly as the U.S. seeks to impose conditions that serve its own interests. Policies such as ‘America First’ and high tariffs may benefit the U.S. economy, but they also undermine trust in the country as a leader in free-market economies.” He added: “This new phenomenon is likely to create inflationary pressures and may lead to waves of currency devaluation in other nations as they attempt to offset the effects of tariffs.”

USDCHF - Looking for a Weaker Dollar?!The USDCHF pair is trading in its ascending channel on the 4-hour timeframe, between the EMA200 and EMA50. In case of a downward correction towards the demand zones, the next long positions in this pair with a good risk-reward ratio will be available for us.
Morgan Stanley Investment Bank anticipates that the Federal Reserve will keep interest rates unchanged at its January meeting but is expected to revise its assessment of labor market conditions. Jerome Powell, the Fed Chair, is likely to emphasize the reliance on data and prevailing uncertainties while keeping the option for a rate cut in March on the table.
Morgan Stanley analysts predict that the Fed may revise its description of the labor market from “cooling” to “stable.” This shift reflects recent employment data trends, which have demonstrated consistency over the past 6 to 9 months.
According to Morgan Stanley, Powell is expected to reiterate ongoing progress in reducing inflation, highlighting that monetary policy remains appropriately restrictive. Furthermore, the Fed is likely to delve deeper into balance sheet policies and may signal that the process of balance sheet reduction could soon conclude. Meanwhile, Sergio Ermotti, CEO of UBS, has warned that high government debt could lead to a major crisis.
Goldman Sachs, in its analysis of President Donald Trump’s inaugural policy statements, noted that his tariff policies appeared softer than initially expected and currently carry less priority than previously anticipated.
The firm also observed that Trump’s rhetoric regarding Mexico and Canada was more aggressive than projected. Goldman Sachs concluded that the likelihood of a global U.S. tariff on all import sectors this year has diminished, thereby reducing the risk of reigniting inflationary pressures.
David Solomon, CEO of Goldman Sachs, stated that as the new U.S. administration begins its term, the country’s economy appears to be in excellent shape. He also highlighted that key questions regarding tariffs pertain to their speed of implementation and targeted countries. Solomon remarked that tariffs would ultimately lead to a rebalancing of trade agreements over time and that trade policies would directly influence interest rate equilibrium.
On the other hand, Thomas Schlegel, the president of the Swiss National Bank, stated that the Swiss franc remains a safe haven asset in global markets, although trade disputes have adverse implications for Switzerland’s economy. He also emphasized that there is no current concern regarding inflation, which remains within the bank’s target range and aligned with cyclical forecasts. Schlegel further mentioned that the possibility of employing negative interest rates cannot be ruled out.

XAUUSD - Gold will continue to rise?!Gold is above EMA200 and EMA50 in the 4-hour timeframe and is in its ascending channel. If gold climbs to the ceiling of the channel, you can look for positions to sell it towards the midline of the channel.
Investments in commodities are expected to remain a reliable hedge against inflation and economic uncertainty in 2025. Specifically, gold and silver are predicted to outperform other commodities.
Despite the optimistic outlook for 2025, Ole Hansen, Head of Commodity Strategy at Saxo Bank, advises investors to be cautious when constructing a commodity portfolio. Gold and silver, which showed strong performance in 2024, remain his top picks.
Hansen forecasts that gold prices will reach $2,900 per ounce this year, representing a 7% increase from current levels. However, he sees greater potential in silver, expecting prices to rise to $38 per ounce, a nearly 30% increase from current levels. He added that his outlook for the market remains bullish.
He also highlighted that gold will continue to serve as a key safe-haven asset through 2025. Hansen stated, “Investment demand for metals is increasing due to growing geopolitical uncertainties and global economic shifts. This has driven investors to seek safer assets, a trend that shows no signs of slowing down. Additionally, concerns about rising global debt, particularly in the United States, have prompted investors to turn to precious metals to safeguard against economic instability.”
However, Hansen urged investors to remain patient, as the Federal Reserve continues to unwind its accommodative monetary policies. Currently, markets anticipate only one rate cut this year, a significant shift from expectations just a few months ago. The Fed’s hawkish stance could support the U.S. dollar, potentially creating volatility in the precious metals market.
Jenny Johnson, CEO of Franklin Templeton, stated that the Federal Reserve is likely to pause to assess the impact of Trump’s policies on the economy.She noted that Trump’s spending pressures could provide a short-term boost to the economy, and his stance on deregulation is favorable for businesses.
Ron O’Hanley, CEO of State Street, remarked that he does not expect the Federal Reserve to cut rates more than twice this year. He also expressed heightened concerns about U.S. debt levels in the medium term.

GBP/USD: BOE Is Ready for the Big Cut!GBP/USD shows mixed signals, remaining below 1.2350, influenced by economic and political factors in both the UK and the US. After a strong rally on Monday, the pair lost momentum on Tuesday, driven by the recovery of the US Dollar and overall disappointing UK labor market data. The rise in the unemployment rate to 4.4% and a slowdown in employment growth weigh on the Pound, despite an annual wage increase of 5.6%. From a technical perspective, the RSI on the 4-hour chart signals a loss of bullish momentum, approaching the neutral level of 50 after being in the overbought zone. Key support levels are located at 1.2230 and 1.2200, while resistances are seen at 1.2350.
The Pound is also affected by an uncertain macroeconomic context, with Trump's comments indicating potential tariffs on China, Mexico, and Canada, supporting a recovery in the Dollar due to its safe-haven status. In the absence of significant US economic data, investor focus shifts to stock market performance: a negative opening on Wall Street could support the Dollar, exerting additional bearish pressure on GBP/USD. In the short term, the pair may remain under pressure, with a potential test of key support levels, unless more solid signs of Pound strength or Dollar weakness emerge.

Pound slips as UK payrolls slideThe British pound continues to show sharp swings this week. After a spectacular 1.3% gain on Monday, GBP/USD has reversed directions and is trading at 1.2233 in the European session, down 0.68% on the day.
The UK payrolls report, a reliable indicator of employment growth, showed a sharp decline of 47 thousand m/m in December 2024. This was the largest decline since Nov. 2020 and follows a revised -32 thousand in November. The back-to-back declines are a result of the government's new payroll taxes in the budget, which is causing businesses to release workers. Wage growth (excluding bonuses) remains hot and increased to 5.6% in December, in line with the market estimate and higher than the 5.2% gain in November.
While the weak employment data will be a headache for the UK government, it supports the case for the Bank of England to cut interest rates in order to kick-start the flagging economy. The BoE held rates in December and meets next on Feb. 6, with a quarter-point cut priced in at 85%. Inflation has remained sticky and the jump in wage growth is a reminder of the upside risk of inflation. The BoE may be looking at rate cuts in the coming months but it will have to do so cautiously, ever mindful of inflation.
In the US, the strong nonfarm payrolls report for December is raising the possibility that the easing cycle may be over. The Bank of America doesn't expect any rate cuts in 2025 and says the risks for the next move are tilted towards a hike. The Fed started the easing cycle with a bang in September 2024, chopping rates by a half-point, but the strong economy means Fed policy makers may have to consider rate hikes in 2025.
GBP/USD has pushed below support at 1.2278. and is putting pressure on support at 1.2211
1.2395 and 1.2462 are the next resistance lines

USD/JPY Under Pressure: Yen Strengthens Amid Bearish MomentumThe USD/JPY pair exhibits a clear bearish inclination, driven by a combination of economic and market factors that are strengthening the Japanese Yen and weakening the US Dollar. Currently, the pair has dropped to approximately 155.60, recording a 0.44% loss for the day, with sellers evidently attempting to push the price further toward critical support levels between 154.90 and 153.15. The downward pressure is amplified by rising expectations of a rate hike by the Bank of Japan, further supported by recent positive data such as improvements in Japan’s core machinery orders, signaling a recovery in capital expenditure. Simultaneously, uncertainty surrounding the economic policies of the Trump administration contributes to a negative climate for the US Dollar, which is already under pressure from a recent slowdown in buying flows.
From a technical perspective, the pair has encountered significant resistance in the 156.55-156.60 region, a level that halted previous recovery attempts and now acts as a key barrier. For a meaningful trend reversal, a sustained breakout above this resistance, followed by consolidation above 157.00, would be necessary to pave the way toward recent highs at 158.00 or even 158.85. However, the likelihood of a downward breakout seems more tangible, considering that the support at 155.25 represents the last defense before a drop toward the psychological level of 155.00 and further toward 154.60 and 153.30.
The current market environment, characterized by reduced trading volumes due to Martin Luther King Jr. Day in the US, suggests caution for traders, as dynamics could quickly shift with the return of liquidity and the announcement of potential monetary or political decisions in both Japan and the US. The combination of positive economic data for Japan and expectations of higher rates positions the Yen in a place of strength, while the Dollar may continue to struggle without a clear positive catalyst. Holding below 155.00 would be a significant signal for bears, indicating an extended downward trajectory toward deeper support levels.

XAUUSD - Gold will stabilize above $2700?!Gold is above EMA200 and EMA50 in the 4-hour timeframe and is in its ascending channel. If gold climbs to the ceiling of the channel, you can look for positions to sell it towards the midline of the channel. Losing the bottom of the channel will lead to the continuation of the downward trend.
The gold market had a strong start to the first full trading week of 2025. However, as the week progressed, optimism among traders grew, with predictions indicating a potential rally in gold prices ahead of Trump’s second presidential term.
Nevertheless, the market remains cautious about upcoming developments. Rich Checkan, the president and COO of “International Assets Strategies,” believes: “Unless there are any major disruptions during Monday’s inauguration ceremony, I expect gold prices to remain relatively unchanged next week. Market participants are waiting for more clarity on President Trump’s economic policies and their impact on key economic variables. However, one week is insufficient to see tangible effects, and a longer timeframe is needed for better evaluation.”
Bart Melek, the managing director and head of commodity strategy at “TD Securities,” highlighted the potential for higher tariffs and their inflationary effects, predicting a slight dip in gold prices. He stated: “If the new president addresses tariffs, signaling higher inflation, and the Federal Reserve takes a more serious stance on its inflation target, gold prices could decline moderately.”
At the beginning of 2025, gold is trading near $2,700 per ounce, while Bitcoin has approached the $100,000 threshold, placing both assets at the center of attention in emerging markets.
Mike McGlone, senior commodity strategist at Bloomberg Intelligence, forecasts that a correction in stock markets could drive gold prices above $4,000 this year. He remarked: “Gold reaching $4,000 will eventually happen. The unlimited supply of fiat currencies and the limited supply of gold, similar to Bitcoin, make this likely. However, my concern is that a natural and modest correction in the stock market, which is currently overvalued, could push gold to such levels.”
McGlone pointed out that the ratio of stock market value to U.S. GDP is around 2.2x — an unprecedented figure in the last 100 years. He emphasized that even a 10% correction in the stock market could provide the necessary momentum for gold prices to surge.

Copper - Markets are waiting for Trump's new decisions!Copper is above EMA200 and EMA50 in the 4-hour timeframe and has left its descending channel. The downward correction of copper will provide us with the opportunity to buy it with the appropriate risk reward. If the upward trend continues, you can sell copper in the next supply zone.
In recent days, the value of the U.S. dollar has risen, and Treasury yields have also increased. These developments are primarily driven by expectations that the Federal Reserve will proceed cautiously with interest rate cuts this year.
President Trump’s promises to raise tariffs, reduce corporate taxes, and deregulate industries have sparked concerns about rising inflation, which was already persistent even before these policies were implemented. Meanwhile, the U.S. economy appears robust, with strong labor market performance in November and December, indicating that the Federal Reserve may not feel pressured to accelerate interest rate cuts.
According to projections, investors anticipate that interest rates will decrease by approximately 0.4% by December 2025. This expectation persists despite reports suggesting the new U.S. administration will implement tariff hikes gradually and December inflation data came in lower than expected.
The U.S. Tax Foundation estimates that if the U.S. imposes a 60% tariff on imports from China and a 20% tariff on imports from other countries, the average tariff rate would climb to 17.7%. This would represent the highest level recorded since the 1930s. Trump has pledged to impose steep tariffs on goods imported from various nations; however, economists have warned about the potential consequences of such policies.
In a recent Reuters survey, all participating economists predicted that the Federal Reserve would maintain interest rates within the range of 4.25%-4.50% during its January 29 meeting. Additionally, 61 out of 103 economists expect the rate to decrease to 4.00%-4.25% by March.
The survey results also reveal that 65 out of 102 economists believe the Federal Reserve will reduce interest rates no more than twice this year (compared to 41 out of 97 in the December survey who held this view). Moreover, 40 out of 49 economists surveyed by Reuters forecast that U.S. inflation in 2025 will likely exceed expectations.
Scott Bassant, the nominee for Treasury Secretary in President-elect Trump’s administration, described China’s economy as being in recession. Taking a more pessimistic tone, Bassant labeled China as one of the most unbalanced economies in the world, highlighting the country’s prioritization of military strength and efforts to maintain growth by exporting cheap goods to the rest of the world.

NAS100 - Nasdaq index path, after the inauguration!The index is above the EMA200 and EMA50 in the four-hour timeframe and is trading in its ascending channel. If the index corrects towards the demand zone, you can look for the next Nasdaq buy positions with the appropriate risk reward. Nasdaq being in the supply range will provide us with the conditions to sell it.
As markets prepare for Donald Trump’s inauguration, the dollar has weakened slightly. Early signals suggest that no significant changes in tariff policies are imminent, leading to a minor dip in the dollar’s value. Over the weekend, Trump and Chinese President Xi Jinping had a positive conversation. Following the call, Trump tweeted, “Just had an excellent conversation with Xi Jinping of China. This was very good for both China and the U.S. I expect us to solve many issues together, and we’ll start immediately.”
Meanwhile, the correlation between Bitcoin and the Nasdaq Technology Index has reached its highest level in two years. Bloomberg data shows the 30-day correlation index between the world’s largest cryptocurrency and the Nasdaq stands at approximately 0.70, indicating closely aligned movements between the two assets.
On another front, Jared Bernstein, head of Joe Biden’s Council of Economic Advisers, has warned that the incoming Trump administration’s potential interference in Federal Reserve interest rate policies could risk a resurgence in inflation. Bernstein emphasized the importance of maintaining the Fed’s independence and noted that executive actions should not influence interest rate decisions.
TD Securities predicts that the Federal Reserve will keep interest rates steady during the first half of this year. However, it expects rate cuts to resume in the second half, with the terminal rate reaching the low 3% range. This strategy reflects the economy’s need to digest Trump’s new policies, particularly on tariffs and immigration.
This week’s economic calendar is relatively light.Both the New York Stock Exchange (NYSE) and Nasdaq will be closed on Monday, January 20, 2025, in observance of Martin Luther King Jr. Day.
Later in the week, key economic data will be released. On Thursday, the U.S. weekly jobless claims report will be published, followed by preliminary S&P Purchasing Managers’ Index (PMI) data and existing home sales figures on Friday.
Bank of America forecasts that the 10-year U.S. Treasury yield will reach 4.75% this year, with the potential to surpass 5% depending on Federal Reserve decisions. However, it sees a low probability of yields exceeding 5.25%.
The bank cites a strong macroeconomic backdrop and a hawkish Federal Reserve, suggesting that any rate hikes will depend on inflation data. Bank of America also notes that yields near 5% could represent a compelling buying opportunity, provided the Consumer Price Index remains stable or declines slightly.

XAUUSD - Gold reached above $2700!Gold is above the EMA200 and EMA50 in the 1-hour time frame and is in its ascending channel. If gold climbs to the top of the channel, we can look for positions to sell it at the target of $2,700. The loss of the midline of the channel will lead to the continuation of this corrective process.
Gold is expected to continue its growth trajectory in 2025, although this growth may not match the impressive performance seen in 2024. Juan Carlos Artigas, the Head of Research at the World Gold Council, discussed the reasons behind this trend and outlined three possible scenarios for gold’s future in an interview with Kitco News.
Artigas attributed gold’s record-breaking performance in 2024, which included 40 new highs, to the metal’s dual role as an investment asset and a consumer commodity. He stated, “Gold is an extremely effective risk management tool. Investors have turned to it due to rising market volatility and geopolitical risks.”
For 2025, Artigas predicted three distinct scenarios for the gold market:
• Limited growth with low volatility: This would occur if expectations for interest rates, inflation, and economic growth remain stable.
• Downward pressure: If interest rates remain high or rise further, gold’s investment appeal could diminish. Additionally, weak economic growth might lower consumer demand.
• Significant growth: In the event of heightened market volatility and geopolitical risks, investors would likely view gold as a safe haven, driving prices higher.
Artigas cautioned that government debt could emerge as a “black swan” event in 2025. He explained that rising global government debt levels and difficulties in securing financing pose a significant risk to the global economy.
He further emphasized that gold’s performance against various currencies highlights its role as a hedge against inflation and currency devaluation. For example, gold’s returns against the Turkish lira reached 50% in 2024 due to the lira’s depreciation against the US dollar.
Additionally, Artigas pointed to increased demand from central banks and Western investors in the second half of 2024. This surge in demand was attributed to lower central bank interest rates and reduced opportunity costs for holding gold.
Among all commodities, gold remains one of the few assets that analysts at BMO Capital Markets are optimistic about for 2025. They predict that central banks will continue purchasing gold to reduce reliance on the US dollar. Furthermore, BMO expects gold to remain a dynamic asset, serving as an effective hedge against inflation, geopolitical uncertainty, and stock market risks.
Next week, Donald Trump will be sworn in as the next President of the United States. Meanwhile, the global community is bracing for the new administration, which has announced plans to impose tariffs to promote and protect domestic policies under the “America First” agenda.
BMO analysts believe the Trump administration will be “inherently” inflationary. Their report noted, “The new administration has highlighted two clear policies that will dominate Trump’s second term. The first is that 2025 will be a year of tariff increases. Since tariffs function as a domestic tax on consumption borne by consumers, the economic consensus is that tariffs are inherently stagflationary.” They added, “The second key policy involves continued increases in government spending. Trump won the election on promises of tax cuts for corporations and individuals. According to an analysis by the Committee for a Responsible Federal Budget, these promises are expected to add approximately $7.75 trillion to the US national debt between 2026 and 2035.”
BMO analysts also noted that rising inflationary pressures will likely lead to a decline in real interest rates, eroding the appeal of short-term bonds, which were a favored risk-free option in the previous year.

Brent - Peace returned to the Middle East?!Brent oil is above EMA200 and EMA50 in the 4-hour time frame and is moving in its upward channel. On the ceiling of the ascending channel, we will look for oil selling positions. In case of a valid break of the $80 range, we can see the continuation of the downward trend. On the other hand, within the demand zone, we can buy with a suitable risk reward.
Brent crude oil prices have surpassed $80 per barrel. This price increase continues to be supported by declining U.S. crude oil inventories and uncertainties surrounding Russian oil supplies following new U.S. sanctions.
The International Energy Agency (IEA) has stated that the latest U.S. sanctions have the potential to significantly disrupt Russia’s energy exports. These sanctions have blacklisted over one-fifth of the tanker fleet transporting Russian oil. Last week, 160 sanctioned tankers transported over 1.6 million barrels per day of Russian oil in 2024, accounting for approximately 22% of the country’s maritime exports. However, the IEA has maintained its current outlook on Russia’s oil supply and will update it based on future developments.
Meanwhile, reports indicate that Israel and Hamas have reached a ceasefire agreement, though Israel’s Prime Minister’s Office stated that details are yet to be finalized. Israeli Prime Minister Benjamin Netanyahu thanked U.S. President-elect Donald Trump for his role in the Gaza agreement and announced plans to meet him in Washington soon. Netanyahu also expressed gratitude to U.S. President Joe Biden for aiding in the hostage agreement. A senior Hamas official confirmed the group’s commitment to the ceasefire proposed by mediators.
In the oil market, attention remains focused on uncertainties surrounding Russian oil supply after the announcement of stricter U.S. sanctions. Additionally, declining U.S. crude oil inventories provide further support for prices. According to the Energy Information Administration (EIA), U.S. commercial crude oil inventories fell by 1.96 million barrels last week to under 413 million barrels, the lowest level since March 2022. This decline was primarily due to a decrease in crude oil imports by 304,000 barrels per day and an increase in exports by 1 million barrels per day. In refined products, despite a 1.6% drop in refinery utilization, gasoline and distillate inventories rose by 5.85 million barrels and 3.08 million barrels, respectively.
The Colonial Pipeline, which transports about 1.5 million barrels per day of gasoline from the U.S. Gulf Coast to the East Coast, is expected to remain closed until Friday following a leak earlier this week. This has provided limited upward support to gasoline prices.
The IEA and OPEC have both released their monthly oil market reports. The IEA warned that new U.S. sanctions on Russia’s energy sector could lead to supply disruptions. Additionally, the agency revised its global oil demand growth forecast upward due to colder weather in the Northern Hemisphere. The IEA estimates that global oil demand in 2024 will increase by 940,000 barrels per day, 90,000 barrels per day higher than the previous estimate. For 2025, demand is expected to grow by 1.05 million barrels per day.
OPEC, in its monthly report, maintained its 2025 oil demand growth estimate at 1.45 million barrels per day. For 2026, the group’s initial forecast predicts an increase of 1.43 million barrels per day. OPEC also kept its 2025 supply growth estimate for non-OPEC+ countries unchanged at 1.11 million barrels per day and expects a similar increase for 2026. OPEC’s production in December rose slightly to 26.74 million barrels per day, while overall OPEC+ output fell by 14,000 barrels per day to 40.65 million barrels per day due to reduced production in Kazakhstan. OPEC data indicates that demand for OPEC+ crude in 2025 will reach 42.5 million barrels per day and rise to 42.7 million barrels per day in 2026.
Iraq’s Oil Minister Hayan Abdul-Ghani told Reuters that Iraq plans to sign a major oil and gas deal in Kirkuk with BP by early February. He noted that this deal will surpass the scale of the major 2023 agreement with TotalEnergies.

USDCAD - which direction will the Canadian dollar go?The USDCAD currency pair is above the EMA200 and EMA50 in the 4-hour timeframe and is moving within the range. The correction of this currency pair towards the demand zone will provide us with the next buying position. The upward movement of this currency pair will make its selling positions attractive.
Canada has initiated efforts to mitigate the economic impacts of new U.S. tariffs. These measures include the creation of a critical minerals management unit and defense procurement activities.
Prime Minister Justin Trudeau emphasized that Canada would respond firmly and decisively if the U.S. imposes tariffs. Bloomberg reported that Canada is prepared to impose tariffs on $105 billion worth of American goods should the U.S. act first. Quebec’s Premier stated that no official announcements about retaliatory actions would be made until Trump’s plans are clearer, but no options are off the table. Ontario’s Premier added that any retaliatory measures against the U.S. must be stringent.
Donald Trump, the U.S. President-elect, campaigned on promises such as imposing heavy import tariffs, tightening immigration policies, reducing regulations, and downsizing the government.However, the economy he is set to oversee may require a different approach from the policies implemented in 2017.
Currently, the U.S. economy is growing at an above-average pace, unemployment is near full employment, and inflationary pressures remain significant. This suggests that the U.S. economy might not need fiscal stimulus measures like tax cuts. Furthermore, high asset valuations and rising bond yields could expose the economy to sharper corrections.
When Trump took office in 2017, the U.S. economy was still recovering from the 2007-2009 financial crisis. Policies such as tax cuts and import tariffs had varying impacts then. However, today, inflation remains above the Federal Reserve’s 2% target, mortgage rates are near 7%, and government bond yields are close to 5%. These rising yields may reflect market concerns about inflation control and America’s fiscal discipline.
In a recent Reuters survey, 25 out of 31 economists predicted that the Bank of Canada would cut interest rates by 0.25% at its January 29 meeting, while the remaining six expected rates to stay unchanged.
Gravelle, Deputy Governor of the Bank of Canada, stated that quantitative tightening (QT) is expected to conclude in the first half of 2025. He noted that ending QT would require settlement balances to rise to a range of CAD 50-70 billion, up from the previous estimate of CAD 20-60 billion. Treasury bond purchases are set to commence in the last quarter of this year, initially in small volumes.
Following the release of recent data, projections for real personal consumption expenditures in Q4 have risen from 3.3% to 3.7%, while real government spending growth for the same period increased from 2.9% to 3%. However, forecasts for real private domestic investment growth have been revised downward from -0.4% to -0.8%.
In its updated forecast, Wells Fargo indicated that the Federal Reserve would cut interest rates twice this year by 0.25%, once in September and again in December. Previously, three rate cuts were anticipated for the year.

XAU/USD Analysis: Gold's Bullish Momentum Eyes $2,790The analysis of XAU/USD highlights a strong bullish momentum in the short term, with gold prices reaching a one-month high above $2,700 on January 16, 2025. This rally was supported by contrasting U.S. economic data: while consumer spending showed strength, the increase in unemployment claims contributed to a decline in U.S. Treasury yields, enhancing gold's appeal as a safe-haven asset. Optimism regarding a possible Federal Reserve rate cut, driven by cooling inflation, has further strengthened positive sentiment toward gold, which has posted three consecutive sessions of gains. From a technical perspective, the breakout above the key resistance level of $2,697 opens the door to a potential target of $2,740, reinforcing the current bullish trend. However, traders remain focused on upcoming economic events, including the Federal Reserve's rate decision at the end of January and the release of CPI and Non-Farm Payrolls data in early February, which could significantly impact market sentiment. Expectations suggest that a potential rate cut or weak macroeconomic data could continue to support gold prices, while signs of economic strength or a rate hike might trigger bearish pressure. In the medium term, gold could fluctuate between $2,650 and $2,800, with the market remaining sensitive to monetary policy developments and inflation dynamics. In the long term, potential geopolitical stabilization and a global economic recovery could reduce interest in gold as a safe-haven asset, bringing prices to a range between $2,500 and $2,600.

EUR/GBP: Ready to reach the level 0.83!The EUR/GBP exchange rate is currently in a bearish phase, trading near 0.8440 as of January 15, 2025. The key resistance level at 0.8445, which has been a significant barrier since September, has once again hindered upward attempts. The recent downward pressure has been influenced by the halt in the rally of UK gilt yields, following weaker-than-expected inflation data. This factor, combined with growing concerns about stagflation in the UK, creates an unfavorable environment for the Pound, increasing the likelihood of a dovish stance from the Bank of England. On the European side, the stabilization of inflation in the Eurozone provides relative support for the Euro, further reinforcing the bearish sentiment on the EUR/GBP pair. Key upcoming events in the short term include the BoE rate decision on January 25, 2025, which could significantly impact the Pound: a more accommodative stance would further weaken the British currency, favoring an upward movement in the pair. This will be followed by the Eurozone GDP data release on February 2, 2025, and the PMI results for both the UK and the Eurozone in early February, with the potential to influence market dynamics depending on the relative strength of their economies. Market sentiment remains oriented toward short-term stability, with limited movements expected until new significant signals emerge from economic data or central bank decisions.

Aussie rises after US core CPI declines to 3.2%The Australian dollar is higher for a third consecutive trading day. In the North American session, AUD/USD is trading at 0.6233, up 0.63% at the time of writing.
The US inflation report for December was a mixed bag, as headline CPI rose while the core rate declined. Headline CPI rose to 2.9% y/y from 2.7% in November, matching the market estimate. Monthly, headline CPI rose to 0.4%, up from 0.3% and above the market estimate of 0.3%.
The more important story was the decline in core CPI, which excludes food and energy and is more closely watched by the Federal Reserve than the headline data. Core CPI eased to 3.2% y/y in December, down from 3.3% over the past three months and below the market estimate of 3.3%. Monthly, core CPI ticked lower to 0.2% in December, down from 0.3% a month earlier and in line with the market estimate.
The decline in core CPI was small but still significant, as the core rate showed downward movement after remaining unchanged for three months. Investors responded by raising the probability of a quarter-point cut in March at 29%, up from 19% prior to the inflation release, according to CME's FedWatch. The Fed meets at the end of the month and is virtually certain to hold rates.
Australia releases the December employment report early on Thursday. Australia's labor market remains solid, although the economy as a whole is struggling. Job growth increased by a strong 35.6 thousand in November, beating expectations. Will the positive trend continue? The market estimate for December stands at 15 thousand, which would mark a nine-month low. The unemployment rate has been low and fell to an eight-month low in November at 3.9%. It is expected to creep up to 4.0% in December.
The Reserve Bank of Australia meets on Feb. 18 and the strength of the labor market is a key consideration in the central bank's decision-making. As long as the labor market remains solid and does not deteriorate quickly, the RBA can afford to hold off on a rate cut. If, however, the employment report is softer than expected, it would put pressure on the RBA to lower rates at next month's meeting.
AUD/USD is testing resistance at 0.6231. Above, there is resistance at 0.6255
0.6189 and 0.6171 are providing support

US100 NASDAQ SHORTThe US dollar is broadly firmer, though the Japanese yen is proving a resilient ahead of the BOJ deputy governor's speech
Nasdaq slide as key tech stocks get hit
All three benchmarks are down for the last two weeks, with tech shares causing most of the damage
With the 10-year yield potentially getting to 5%, it’s going to be very hard for the equity market to really gain any meaningful traction here until there’s — at minimum — stability in interest rates
Interest rates rise? iN 2025 it will be possible:Inflation, signs of recession.
