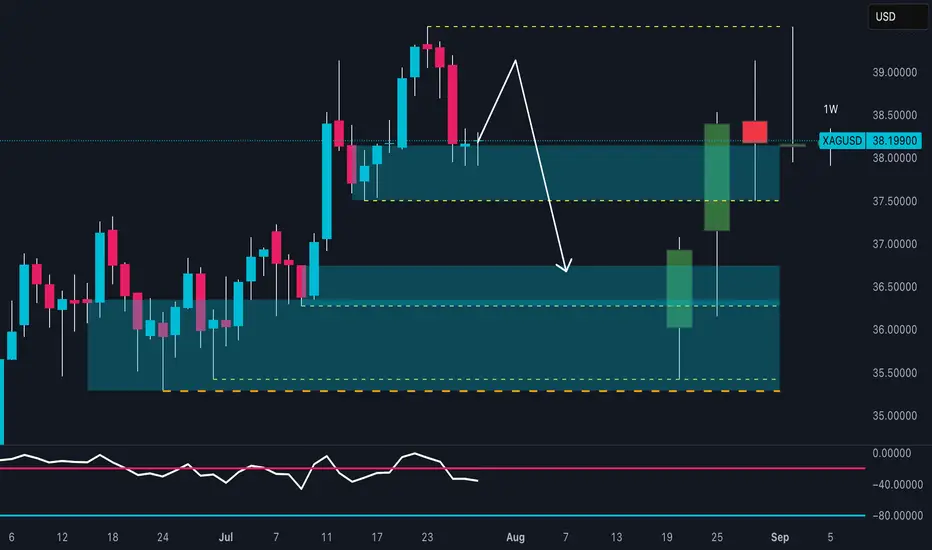
SILVER Is About to Collapse? Watch This Critical Supply Zone!Price recently tapped a high near 39.20 before sharply rejecting from the 38.80–39.20 supply zone, confirming strong selling pressure. The current structure shows:
- Supply zone tested and rejected
- Likely return to the previous demand zone (36.50–36.00)
- RSI is turning down, confirming loss of momentum
A pullback toward 38.30–38.50, followed by a bearish continuation toward the 36.50 area, which acts as a key structural and institutional support.
🗓️ Seasonality
Historically, July is bullish for silver:
Last 5Y average: +0.89%
Last 2Y average: +2.18%
However, August–September are bearish months:
August: mildly positive, but weak
September: consistently negative across all time frames (-0.86% to -1.10%)
This increases the probability of a downward move starting in early August, in line with current price action rejection.
🪙 Commitment of Traders (COT) – July 22
Non-Commercials (speculators):
Longs: +656
Shorts: -516
Commercials (hedging):
Longs: +1,337
Shorts: +916
➡️ Commercials are increasing both long and short exposure, while non-commercials remain net long — a sign of moderate optimism.
However, long positioning is slowing down compared to previous weeks. A potential exhaustion in bullish momentum is forming.
📉 Sentiment
52% short vs 48% long
Volume: more lots on the short side (492 vs 454)
Sentiment remains neutral to slightly contrarian bullish, but not extreme. This may allow for a fake breakout before a deeper move down.
🧩 Operational Summary
Main bias: Bearish short to mid-term (starting August), supported by:
- Technical rejection at supply
- Negative seasonal tendencies ahead
- RSI showing momentum loss
- COT showing stabilization, not accumulation
Fed
Multi-timeframe analysis, strong momentum, FOMC risk/reward plan__________________________________________________________________________________
Technical Overview – Summary Points
__________________________________________________________________________________
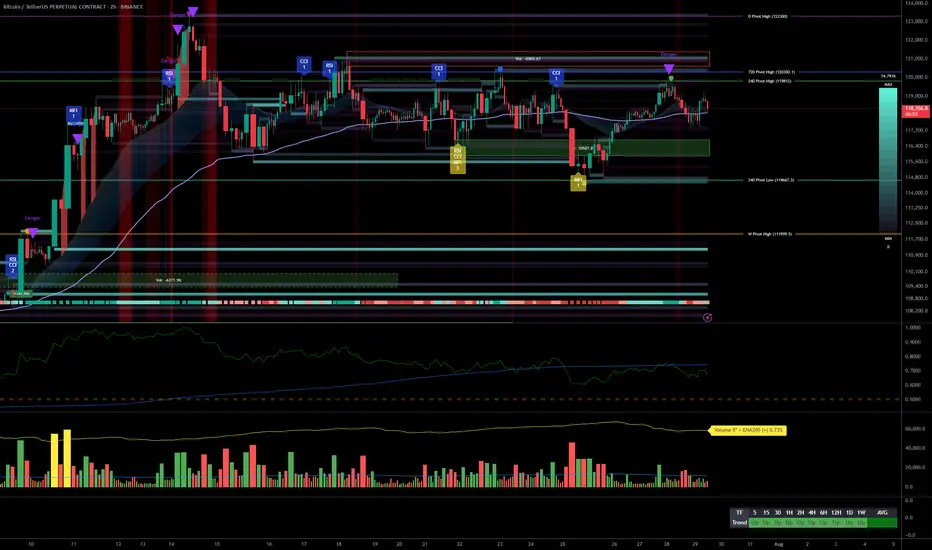
Strong momentum and bullish consensus confirmed across all timeframes.
Key support/resistance : 114k–116k (critical support), 123k (major pivot).
Healthy organic volume , no extreme peaks except isolated moments (30min/15min).
Risk On / Risk Off Indicator : Dominant bullish signal, neutral only on 15min.
Multi-timeframe structure : Perfect alignment daily/4H/2H/1H, caution on 15/30min (slight inflection but no abnormal divergence).
__________________________________________________________________________________
Strategic Summary
__________________________________________________________________________________
Global bias : Structural bull market, intact dynamic.
Opportunities : Tactical buys on pullbacks (114–116k), swing on breakout 123k.
Risk areas : Below 114k = risk of invalidation, targets 111k–105k.
Macro catalysts : FOMC imminent (high volatility expected), watch geopolitical tensions.
Action plan : Favor swing/cautious trading ahead of FOMC, dynamic stops, act on first post-Powell trigger.
__________________________________________________________________________________
Multi-Timeframe Analysis
__________________________________________________________________________________
1D : Active range 114k–123k; strong supports, momentum maintained; Risk On / Risk Off Indicator strongly bullish.
12H/6H/4H : Clean bullish structure, no excesses or divergence; price sits within major horizontal clusters.
2H/1H : Healthy impulse/correction phases; key intermediate supports 114.6k, 117.5k to watch.
30min/15min : Slightly weaker momentum but constructive microstructure, no immediate sell threat; localized volume spikes on support reactions.
ISPD DIV : No behavioral stress observed throughout.
Cross-timeframe summary : Bullish confluence dominant; caution on short-term reversals tied to FOMC and on-chain volatility spikes.
__________________________________________________________________________________
Multi-timeframe Cross Analysis & Decisional Rationale
__________________________________________________________________________________
As long as BTC > 114k = bullish bias, buying pullbacks, swing target 123k.
Active management post-FOMC strongly advised (enter/reduce after first H4 close).
Increased volatility risk in case of Fed/geopolitical shock; mandatory stops.
Sector momentum (Risk On / Risk Off Indicator) and volume underpin the bullish case unless exogenous alert.
Invalidation below 114k = prudent, neutral, or tactical shorts towards 111k–105k.
__________________________________________________________________________________
Macro, On-chain & Economic Calendar
__________________________________________________________________________________
FOMC July 29th : pivotal event, any surprise = strong intraday move (BTC sensitive to Powell speech).
US Macro: strong fundamentals but caution on trade war, inflation "contained."
On-chain : realized cap BTC >$1T, high open interest in derivatives = leveraged risk, beware speculative altcoin excess.
Global risk : market remains buyer until bearish Fed/geopolitical shock; swing trading favored, tight stops recommended.
__________________________________________________________________________________
Action plan
__________________________________________________________________________________
Favor buying/reloading on pullbacks to 114.6k–116k (stop <114k).
Break above 123k = bull confirmation, further extension likely to 126–128k depending on FOMC outcome.
Prioritize strict risk management; monitor liquidity/supports on macro/on-chain volatility peaks.
__________________________________________________________________________________
Should You Still Sell Your USD for EUR? A 2025 PerspectiveWith currency markets in constant flux, the decision to hold USD or convert to EUR carries major financial implications for investors, expatriates, businesses, and frequent travelers. As of July 29, 2025, the USD/EUR exchange rate is around 0.86–0.87, with $1 buying roughly €0.86. Is now the right time to sell your US dollars for euros? Here’s a balanced look at the latest data and forecasts.
Current Market Context: Dollar Weakness and Euro Stabilization
USD Slide in 2025: The US dollar has experienced its steepest decline in over three years, falling nearly 10% year-to-date. This sustained weakness is attributed to policy volatility, capital flowing out of the US, and narrowing interest rate differentials.
Key Exchange Rate: Recent rates hover between 0.85 and 0.87, representing moderate stability following a period of volatility.
Euro’s Resilience: While the euro has had its own struggles, from slower economic growth to political uncertainty in Germany and France, analysts forecast no major sustained fall for the euro through 2025.
2025 Forecasts: USD/EUR Direction—What Do the Experts Say?
Year-End 2025 Outlook: Major banks and forecasting firms expect the EUR/USD rate could climb even higher by year-end, meaning the euro could gain modestly versus the dollar if current trends continue.
Factors to Watch:
Fed Rate Cuts: Potential US rate cuts in Q3–Q4 remain a key driver for further USD weakness.
Trade & Tariff Uncertainty: Ongoing US tariff announcements and global trade tensions add volatility but also support safe haven flows to the dollar.
Eurozone Politics: Any resolution of political uncertainty in Europe could buoy the euro.
Most Important One: Fed's Money Printer...
Strategic Considerations: Should You Sell Now?
Locking in Current Rates: If you need euros to make payments, pay salaries, or make investments in the short term, converting a portion now could reduce your exposure to further USD downside.
If You Can Wait: Analysts see some chance for USD recovery in late Q3 or early 2026, but this is contingent on US policy stability and Fed decisions.
Averaging In: For larger transfers, consider splitting your transaction over time (also called dollar-cost averaging), which can help mitigate volatility.
Bottom Line
If you have an immediate need for euros, current rates present a reasonable opportunity. The dollar’s weakness throughout 2025 is well documented, but much of the pessimism may already be priced in. If you’re flexible with timing, monitor central bank policy signals throughout Q3/Q4, a more dovish Fed or unexpected eurozone stability could push rates further in your favor, but event risks remain elevated. Ultimately, a phased or hedged approach may offer both protection and potential upside
*not investment advice*
#forex #fx #dollar #usd #euro #eur #economy #trade #tariff #trading #indicator

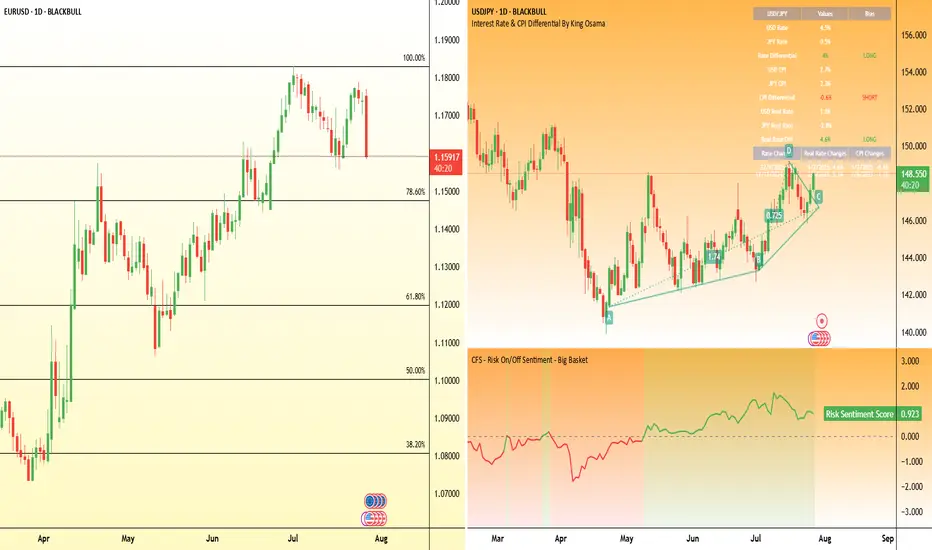
EUR/USD at a Turning Point:Rally or Trap for the Bulls?📉 Technical Analysis
Price has decisively broken out of the descending channel highlighted in recent weeks. The weekly support zone between 1.1540 – 1.1580 is holding, triggering a significant technical reaction. The weekly RSI has entered oversold territory, suggesting a potential short-term reversal.
Key Support: 1.1530–1.1580 (currently reacting)
Key Resistance: 1.1720–1.1780 (inefficiency & supply zone)
Base Case: Potential rebound toward 1.1720–1.1750 before next structural decision
🧠 Sentiment Analysis
82% of retail traders are long, with an average entry at 1.1635
Only 18% are short, a clear minority
This extreme imbalance suggests downside pressure may persist to flush out weak long hands before a genuine reversal takes place.
📊 COT (Commitment of Traders)
USD Index:
Non-Commercials increased both long (+663) and short (+449) positions → uncertain stance but slight USD strengthening
EUR Futures:
Non-Commercials increased long (+6,284) and short (+8,990) positions, but net increase favors the bears
This shift signals a bearish turn in sentiment among large speculators, indicating short-term downward pressure.
📈 Seasonality
In July, EUR/USD historically tends to rise, but:
This year’s price action is underperforming the seasonal pattern, showing relative weakness
August is historically flat to slightly bearish
Seasonality does not currently support a strong bullish continuation
✅ Strategic Conclusion
Current Bias: Bearish-neutral (with short-term bullish bounce expected)
A technical rebound toward 1.1720–1.1750 is likely (liquidity void + RSI bounce + retail imbalance)
However, 1.1720–1.1750 is a key supply zone to monitor for fresh shorts, in line with:
Dollar-supportive COT data
Overcrowded long retail positioning
Weak seasonal context
🧭 Operational Plan:
Avoid holding longs above 1.1750 without macro confirmation
Monitor price action between 1.1720–1.1750 for potential short re-entry
Clean breakout above 1.1780 → shift bias to neutral/bullish
Countdown to Powell’s rate decision: What to watch WednesdayFederal Reserve Chair Jerome Powell is under mounting pressure from President Donald Trump to begin cutting interest rates.
Markets and analysts overwhelmingly expect the Fed to hold rates steady this Wednesday.
But what if the political heat is becoming too much to bear, and Powell and the Fed board advocate for a cut this week? Some Fed governors, Chris Waller and Michelle Bowman , have already signaled support for an early cut.
FX pairs to watch
USD/JPY:
This pair remains highly sensitive to yield differentials and broader risk sentiment. However, any hawkish resistance or emphasis on data dependency may keep the pair supported, especially if risk appetite holds.
EUR/USD:
The euro has shown relative strength in recent sessions, but the pair has been hit by the announcement of the trade deal struck between the EU and US. If the Fed clearly signals it's not ready to ease, the USD could regain even ground.
While we see markets fall, lets remember - FED on 30th
When you look on 1 hour or 4 hour charts, our hearts miss a beat...
"Bitcoin is Crashing"
But as you can see on a weekly chart, it really is nothing more than a little hiccup...not even that !
We can drop to 110K before you need t really watch
This cycle has seen so many similar instances.
But we do need to be alert to make sure this fall does on continue for what ever reason
But when we remember that on Wednesday, the FED gives us the rate decision for the USa, it all becomes clear, because this happens almost everytime before a rate decision is announced.
The chart above is the daily smapshot of a weekly chart I have been posting since 2021, about Rate Announcements by the FED.
You can see the red candles before each occasion, the Red vertical lines being approx the day the FED announced the decision. ( Approx as it is a weekly chart normaly and I do not "Zoomin" to get the day count perfectly as it becomes lost when I came back out to a week chart)
But you get the idea
do not panic
This is the weekly chart of that FED RATE effects in Bitcoin PA....over all..NO EFFECT
The effect has always been on the companies that can provide bitcoin
So, Keep your Cool. anf HOLD BITCOIN

Australian dollar down, eyes US GDP, Australian CPIThe Australian dollar is down for a third straight trading day. In the North American session, the US dollar has posted gains against most of the major currencies, including the Aussie. The greenback received a boost after the US and the EU reached a framework trade agreement after protracted negotiations.
The data calendar is bare on Monday, with no events out of the US or Australia. Things get very busy on Wednesday, with Australian inflation, US GDP and the Federal Reserve rate decision.
Even with no US releases, the US dollar has posted gains against most of the major currencies, including the Aussie. The greenback received a boost after the US and the EU reached a framework trade agreement after protracted negotiations.
President Trump had threatened to impose 30% tariffs on European goods if a deal was not reached by Aug. 1. With the deal, a nasty trade war between the world's two largest economies has been avoided and the US will tariff most EU products at 15%.
The deal with the EU comes on the heels of a similar agreement with Japan, bringing a sigh of relief from the financial markets that have been worried about the economic fallout from Trump's tariff policy. The agreements remove a great deal of uncertainty and investors are hopeful that the US and Chinese negotiators will wrap up their talks with an agreement in hand.
The Federal Reserve meets on Wednesday and is virtually certain to maintain interest rates for a fifth straight meeting. It will be interesting to see if President Trump, who has been sharply critical of Fed policy, reacts to the decision. The money markets are expecting at least one cut before the end of the year, with the money markets pricing in a 61% likelihood a cut in September, according to FedWatch's CME.
XAUUSD - Gold is in for a big week?!Gold is trading below the EMA200 and EMA50 on the 4-hour timeframe and near the bottom of its medium-term ascending channel (breakout or no break is yet fully confirmed). A correction towards demand levels would provide us with a better risk-reward buying position, and if it rises, we could consider shorting it in supply levels.
In the past week, gold experienced two distinct phases in its price movement: a strong upward trend in the first half that stalled at key resistance levels, leading the market into a more cautious mode. The latest surveys reveal a clear division among gold analysts—some foresee a bearish outlook, while others prefer to remain neutral and wait for further signals. Meanwhile, retail traders remain optimistic about gold’s short-term trajectory and emphasize the continuation of its upward trend.
Analysts at Commerzbank believe the gold market is currently directionless and searching for a clear trend. In their view, recent news around potential trade agreements has weakened demand for gold as a safe-haven asset. They have adopted a neutral stance in the short term, stating that gold prices are near their upper limit with limited room for further gains at the moment.
Conversely, some experts are confident in the continuation of gold’s bullish trend. Rich Checkan, President and CEO of Asset Strategies International, declared: “Gold is in an uptrend. Today’s pullback is setting the stage for next week’s rally. If the Federal Open Market Committee (FOMC) meets expectations and holds rates steady, both gold and silver will keep climbing. And if the Fed exceeds expectations by cutting rates, we’ll see an even stronger surge in both metals. Either way, the direction is upward.”
At the same time, other analysts remain cautious about the trend’s sustainability. Mark Leibovit, editor of VR Metals/Resource Letter, warned that the U.S. dollar may be forming a bottom, which could exert downward pressure on gold and calls for increased caution from investors.
Despite continued political pressure from President Trump, the Federal Reserve is not expected to lower interest rates at the upcoming meeting. Central bankers have stated that they want to observe the economic effects of tariffs before making any adjustments. Although some Fed officials are moving away from the “wait and see” approach, analysts still believe the Fed will leave rates unchanged this week—though markets are closely watching for any signals suggesting that rate cuts could begin as early as September.
Meanwhile, China’s gold consumption in the first half of 2025 declined, though the drop was less severe than in previous years. The primary reason was increased demand for gold as a safe-haven investment, which partially offset reduced jewelry purchases due to high prices.
According to data from the China Gold Association, a government-affiliated body, gold consumption fell by 3.54% year-over-year in the first half of the year to 505,205 tons. In comparison, Q1 saw a 5.96% annual decline, and the same period in 2024 recorded a 5.61% drop.
The association stated that growing geopolitical tensions and ongoing economic uncertainty have strengthened gold’s role as a store of value and safe asset, prompting a significant rise in private investment in bars and coins.
Gold bar and coin purchases—a key indicator of safe-haven demand—surged by 23.7% to 264,242 tons, accounting for 52% of total consumption and overtaking jewelry as the largest consumption segment. Meanwhile, gold jewelry demand fell by 26% to 199,826 tons, reflecting weakened consumer interest due to high prices.
Still, the association noted that lighter jewelry products with unique designs and higher value-added features remain popular. Additionally, official data from the People’s Bank of China (PBOC) showed that the central bank increased its gold reserves in June for the eighth consecutive month.
On the supply side, domestic gold production fell by 0.31% year-over-year to 179,083 tons in the first half of the year, while output from imported sources rose by 2.29% to 76,678 tons. Altogether, China’s total gold production grew by 0.44%, reaching 252,761 tons.

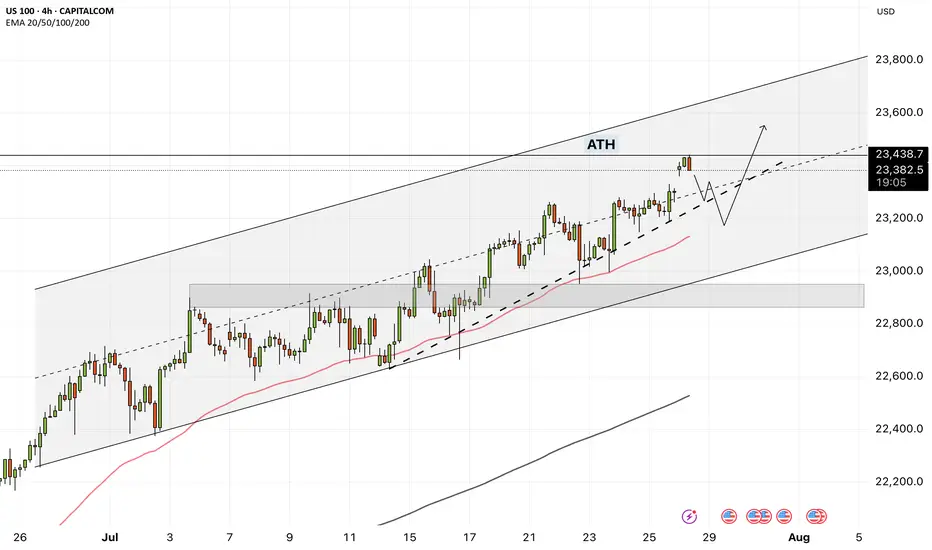
NAS100 - How will the stock market react to the FOMC meeting?!The index is trading above the EMA200 and EMA50 on the four-hour timeframe and is trading in its ascending channel. The target for this move will be the ceiling of the channel, but if it corrects towards the indicated support area, you can buy Nasdaq with better reward-risk.
As signs of easing global trade tensions begin to emerge, the Federal Open Market Committee (FOMC) is scheduled to meet this week. Analysts widely expect the Fed to hold interest rates steady for a fifth consecutive time. This anticipated decision comes as the U.S. President continues to push for rate cuts, persistently pressuring the Fed to adopt a more accommodative monetary stance.
So far, the Federal Reserve has kept its benchmark rate within a range of 4.25% to 4.5%. While some officials project two cuts by the end of the year, markets are waiting for the Fed’s patience to run out. According to the CME Group’s FedWatch tool, investors have priced in a 62% chance of a rate cut in the September meeting. By then, the Fed will have access to the July and August employment reports—key indicators of whether the labor market is weakening or remains resilient.
The upcoming week marks the peak of Q2 earnings season, with 37% of S&P 500 companies reporting results, including four major tech firms. In parallel, the August 1st tariff deadline for the EU and other countries is approaching, while legal challenges over existing tariffs remain ongoing.
According to a report by The Wall Street Journal, many large U.S. corporations have so far absorbed the bulk of tariff-related costs without passing them on to consumers. This strategy aims to maintain market share and avoid drawing criticism from President Trump. However, the question remains—how long can this continue?
Examples from the report include:
• General Motors paid over $1 billion in tariffs in Q2 alone without announcing any price hikes.
• Nike expects a $1 billion hit from tariffs this fiscal year and is planning price increases.
• Hasbro is working on a combination of price hikes and cost cuts to offset $60 million in tariff impacts.
• Walmart has made slight pricing adjustments (e.g., bananas rising from $0.50 to $0.54) and managed pressure through inventory reductions.
This week is shaping up to be one of the busiest on the economic calendar in recent months. A flood of key data on growth, inflation, and employment, alongside three major interest rate decisions, has markets on high alert.
On Tuesday, attention will turn to two significant reports: the Job Openings and Labor Turnover Survey (JOLTS) and the U.S. Consumer Confidence Index for July. These metrics will offer a clearer view of labor market dynamics and household sentiment heading into critical monetary policy decisions.
The most anticipated day is Wednesday. That day brings the ADP private payrolls report, the first estimate of Q2 GDP, and pending home sales data. Additionally, both the Bank of Canada and the Federal Reserve will announce rate decisions—events with the potential to simultaneously steer global market trajectories.
On Thursday, the July Personal Consumption Expenditures (PCE) price index will be released—a key inflation gauge closely monitored by the Fed. Weekly jobless claims data will also be published that day.
The week concludes Friday with two heavyweight economic indicators: July’s Non-Farm Payrolls (NFP) report, a crucial input for Fed policy decisions, and the ISM Manufacturing PMI, which offers insights into the health of the real economy.
Some economists argue that a September rate cut may be premature, and even suggest that no rate changes might occur in 2025. Analysts expect Fed Chair Jerome Powell to reiterate a data-dependent stance, consistent with previous meetings.
Still, beyond political dynamics, the July meeting holds independent significance.The Fed’s internal policy tone is gradually leaning more dovish, and subtle signals of this shift may emerge in the final statement. Given that only one meeting remains before September, if policymakers are leaning toward a rate cut then, it’s critical that the groundwork for such communication be laid now.
Bitcoin - Will Bitcoin continue its upward trend?!Bitcoin is above the EMA50 and EMA200 on the four-hour timeframe and is in its medium-term ascending channel. Bitcoin’s current upward momentum has the potential to reach its previous ATH. If it corrects, you can look for Bitcoin buying opportunities from the identified support area, which is also at the intersection of the bottom of the ascending channel.
If this support is lost, the decline will continue to around $113,000, where you can again buy Bitcoin with a better risk-reward ratio.
It should be noted that there is a possibility of heavy fluctuations and shadows due to the movement of whales in the market, and capital management will be more important in the cryptocurrency market. If the downward trend continues, we can buy within the demand range.
Last week, a group of U.S. senators released an initial draft of a new legislative proposal aimed at creating a clearer regulatory framework for the digital asset industry in the United States. The proposal builds on the recently passed CLARITY Act in the House of Representatives and focuses on strengthening market structure, enhancing consumer protection, and expanding regulatory oversight.
According to the senators, the bill addresses key areas such as banking, disclosure requirements, securities classification, and measures to combat illicit financial activity.Senator Lummis, in highlighting the proposal, stressed the urgent need for legal clarity to support the growth of this emerging industry within the U.S. The legislation aims to facilitate the integration of digital assets into banking services and would allow financial holding companies to provide services based on such assets.
The draft also includes measures aimed at preventing illegal financial activities, such as improving regulatory standards and boosting inter-agency cooperation to identify and block misuse of digital assets.
In addition, the senators have issued a “Request for Information” (RFI) to support the legislative process and have invited the public to share their opinions on more than 35 related topics, encouraging broader engagement in shaping the bill.
Meanwhile, in Asia, Japan-based firm Metaplanet announced that it has added 780 BTC worth $93 million to its digital holdings. This acquisition brings the company’s total Bitcoin reserves to 17,132 BTC, valued at roughly $2 billion. Metaplanet is fast becoming one of the largest institutional Bitcoin treasuries in the region—potentially serving as a model for other firms across Asia.
At the same time, publicly traded U.S. companies have significantly ramped up their Bitcoin holdings. By the end of Q2 2025, these companies had accumulated nearly 900,000 BTC, marking a 35% increase over the previous quarter. This surge, driven primarily by firms such as MicroStrategy, has sent demand for Bitcoin soaring.
Some analysts believe that the $1.5 trillion in free cash flow held by companies within the S&P 500 index could spark a new wave of institutional Bitcoin buying.
Looking ahead, the upcoming week is packed with critical U.S. economic data. Alongside the Non-Farm Payroll (NFP) employment report and inflation metrics via the Personal Consumption Expenditures (PCE) index, the initial estimate for Gross Domestic Product (GDP) and various other indicators will be released—potentially offering a clearer picture of where the U.S. economy is heading.
The Federal Reserve remains primarily focused on inflation and labor market dynamics. June CPI data indicated signs of inflationary pressure caused by tariffs. If Thursday’s PCE report—particularly its core reading—confirms a similar trend, the Fed may decide against a rate cut in September. As a result, financial markets have priced in only about a 65% chance of a rate cut at that meeting.

Markets face a PACKED schedule this weekThe tariff truce between the U.S. and several major trading partners is set to expire on August 1 . A deal with Japan has already been reached, but talks with the EU, Canada, and Mexico remain active.
In monetary policy, the Federal Reserve is widely expected to hold rates steady at 4.5% during its midweek meeting .
Across the border, the Bank of Canada is also expected to leave its interest rate unchanged at 2.75% . After cutting rates twice earlier this year, the BoC is seen as entering a wait-and-see phase.
In Asia, the Bank of Japan will announce its decision on Wednesday . While the BoJ isn’t expected to hike this month, recent U.S.–Japan trade progress has opened the door for policy tightening later this year.
Finally, the week concludes with the U.S. Non-Farm Payrolls report on Friday. Economists expect job gains of around 110,000 in July, down from 147,000 in June.
EURUSD Weekly Analysis: Key Levels and Scenarios to WatchHello, TradingView Community! 👋
Following our last EURUSD analysis, where we accurately predicted a bullish pullback from a key area within a descending channel, the price reacted as expected, delivering a solid move upward. Now, let’s dive into this week’s outlook, focusing on critical levels and two potential scenarios, keeping in mind the major economic events on the horizon. 📊
Current Market Context
EURUSD has recently reacted from a weekly Fair Value Gap (FVG) and is currently navigating the mid-range, with its sights set on Buyside Liquidity at the top. However, reaching this liquidity pool won’t be straightforward, as the price is likely to collect liquidity from lower Premium/Discount Arrays (PD Arrays) before making a significant move.
We’ve identified key levels to watch:
Daily Imbalance FVG (IFVG): A critical support zone where price could find buying interest.
4H Breaker Block: A high-probability reversal zone on the 4-hour chart.
Relative Equal Highs / Previous Week High (PWH) : Acting as a magnet for price action, especially early in the week.
With major economic events like the FED meeting and Non-Farm Payrolls (NFP) looming, volatility is expected. Let’s break down the two potential scenarios for EURUSD this week.
Scenario 1: Price Targets Equal Highs / PWH First 📈
In this scenario, we expect EURUSD to be drawn toward the relative equal highs or previous week’s high (PWH) early in the week, potentially on Monday, forming the high of the week. These levels act as a magnet for price due to trapped liquidity and stop orders.
What to Watch:
Price Action at Equal Highs / PWH: Look for rejection signals (e.g., bearish candlestick patterns, divergence, or liquidity sweeps) indicating a potential reversal.
Confirmation for Shorts: If the price reaches these highs and shows a strong bearish reaction, this could signal a drop toward the Daily IFVG or 4H Breaker Block.
Trading Plan:
Entry: Consider short positions if price rejects at equal highs or PWH with clear bearish confirmation.
Target: Aim for the Daily IFVG or 4H Breaker Block as initial downside targets.
Stop Loss: Place above the equal highs/PWH to protect against a breakout.
This scenario is more likely given the magnetic nature of equal highs and the upcoming economic catalysts driving volatility.
Scenario 2: Price Drops to Daily IFVG / 4H Breaker First 📉
Alternatively, EURUSD could move lower first, targeting the Daily IFVG and potentially the 4H Breaker Block. If the price fails to break above the equal highs and instead drops toward these lower PD Arrays, we could see the low of the week form by Monday or Tuesday.
What to Watch:
Price Action at PD Arrays: Monitor for bullish reversal signals (e.g., absorption, bullish engulfing, or liquidity grabs) at the Daily IFVG or 4H Breaker Block.
Confirmation for Longs: A strong bullish reaction at these levels could signal a move toward the Buyside Liquidity at the top.
Trading Plan:
Entry: Look for long positions if price reaches the Daily IFVG or 4H Breaker Block and shows bullish confirmation.
Target: Target the Buyside Liquidity or intermediate resistance levels.
Stop Loss: Place below the IFVG or Breaker Block to manage risk.
Risk Management: Stay Disciplined! ⚠️
With major economic events like the FED meeting and NFP this week, volatility could spike. Always prioritize risk management:
Position Sizing: Risk no more than 1-2% of your account per trade.
Stop Losses: Always use a stop loss to protect your capital.
Trade Confirmation: Wait for clear price action signals before entering trades.
Avoid Overtrading: Stick to high-probability setups and avoid chasing the market.
Call to Action (CTA) 📢
What do you think about these scenarios? Are you leaning toward Scenario 1 or Scenario 2? Drop your thoughts in the comments below, give this post a LIKE if you found it helpful, and FOLLOW for more weekly analyses! Let’s discuss and trade smarter together! 💬
Stay sharp, manage your risk, and let’s conquer the markets! 🚀
#EURUSD #Forex #TechnicalAnalysis #TradingView

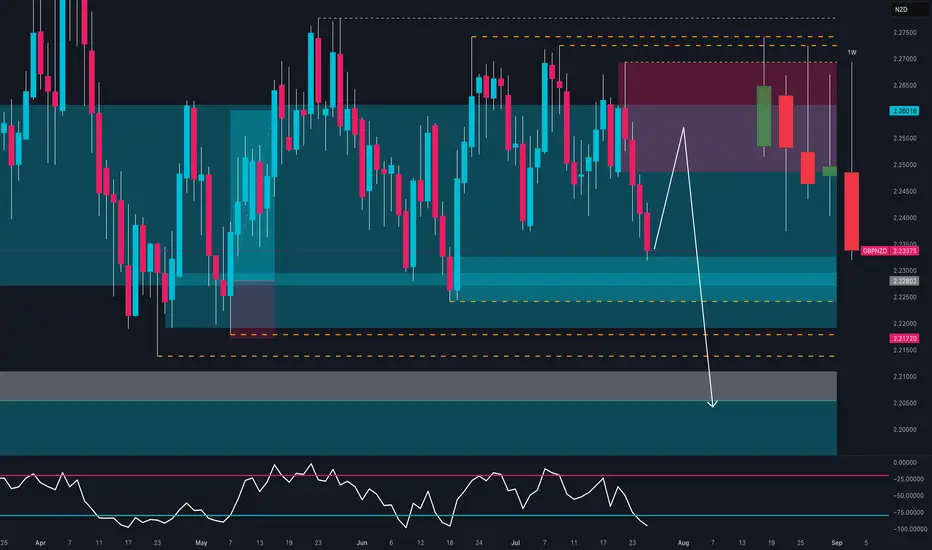
GBPNZD Breakdown – Smart Money Turns Fully Bearish🧠 Macro + COT + Sentiment Context
Commitment of Traders (COT) – Asset Managers
Institutional asset managers are significantly net short on GBPNZD, with positioning at its lowest level of the year and declining sharply since May. This reflects a clear bearish stance from smart money and reinforces the current downward pressure.
Sentiment & Momentum Indicators
DPO: -54.9 → Indicates a moderately bearish momentum phase.
Wyckoff: -20.3 → Price is in a distribution phase, suggesting weakness.
Speed: 3.2 → Low acceleration, but directional bias remains bearish.
Market Mood: Neutral, but leaning into oversold territory.
Seasonality (July 1st – Sept 30th)
Historically, GBPNZD performs positively in this period:
3Y: +1.7%, 5Y: +1.6%, 10Y: +2.3%, 15Y: +2.8%
However, in 2025, price is diverging sharply from seasonal norms. The pair is trading against historical patterns, suggesting a seasonal anomaly where institutional flow is dominating historical behavior.
🧱 Technical Outlook (Daily Chart)
GBPNZD had been consolidating in a clear range between 2.2170 support and 2.2750 resistance since May. The pair has now broken down with a strong, full-bodied weekly candle, closing below the 2.2320 demand zone.
Key Technical Zones:
Supply zone (2.2494–2.2659) → A clear rejection zone that initiated the current selloff.
Demand zone (2.2170–2.2300) → Has been tested twice already, increasing the probability of a clean breakdown.
RSI (Daily) → Currently neutral, with a sequence of lower highs and no bullish divergence in sight — indicating weak momentum.
✅ Conclusion & Trade Plan
Directional Bias: Bearish (Short)
Although seasonality typically supports bullish price action for GBPNZD in Q3, the current context is decisively bearish. Institutional positioning, price structure, and sentiment all confirm a potential shift in direction, reinforced by a confirmed weekly breakdown.
Bearish Targets:
📍 First: 2.2170 (recent support test)
📍 Second: 2.2000–2.1900 (April swing low)
📍 Extension: 2.1750 (base of previous accumulation zone)
Invalidation Criteria:
A weekly close above 2.2490 (supply zone breached)
Bullish RSI divergence + weekly recovery candle
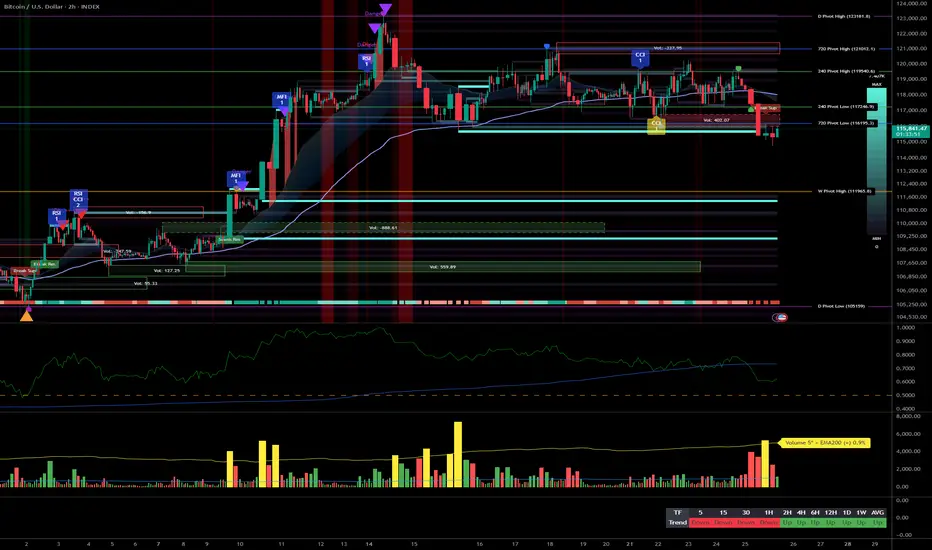
Bitcoin: Strategic Entry Plan on Pullback – 116k Buy Opportunity__________________________________________________________________________________
Technical Overview – Summary Points
➤ Bullish momentum across all higher timeframes (1H to 1W) supported by Risk On / Risk Off Indicator (Strong Buy).
➤ Major supports: 116,128 and 111,980 (multi-timeframe pivots). Key resistance at 123,218.
➤ Very high intraday volumes, pointing towards probable capitulation zones.
➤ Multi-timeframe behaviors: Technical rebound anticipated on the 116,128–115,600 zone, caution if 111,980 breaks.
__________________________________________________________________________________
Strategic Summary
➤ Global Bias: Bullish confirmed mid/long-term.
➤ Accumulation opportunities on key pullbacks near 116,128 and 111,980.
➤ Risk zone: sustained closes below 111,980 = invalidation of bullish outlook (target 105,100).
➤ Macro catalysts: FOMC meeting (July 29-30), heightened event-risk period.
➤ Action plan: favor entries after FOMC volatility resolution, stop-loss adjusted below 111,980.
__________________________________________________________________________________
Multi-Timeframe Analysis
Daily (1D) : Compression under 123,218 resistance, primary bullish trend, no extreme signals.
12H : Healthy consolidation under resistance, no euphoria or panic, normal volumes.
6H : Price squeezed between major supports (116,128–111,980), uptrend confirmed.
4H : Institutional volumes on supports, favors technical rebound.
2H : Speculative rebound underway, confirmation needed for short-term bottom.
1H : Strong capitulation signal, record volumes, immediate retest of 116,128 support.
30min : Local oversold status, extreme sentiment, high technical reversal probability.
15min : Phase of panic likely ending, short-term rebound anticipated.
Key Indicators:
Risk On / Risk Off Indicator: Strong buy on 1D–4H, neutral on 30min and 15min.
ISPD DIV: Neutral to Buy (capitulation signaled on 1H+30min).
Volumes: Very high at lows = capitulation + potential bottom.
MTFTI: Up momentum above 1H, down on lower timeframes (30–5min).
__________________________________________________________________________________
Cross Timeframe Synthesis
High timeframe alignment confirms bullish bias, supported by buyer volumes.
Key zone 116,128–111,980 = multi-timeframe support, tactical focus.
Main risk: break of 111,980.
__________________________________________________________________________________
Operational synthesis & macro context
Bullish bias validated unless breakdown below 111,980.
Tactical accumulation window on pullbacks, 1H confirmation needed.
Volatility risk increases ahead/during FOMC, dynamic stop management essential.
Altcoins fragile: extra caution if BTC triggers Risk Off.
Calendar to watch: FOMC (July 29–30), Durable Goods (July 25).
__________________________________________________________________________________
On-Chain (Glassnode) :
BTC consolidates, no extreme signs; ETH outperforming but caution on alts (elevated leverage).
__________________________________________________________________________________
⏳ *Decision Recap for July 25, 2025, 10:56 CEST:*
— BUY ZONE tactical at 116,128–115,600 (BTC), 1H confirmation required.
— Stop-loss below 111,980 / Swing target >120,000–123,218.
— Risks : Fed announcements, flushes on supports, altcoins at risk.
__________________________________________________________________________________
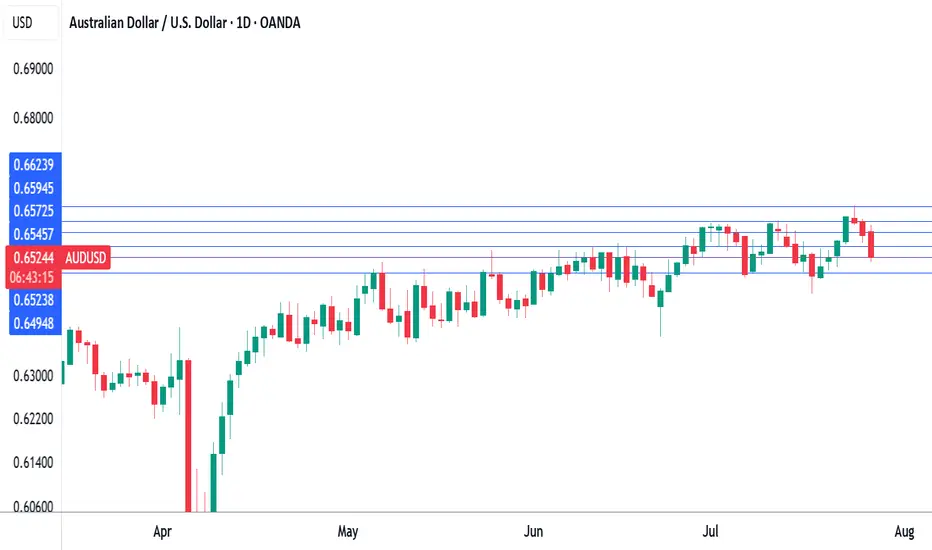
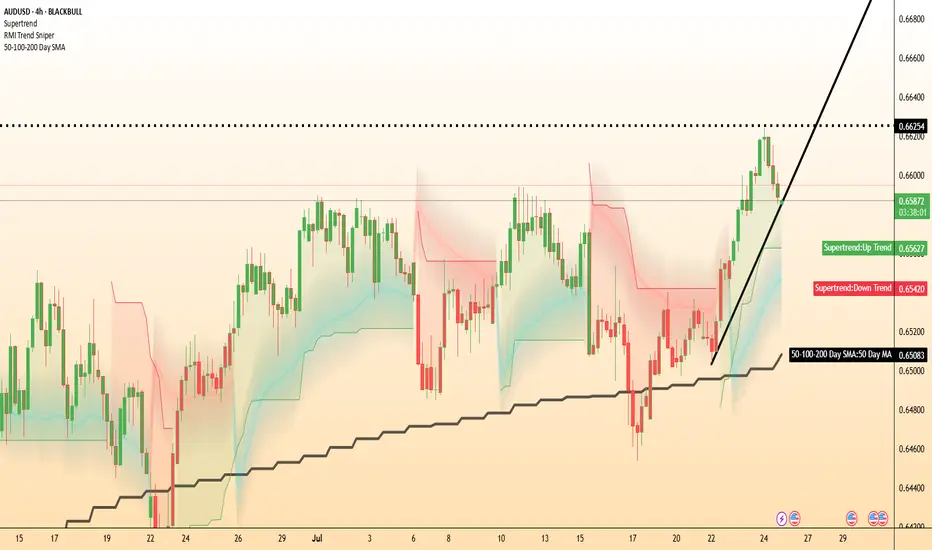
AUD/USD tests uptrend as Trump targets Powell at Fed siteThe US dollar is trading mixed after President Trump made a rare appearance at the Federal Reserve’s renovation site, in an attempt to distract from you know what.
While the visit had no formal policy announcements, Trump did try to further undermine Chair Jerome Powell by erroneously claiming the renovation cost had blown out to 3.1 billion by adding the cost of a building finished 5 years ago.
Meanwhile, AUD/USD could be of the most interest. Traders might like to watch to see if it can hold its uptrend after its downside breakout from yesterday. AUD/USD remains potentially supported above its 50-DMA, with momentum pointing to potential further upside beyond 0.6625.
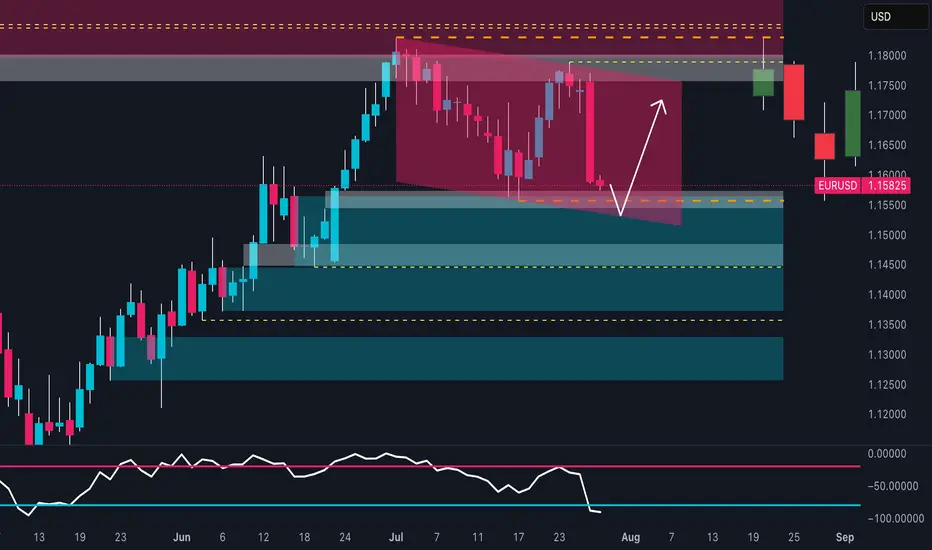
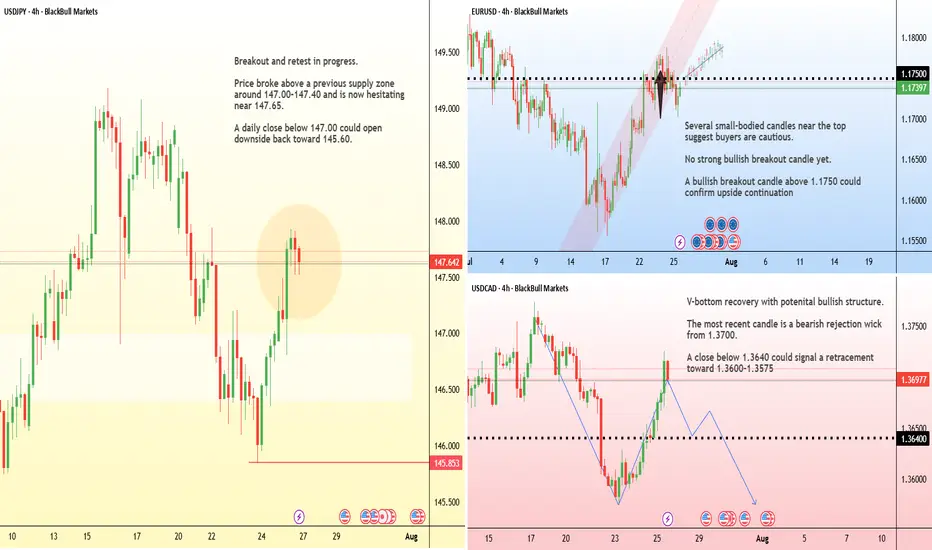
EUR/USD About to Trap the Bears? Final Push Before the Drop! EUR/USD is showing a solid short-term bullish structure, with a move initiated from the demand base around 1.1560, fueling a strong rally toward the current level near 1.1770. Price is now approaching a significant supply zone between 1.1790 and 1.1875, previously responsible for the last major bearish swing. This area also aligns with projected Fibonacci levels (25%-100%), reinforcing its relevance as a possible inflection point.
This movement suggests there’s still room for price to push higher, likely completing the final leg of this bullish cycle before a more convincing short setup develops. At this stage, Fibonacci levels are not acting as firm supports, but rather as hypothetical pullback projections: once price enters the 1.1800–1.1875 area, it will be key to monitor for signs of exhaustion. A rejection here may initiate a bearish retracement toward 1.1670–1.1650, in line with the 62–70.5% fib levels.
Retail sentiment remains highly contrarian: 76% of traders are short, positioning themselves too early against the trend. This imbalance adds fuel for a potential continuation higher, as the market may seek to "squeeze" these premature shorts. Additionally, the COT report confirms growing institutional interest in the euro, with non-commercials increasing their net longs, while USD net long exposure continues to shrink.
Seasonality adds further confluence: late July is historically bullish for EUR/USD, suggesting one final leg up could materialize before a typically weaker August.
✅ Trading Outlook
EUR/USD is technically aligned for a final push toward the 1.1800–1.1875 premium zone, where a potential short opportunity may arise. The rally is currently driven by overextended retail shorts and supportive institutional flows. Only after price interacts with the upper supply zone should reversal signs be evaluated, with correction targets around 1.1670–1.1650. The ideal play: wait for confirmation of bearish intent in August, when seasonal weakness typically kicks in.

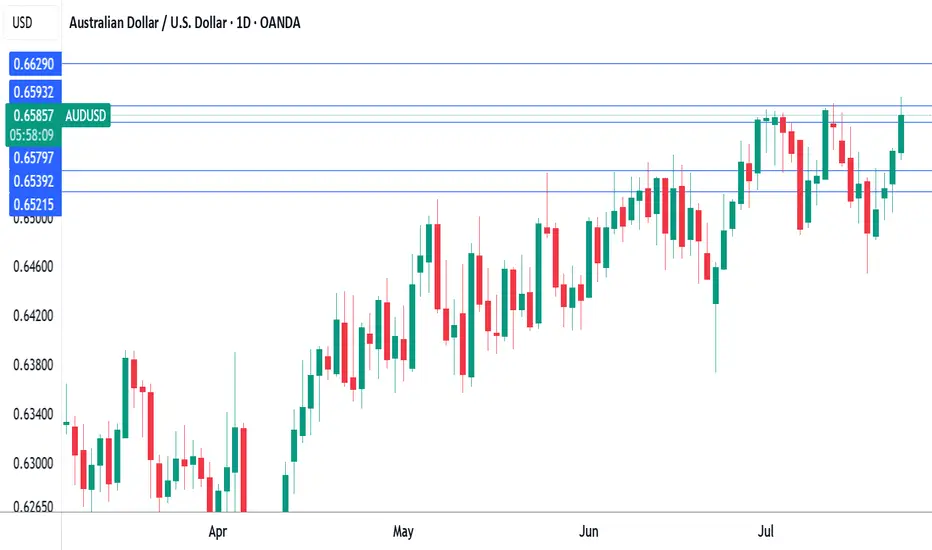
Australian dollar hits eight-month high on risk-on moodThe Australian dollar has rallied for a fourth sucessive day. In the North American session, AUD/USD is trading at 0.6588, up 0.50% on the day. The red-hot Aussie has jumped 1.6% since Thursday and hit a daily high of 0.6600 earlier, its highest level since Nov. 2024.
The financial markets are in a risk-on mood today, buoyed by the announcement that the US and Japan have reached a trade agreement. Under the deal, the US will impose 15% tariffs on Japanese products, including automobiles. As well, Japan will invest some $550 billion into the US.
Global stock markets are higher and the Australian dollar, a gauge of risk appetite, has climbed to an eight-month high.
Investors also reacted positively today to reports that negotiations between the US and China were speeding up and the US could grant an extension of the August 12 deadline to reach an agreement. The latest positive developments on the tariff front have raised hopes that the US will also sign trade deals with the European Union and South Korea.
The White House continues to put pressure on the Federal Reserve. Earlier this week, Treasury Scott Bessent called for a thorough review of the Federal Reserve. Bessent echoed President Trump's calls for the Fed to lower interest rates.
Fed Chair Jerome Powell hasn't shown any signs of plans to cut rates and has fired back that the uncertainty over Trump's trade policy has forced the Fed to adopt a wait-and-see policy. The Fed is widely expected to hold rates at the July 30 meeting but there is a 58% likelihood of a rate cut in September, according to CME's FedWatch.
AUD/USD has pushed above resistance at 0.6579 and tested resistance at 0.6593 earlier. Next, there is resistance at 0.6629
0.6539 and 0.6521 are the next support levels
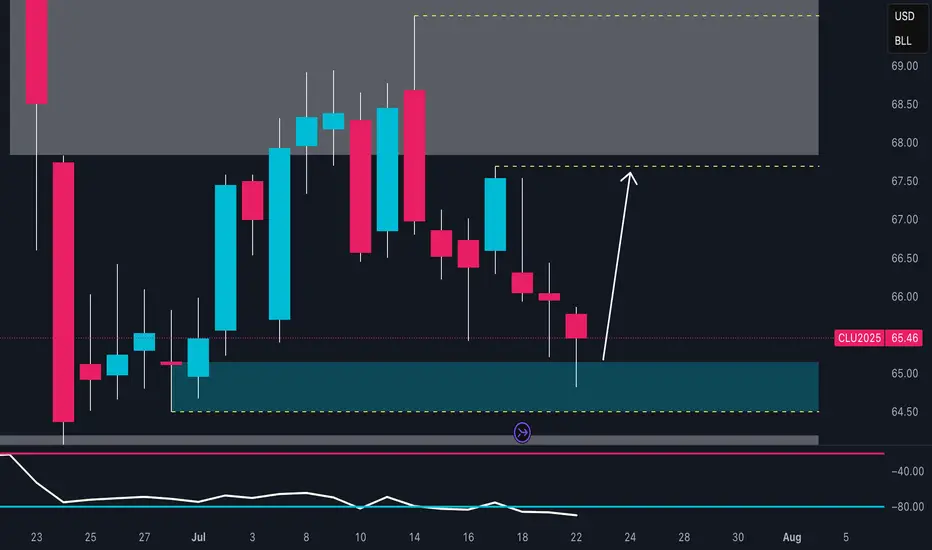
Crude Oil Rebound Incoming? Key Demand Zone 📈 1. Technical Analysis – Daily Chart (CL1!)
The price has returned to a demand zone between 64.60 and 65.30, an area that previously triggered strong bullish reactions.
The July 22nd candle shows a clear lower wick, indicating potential buyer absorption and a possible short-term reversal.
The next key resistance lies between 67.80 and 68.80, which aligns with a well-defined supply zone.
Daily RSI remains weak but shows signs of bullish divergence, suggesting potential accumulation.
Bias: bullish from current levels, targeting 67.50 – 68.00. Invalidation on a daily close below 64.40.
2. Institutional Sentiment – COT Report (CFTC, July 15, 2025)
Non-Commercials (Speculators)
Long: 308,915 (↓ -24,223)
Short: 146,488 (↑ +22,724)
Net Position: sharply declining → bearish divergence in speculative sentiment
Commercials (Hedgers)
Long: 857,803 (↑ +66,342)
Short: 1,046,199 (↑ +18,118)
Net Position: still negative, but improving → reduced hedging = less downside pressure
📉 Interpretation:
Funds are closing longs and adding shorts, showing bearish positioning. However, commercials are slowly reducing their hedging exposure, which could indicate short-term stabilization if the technical support holds.
3. Seasonality
Periods analyzed: 20, 15, 10, 5, and 2 years
July historically shows negative average returns:
-0.71% (20Y)
-1.26% (15Y)
-1.37% (10Y)
The seasonal pattern indicates continued cyclical weakness into August.
📌 Interpretation:
The summer period typically brings seasonal bearish pressure, which aligns with current 2025 performance.
🌐 4. Macro & Fundamentals
EIA inventory builds for 3 consecutive weeks → demand weakness in the U.S.
No additional OPEC+ cuts announced → supply remains ample
Stable inflation data in the U.S. and China → no uptick in energy demand
Overall macro data is neutral with a slightly bearish short-term bias
Will The Emerging Uncertainties Support Gold Ahead?Macro approach:
- XAUUSD advanced this week, supported by broad-based US dollar weakness and reviving safe-haven demand amid rising global trade tensions. The yellow metal briefly reached a five-week high as investors sought safety following headlines of escalating US tariffs and uncertainty over the Fed’s policy direction.
- Gold may remain well-supported if risk aversion persists, with upcoming global PMIs and further US trade developments set to guide market direction. Additional Fed commentary and central bank actions could trigger new volatility for XAUUSD throughout the week.
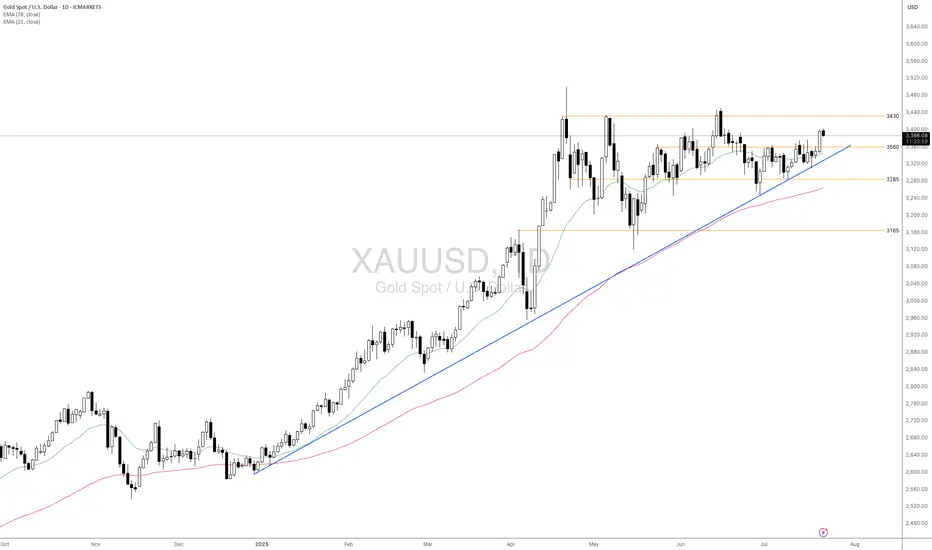
Technical approach:
- XAUUSD remains above both the EMA21 and EMA78, reflecting ongoing bullish momentum. The recent price action shows consolidation below the resistance at 3430 after rejecting the swing high. In contrast, higher lows have formed above the ascending trendline and the support at 3285.
- If XAUUSD stays above the support at 3560, it may extend towards the previous swing high at around 3430 and open for another record high.
- On the contrary, if the price drops below the support at 3560 and the ascending trendline, it may retreat toward the following support at 3165.
Analysis by: Dat Tong, Senior Financial Markets Strategist at Exness
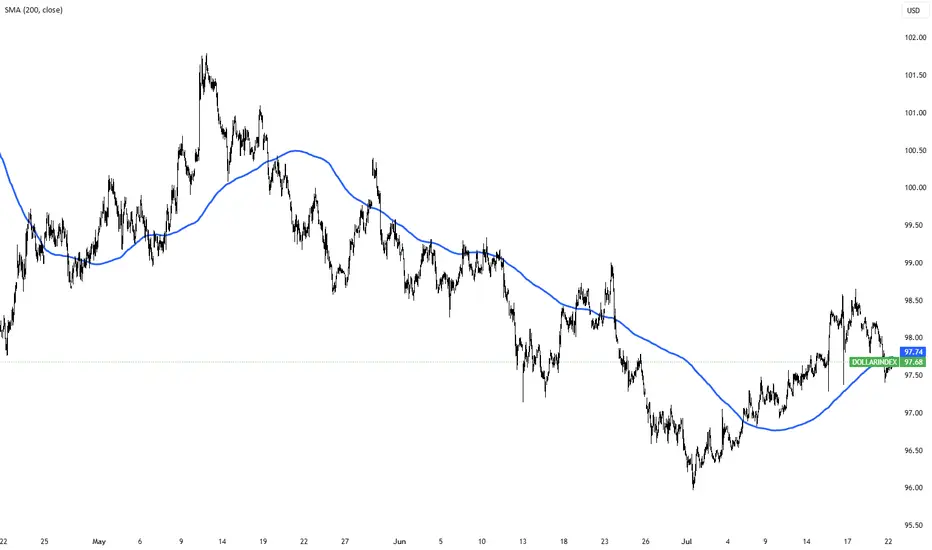
Dollar Index Holds Below 98 as Markets Await Trade Deal ProgressThe dollar index remained below 98 today, extending its two-day decline as investors watched trade negotiations ahead of the August 1 deadline. Treasury Secretary Scott Bessent said deal quality is the priority, suggesting Trump could grant extensions to countries showing real progress.
Markets are also focused on Fed Chair Powell’s speech for signals on interest rates. Despite Trump’s push for a cut, traders are not expecting action this month.
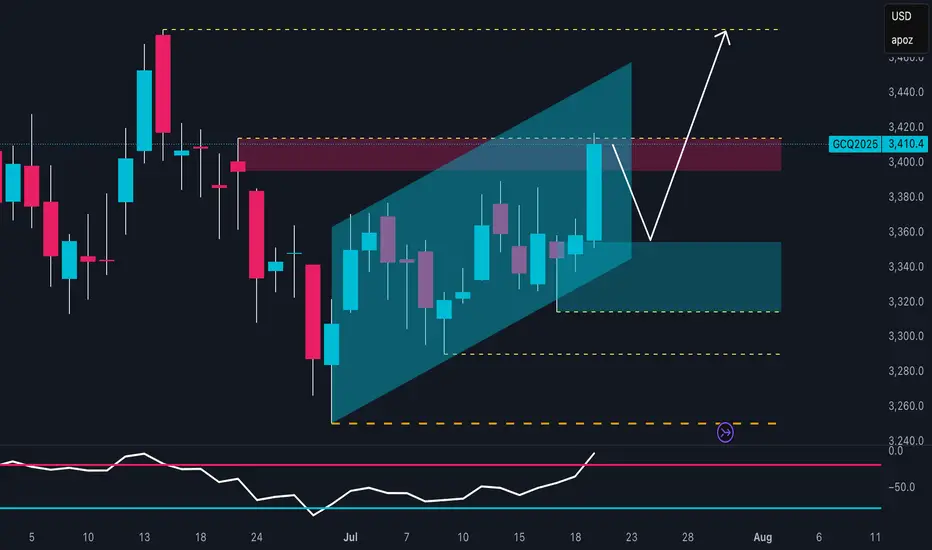
Gold Bulls Reloading? Smart Money Buys!The technical outlook on XAU/USD shows a well-defined bullish trend, developing within an ascending channel that started in late June. Price recently pushed toward the upper boundary of this channel, reaching a key resistance zone between 3,410 and 3,420 USD, which aligns with a previous supply area and significant daily structure. The reaction in this zone suggests a potential fake breakout, hinting at a short-term pullback before a continuation of the upward move.
The RSI oscillator supports this view, displaying bullish momentum with a breakout above the 60 level. However, the current slope hints at a possible minor correction before the next impulsive leg higher. The most relevant demand zone lies between 3,340 and 3,360 USD, at the base of the ascending channel—an ideal spot for buy orders to accumulate in anticipation of a move toward previous highs.
Backing this technical setup, the Commitment of Traders (COT) report as of July 15, 2025, paints a constructive picture. Non-commercial traders (institutional speculators) increased their long positions by over 8,500 contracts, while also cutting short positions by about 1,600 contracts, indicating a strong bullish bias. Commercials also increased their shorts (+16,448), a typical hedge during rallies, but not enough to invalidate the bullish structure.
From a seasonal perspective, July remains one of the historically strongest months for gold. According to MarketBulls data, over the past 2 years, gold has averaged gains of 105+ points in July, with solid returns also visible on the 5-year (+45 pts) and 10-year (+25 pts) averages. August also tends to be supportive, reinforcing the idea of a medium-term bullish extension.
Lastly, the retail sentiment is heavily skewed, with 72% of retail traders short, and only 28% long. From a contrarian standpoint, this is another strong bullish signal. When the majority of retail traders are short in a structurally bullish market, the potential for a short squeeze remains high.
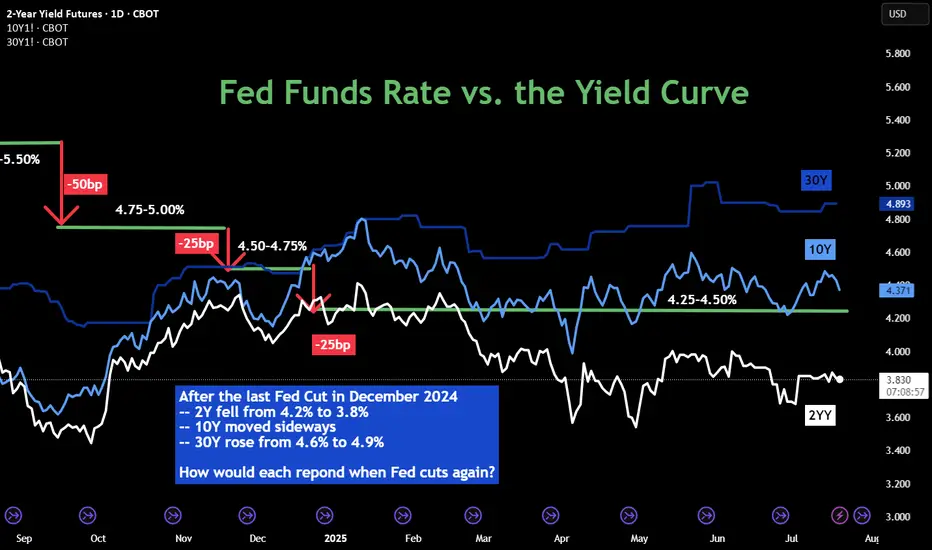
10Y: Positioning for a Falling Yield EnvironmentCBOT: Micro 10 Year Yield Futures ( CBOT_MINI:10Y1! ), #microfutures
The Federal Reserve last cut interest rates in December 2024. Since then, it has kept the rates unchanged in its January, March, April and June FOMC meetings. While the official Fed Funds rate stays at 4.25-4.50% in the past seven months, we have seen diverging trends in the interest rate market:
• 2-Year Yield has trended down from 4.25% to around 3.85%;
• 10-Year Yield mostly moved sideways, currently at 4.42%;
• 30-Year Yield rose from 4.60% to top 5.00% in May, then pulled back to 4.89%.
The futures market expects the Fed to cut rates once or twice in the remaining four FOMC meetings in 2025, according to CME Fed Watch Tool.
• As of July 20th, there is a 95.3% chance that the Fed will keep rates unchanged in its July 30th meeting;
• The odd of lowering 25 bps is approximately 60% for September 17th;
• By the last 2025 meeting on December 10th, futures market sees just 6.4% chance that the Fed keeps the rates at current level 4.25-4.50%, while the odds of 1 cut to 4.00-4.25% are 29.2%, and the odds of 2 cuts to 3.75-4.00% are 64.3%.
The Fed’s Challenges
The Fed tries to fulfil its dual mandate established by the Congress: (1) to support maximum employment and (2) to maintain price stability. Its official targets are to keep the unemployment rate below 4%, as measured by the BLS nonfarm payroll data, and to keep the inflation rate at 2%, as measured by the PCE price index. When we face an outlook of rising prices and slowing employment, the Fed will have a hard time meeting both policy goals.
Firstly, as the Trump Administration raises tariffs for all trading partners on all imports, it’s a matter of time before the inflation rate picks up again. Even if many countries may reach trade agreements with the U.S., they will still get a bigger tax bill.
• According to the Bureau of Economic Analysis (BEA), the total US imports of goods and services was $4.1 trillion for 2024.
• Imports account for 14% of the US GDP in 2024, which is $29.2 trillion (BEA data).
• Simple math suggests that a universal 10% tariff hike could contribute to 1.4% in price increases, assuming all tariffs are passed through to the retail prices.
The most recent inflation data is the June CPI at 2.7% (BLS data). The tariff hike could easily push inflation to twice the Fed policy target. Therefore, cutting rates will be a very difficult decision if inflation rebounds.
Secondly, US employment growth has slowed down significantly in 2025. On July 3rd, the BLS reported total nonfarm payroll increased by 147,000 in June, and the unemployment rate changed little at 4.1 percent. Current employment growth is less than half the level in December 2024, which saw the data above 300,000.
There are weaknesses in the payroll data. All private sectors combined accounted for about half of the employment gain, or 74,000. Government jobs, while at a much smaller base, accounted for the other half.
Tariffs raise the cost of input, while business borrowing costs remain high at current rate level. To support growth and maximum employment, cutting rates make sense.
Finally, the Fed is under tremendous pressure from the Administration. President Trump openly and repeatedly calls for a 300bp cut.
In an ideal world, the Fed wants to make monetary policy decisions free of political interference. It may not be the case. Let’s look at the Fed rate decisions during the first Trump presidential term. The current Fed Chair was appointed to the role by President Trump in February 2018.
• The Fed raised interest rates four times in 2018, for a total of 100 basis points, with the Fed Funds rate increased from 1.25-1.50% to 2.25-2.50%.
• Under pressure from the White House, the Fed cut rates three times in 2019 for a total of 75 basis points, with the Fed Funds rate ending at 1.50-1.75%.
• In 2020, in response to the Pandemic, the Fed cut rates by 150 points, all the way to a zero-rate environment (0%-0.25%).
In my opinion, the Fed will cut rates this year, similar to 2019. Once the Fed Chair retires in May 2026, his replacement, who will be nominated by President Trump, will no doubt follow his guidelines and bring the Fed Funds rate all the way down to 1%-2% level.
While there is uncertainty in the timing and pace, we are likely to embark on the path to low interest-rate environment.
Shorting Micro 10-Year Yield Futures
A trader sharing a bearish view on interest rates could explore shorting the CBOT Micro 10-Year Yield Futures ($10Y).
Last Friday, the August 10Y contract (10YQ5) was settled at 4.425. Each contract has a notional value of 1,000 index points, or a market value of $4,425. To buy or sell 1 contract, a trader is required to post an initial margin of $300. The margining requirement reflects a built-in leverage of 14.7-to-1.
Let’s use a hypothetical trade to illustrate how to use a short futures position to take advantage of a potential Fed rate cut.
Hypothetical Trade:
• Short 1 10YQ5 at 4.425, and set a stop loss at 4.60
• Trader pays $300 for initial margin
Scenario 1: Fed keeps rates unchanged on July 30th, 10Y moves sideways
• If Futures price changes little after the July FOMC, the trader could close the position
• He could short the September contract 10YU5, with an eye open for the September 17th FOMC rate decision
• This is a futures rollover strategy.
Scenario 2: Fed cuts 25 bps on July 30th, 10YU5 falls 250 points to 4.175
• Short position gains: $250 (= (4.425-4.175) x 1000)
• The hypothetical return will be 83% (= 250 / 300)
Happy Trading.
Disclaimers
*Trade ideas cited above are for illustration only, as an integral part of a case study to demonstrate the fundamental concepts in risk management under the market scenarios being discussed. They shall not be construed as investment recommendations or advice. Nor are they used to promote any specific products, or services.
CME Real-time Market Data help identify trading set-ups and express my market views. If you have futures in your trading portfolio, you can check out on CME Group data plans available that suit your trading needs www.tradingview.com
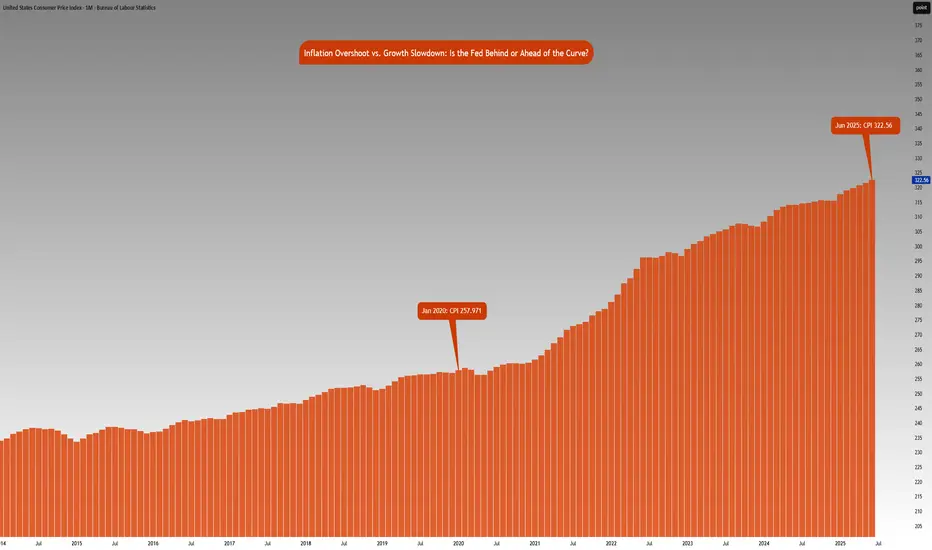
Inflation vs. Growth : Is the Fed Behind or Ahead of the Curve?CME_MINI:NQ1! CME_MINI:ES1! CME_MINI:MNQ1! CME_MINI:MES1! CBOT:ZN1!
Fed Policy recap:
There is an interesting and unusual theme to keep an eye on this week. The Fed is in a ‘blackout period’ until the FOMC meeting- this is a customary quiet period ahead of an FOMC policy meeting. Fed Chair Powell is scheduled to give a public talk on Tuesday. Although his address will be focused on the capital framework of the large banks, this appearance will be closely watched for any subtle signals on the FOMC policy stance.
Especially given that last week, Federal Reserve Governor Chris Waller made a speech, “The Case for Cutting Now” with a purpose as he stated to explain why the FOMC should reduce rate by 25 bps at the July 30th, 2025 meeting.
His stated reasons were:
1. Tariffs create one-off price level increases with transitory inflation effects, not sustained inflation momentum.
2. He argued that much of economic data points towards interest rates should be lowered to FOMC’s participants' median neutral rate, i.e, 3%.
3. His third stated reason notes that while the state of the labor market looks resilient on the surface, accounting for expected data revisions, private-sector payroll growth has peaked, with more data suggesting increased downside risks.
His speech further explains:
• Growth has decelerated sharply: Real GDP rose only ~1% annualized in 1H25, a significant slowdown from 2.8% in 2H24, and well below long-run potential.
• Consumer spending is weakening, with real PCE growth falling to ~1%, and June retail sales showing soft underlying momentum.
• Broader labor market indicators, including the Beige Book and JOLTS data, show declining labor demand and hiring caution, suggesting increasing downside risks to employment.
• Inflation is slightly above target (PCE ~2.5%) but driven primarily by temporary, one-off tariff effects. Core inflation ex-tariffs is likely near 2%, and expectations remain anchored.
• Current fed funds range (4.25%–4.50%) is well above neutral (3%), implying excessive restraint.
• With inflation risks subdued and macro conditions deteriorating, a preemptive rate cut now provides optionality and avoids falling behind the curve if the slowdown deepens. Further cuts may be warranted if trends persist.
• The tax bill contains pro-growth provisions, but its economic impact is expected to be minimal in 2025.
Source: Federal Reserve Speech, The Case for Cutting Now Governor Waller
Inflation Analysis:
Let’s compare this with what we have previously mentioned regarding inflation. CPI index stood at 257.971 points in January 2020. Projecting this at a 2% Fed target, June 2025 inflation should be around 287.655 points. However, June 2025 inflation is currently at 322.56 index points, 12.2% higher above 2% the inflation trend. Effectively, this means annualized inflation since January 2020 is roughly 4.15%.
The Fed is in a real dilemma whether cutting rates given the inflation trend in the last 5 years and risks to inflation outlook justify cutting rates.
Key Questions to ask
Markets are forward looking. Investors and participants want to know:
• How will the rates impact the cost of debt service? Currently the third largest government expenditure, over $1.03 trillion.
• Will the tariff rate offset the tax revenue losses by extending tax cuts?
• Is the fiscal path sustainable?
• What happens to the long end of the yield-curve?
• Will the Fed monetize the debt issuance imbalance?
• Is this simply Governor Waller positioning himself for the next appointment of Fed Chair when Fed Chair Powell’s term expires in May 2026?
It seems there is a huge conflict between longer term implications vs quick short term fixes that align with US administration objectives.
The Week ahead:
It is a relatively light economic calendar in the US. Flash PMI readings and housing data on the docket. The primary focus as it has been for most weeks since President Trump took office, will be on the developments in trade policy and any further comments on Fed and Chair Powell. The threat of renewed tariffs starting August 1st, is also key to monitor and whether these protectionist measures will force US’s trading partners to make further concessions to negotiate trade deals.
The earnings season is off to a good start with major US banks reporting higher EPS and revenue than expectations. This week investors will be looking at Q2 earnings reports from Alphabet, Meta, Microsoft from the Mag 7 and Tesla.