Approachable Contracts for Trading Around Fed DecisionsCME Group E-Mini S&P Options ( CME_MINI:ES1! ) and Micro S&P Futures ( CME_MINI:MES1! ), #microfutures
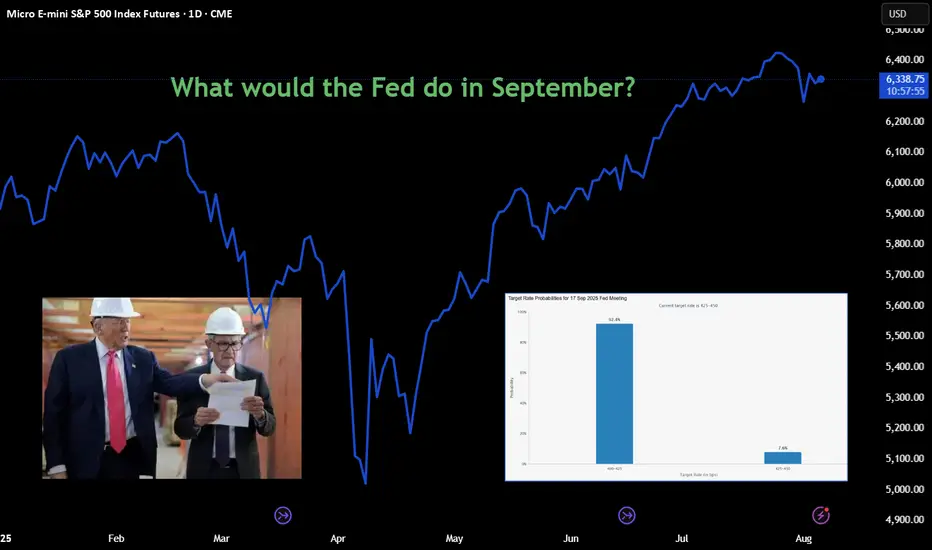
On July 30th, the Federal Open Market Committee (FOMC) decided to keep the Fed Funds rate unchanged at the 4.25-4.50% target range. Investors now turn their focus on whether the Fed will cut rates on the September 16th-17th FOMC meeting.
According to CME FedWatch Tool, as of August 6th, there is a 92.4% chance that the Fed will cut rates by 25 bps in September. My observation:
• Before July FOMC, market consensus was no rate cut, with the odds at 95.3% as of July 20th. Investors now overwhelmingly expect rate cuts to come at the next meeting.
• Two Fed governors broke the long-run consent and voted against the FOMC decision.
Today, I would like to explore two trading strategies focusing on the next Fed decision.
We will start by breaking down all possible Fed decisions as follows:
1) Cut rates by 25 basis points (92.4%)
2) No rate cuts (7.6%)
3) All others, such as cutting by 50 bps and raising rates by 25 bps (0%)
If we deem the 3rd option to be statistically insignificant, we now have an event with binary outcomes, namely, Cut and No Cut .
Since “Cut” is the market consensus, we will translate the possible outcomes as:
• Meet market expectations (Cut Rates)
• Exceed market expectations (No Cut)
Furthermore, financial markets will likely react calmly if the Fed decision meets expectations, while asset prices could swing widely if the FOMC exceeds expectations.
Typically, US stock market indexes, interest rate contracts and the US dollar exchange rates are very sensitive to the Fed decisions. Our discussion today will focus on stock indexes. I will follow up on the other two asset classes in future writings.
Based on the above analytical framework, we could design two sets of trading strategies:
Sell Call Options if a trader expects the Fed to cut rates
• Since the decision meets expectations, asset prices would not move a lot.
• Options may expire worthiness, which allows sellers to pocket the premium as profit.
Sell Futures if a trader expects No Cut
• Since the decision exceeds expectations, S&P prices could go down sharply.
• With build-in leverage in futures contracts, a trader could realize enhanced profit.
Now, let’s explore how to structure trading strategies using S&P futures and options.
Hypothetical Fed Decision 1: Meet Expectations
Cutting rates is bullish for S&P as it will lower borrowing costs for component companies. However, since market already priced in a Fed cut, stock prices will not move a lot.
If a trader shares this view, he could explore selling Out-of-the-Money (OTM) Call Options on CME E-Mini S&P 500 futures ( NYSE:ES ).
Each ES contract has a notional value of $50 x S&P 500 Index. On August 6th, the September ES contract (ESU5) is quoted at 6,341, making the notional value at $317,050.
• Call options at the 6500-strike are quoted at $42. By selling 1 call, options seller will receive $2,100 in upfront premium (= 42 x 50).
• Options expire on September 19th, two days after the FOMC. If ESU5 price does not exceed 6500, options seller will pocket the premium as profit.
• Warnings: selling options involves significant risks. Seller could lose more than the premium he collected. To cut losses, seller could buy back at the open market and exit the position. This will avoid losses to accumulate by expiration date.
Hypothetical Fed Decision 2: Exceed Expectations
Since rate cut is already priced in, an Unchanged decision will likely cause the S&P to fall sharply, as expected future borrowing costs will go up.
If a trader shares this view, he could explore selling CME Micro S&P 500 futures ( MSTAR:MES ).
Each MES contract has a notional value of $5 x S&P 500 Index. On August 6th, the notional value of ESU5 is $31,705. Buying or selling 1 futures contract requires an upfront margin deposit of $2,135 at the time of this writing.
Micro S&P 500 futures are 1/10 in notional comparing to its E-Mini counterpart. With smaller size and lower margin requirement, the micro contracts are more approachable for non-professional traders. At the same time, they also enjoy the leverage built-in the futures contracts. Micro S&P contracts tap into the liquidity pool with the broad S&P contract suite.
Hypothetical Trade
• Short 1MESU5 at 6,341, and set a stop loss at 6450
• Trader pays $2,135 for initial margin
A “Meet” Scenario: S&P go up 1.5% to 6,436
• Short position loss: $475 (= (6436-6341) x 5)
• The maximum loss will be $545 if the S&P moves higher, due to the stop-loss feature
An “Exceed” Scenario: S&P falls 5% to 6,024
• Short position gain: $1,585 (= (6341-6024) x 5)
• The theoretical return is 74.2% (= 1585/2135), excluding transaction fees
Happy Trading.
Disclaimers
*Trade ideas cited above are for illustration only, as an integral part of a case study to demonstrate the fundamental concepts in risk management under the market scenarios being discussed. They shall not be construed as investment recommendations or advice. Nor are they used to promote any specific products, or services.
CME Real-time Market Data help identify trading set-ups and express my market views. If you have futures in your trading portfolio, you can check out on CME Group data plans available that suit your trading needs www.tradingview.com
Federalreserve
Markets Eye Policy, Positioning, and PerformanceCME_MINI:NQ1! CME_MINI:ES1! CME_MINI:MNQ1! COMEX:GC1! FRED:FEDFUNDS
Happy 4th of August, Traders!
As we head into the new week, here’s a look at what’s on the calendar:
Key Economic Data Releases
Monday:
• Factory Orders (MoM) – June
• Supply: 3-Month Bill Auction, 6-Month Bill Auction
Tuesday:
• Trade Balance (June), Exports (June), Imports (June)
• S&P Services PMI (July), ISM Non-Manufacturing PMI (July)
• Atlanta Fed GDPNow (Q3) – Prelim
• Supply: 52-Week Bill Auction, 3-Year Note Auction
Wednesday:
• German Factory Orders (MoM) – June
• Crude Oil Inventories
• FOMC Member Daly speaks at 11:45 CT
• Fed Governor Cook speaks at 1:00 CT
• Supply: 17-Week Bill Auction, 10-Year Note Auction
Thursday:
• Bank of England Interest Rate Decision
• BoE MPC Meeting Minutes, Inflation Letter, MPC Vote
• BoE Governor Bailey speaks at 8:15 CT
• FOMC Member Bostic at 9:00 CT
• Supply: 30-Year Bond Auction
Crude Oil Update
OPEC+ V8 members have announced an additional 547K bpd unwinding of voluntary cuts. Notably, crude prices have not reacted significantly to the expected OPEC+ figures. As we’ve previously highlighted, the market's focus remains firmly on demand-side factors. Despite geopolitical shocks, trade tensions, and recession concerns, crude oil prices have remained relatively stable—trading within a consistent range for over two and a half years since August 2022. According to Amena Bakr at Kpler, the V8 will meet again on September 7th to potentially reassess the reinstatement of 1.65 million bpd of cuts, currently scheduled to remain in place until the end of 2026.
Earnings Recap
With over half of S&P 500 companies having reported Q2 earnings, YoY earnings growth is now projected at 9.8%, compared to the 5.8% estimate as of July 1, per LSEG data cited by Reuters. More than 80% of reporting companies have surpassed analyst profit expectations—well above the 76% average from the past four quarters.
Macro Outlook
Fed Vice Chair Williams provided further insight into the central bank’s posture ahead of the September FOMC meeting, stating he remains open-minded but continues to believe that modestly restrictive policy is warranted. Williams also emphasized that the notable downward revisions to May and June payrolls were the key takeaway from Friday’s jobs report, reinforcing the theme of softening labor market momentum.
In addition, the Fed announced on Friday that Governor Lisa Cook will resign from the Board effective August 8. A replacement is expected to be named in the coming days, though it is not anticipated to materially alter the policy outlook in the near term.
Looking ahead, if both inflation and unemployment tick higher between now and the September FOMC meeting, it would represent a worst-case scenario for the Fed. The August NFP report due on the first Friday of September and July and August 2025 inflation reports are key data points to monitor before the next FOMC Meeting on September 17th, 2025.
Although equity futures sold off on Friday following a disappointing jobs report, market pricing has adjusted notably. Participants now expect the Fed to deliver three rate cuts in 2025 and two cuts of 25bps each in 2026. This marks a shift from pre-NFP expectations of two cuts in 2025 and three cuts in 2026, per CME FedWatch Tool.
Market Implications:
On the back of rate cut expectations, in our analysis, this may help sustain upside in the equities complex. Although, it may be prudent to adjust portfolio and re-balance strategically according to sectors that may continue to outperform namely tech, AI, defense stocks, commodities and USD per our analysis.
FOMC rate decision 30-07-2025FOMC announced no change to interest rate, but the new tariffs is the major player for the upcoming quarter, we shall see its effect on the economy and corporates earnings soon, then the fed can make better judgment whether to lower interest rate or not.
Disclaimer: This content is NOT a financial advise, it is for educational purpose only.

DXY with interest rates With interest rates remaining steady, the U.S. Dollar is currently moving in a bullish direction.
As shown in the chart, it seems likely that price will break the previous high and form a bullish Quasimodo (QM) pattern. The price may then reach the 50% Fibonacci level.
After that, we should wait and observe the market's reaction.
If price gets rejected from the 103 zone — especially if accompanied by a rate cut or bearish price action — we could see a sharp decline toward the 95 area.
This 95 zone also aligns with a key weekly Fibonacci support level on the Dollar Index.
As long as the Federal Reserve maintains its hawkish stance, the U.S. Dollar may continue its upward momentum. However, the 103–104 zone — which aligns with the 50% Fibonacci retracement and a significant supply area — could serve as a strong resistance.
If price gets rejected from this area and we simultaneously see signs of a rate cut or weakening U.S. economic data, a trend reversal and corrective phase could begin. In that case, lower targets around 95 or even 93 could become likely in the medium term.
good luck

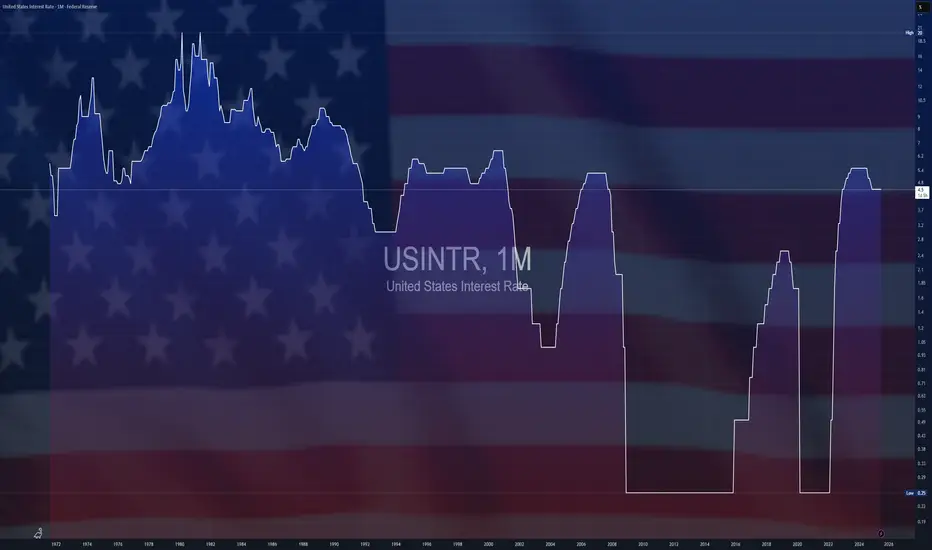
$USINTR -Feds Leaves Rates Steady (July/2025)ECONOMICS:USINTR
July/2025
source: Federal Reserve
- The Federal Reserve held rates steady at 4.25%–4.50% for a fifth straight meeting, defying President Trump’s demands for cuts even after positive GDP growth .
Still, two governors dissented in favor of a cut—the first such dual dissent since 1993.
Policymakers observed that, fluctuations in net exports continue to influence the data, and recent indicators point to a moderation in economic activity during the first half of the year.
The unemployment rate remains low, while Inflation somewhat elevated.
Countdown to Powell’s rate decision: What to watch WednesdayFederal Reserve Chair Jerome Powell is under mounting pressure from President Donald Trump to begin cutting interest rates.
Markets and analysts overwhelmingly expect the Fed to hold rates steady this Wednesday.
But what if the political heat is becoming too much to bear, and Powell and the Fed board advocate for a cut this week? Some Fed governors, Chris Waller and Michelle Bowman , have already signaled support for an early cut.
FX pairs to watch
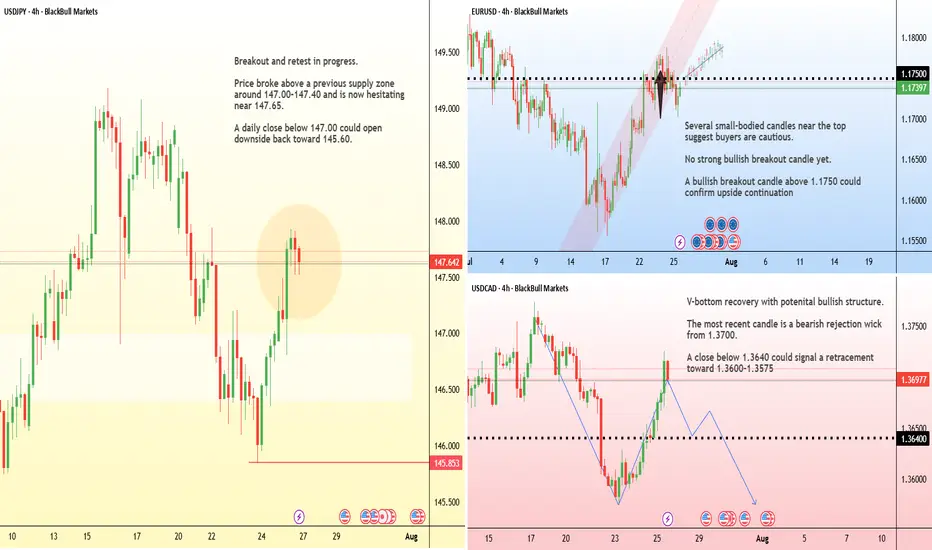
USD/JPY:
This pair remains highly sensitive to yield differentials and broader risk sentiment. However, any hawkish resistance or emphasis on data dependency may keep the pair supported, especially if risk appetite holds.
EUR/USD:
The euro has shown relative strength in recent sessions, but the pair has been hit by the announcement of the trade deal struck between the EU and US. If the Fed clearly signals it's not ready to ease, the USD could regain even ground.
While we see markets fall, lets remember - FED on 30th
When you look on 1 hour or 4 hour charts, our hearts miss a beat...
"Bitcoin is Crashing"
But as you can see on a weekly chart, it really is nothing more than a little hiccup...not even that !
We can drop to 110K before you need t really watch
This cycle has seen so many similar instances.
But we do need to be alert to make sure this fall does on continue for what ever reason
But when we remember that on Wednesday, the FED gives us the rate decision for the USa, it all becomes clear, because this happens almost everytime before a rate decision is announced.
The chart above is the daily smapshot of a weekly chart I have been posting since 2021, about Rate Announcements by the FED.
You can see the red candles before each occasion, the Red vertical lines being approx the day the FED announced the decision. ( Approx as it is a weekly chart normaly and I do not "Zoomin" to get the day count perfectly as it becomes lost when I came back out to a week chart)
But you get the idea
do not panic
This is the weekly chart of that FED RATE effects in Bitcoin PA....over all..NO EFFECT
The effect has always been on the companies that can provide bitcoin
So, Keep your Cool. anf HOLD BITCOIN

Tariffs, Trade Deals, & Central Bank Watch: Key Week in MarketsCME_MINI:NQ1! CME_MINI:ES1! CME_MINI:MNQ1! COMEX:GC1! CME_MINI:MES1! NYMEX:CL1!
This is a significant week in terms of macroeconomic headlines, key data releases, central bank decisions, and major trade policy developments. We get numbers for growth, inflation and decision and insights into monetary policy. Combining this with ongoing trade policy developments, we have a key week which may shape how the rest of the year unfolds.
Below is a consolidated summary of the latest trade negotiations, scheduled economic releases, and policy outlooks.
US - EU Trade Deal:
• US–EU Tariffs: The US will impose a 15% tariff on most EU goods, including cars, semiconductors, and pharmaceuticals, but retain a 50% tariff on steel and aluminium with a new quota system.
• Exemptions: Zero-for-zero tariffs agreed for agriculture, aircraft parts, and chemicals; aircraft exports are temporarily exempt.
• EU Commitments: The EU will invest $600 billion in the US and purchase $750 billion in US energy, mainly LNG.
• Agriculture: The EU will lower tariffs on many US agricultural goods, though not comprehensively.
• Political Reactions: EU leaders are mixed, Germany and the Netherlands praised the deal, France called it unbalanced, and Hungary viewed it unfavorably.
• The deal is not final until it is ratified by all EU national parliaments and the EU Parliament.
China Talks: US and China expected to extend their trade truce by 90 days. US-China meeting expected in Stockholm on Monday and Tuesday. Trump to freeze export controls to secure a deal. A group of US executives will visit China for trade discussions, organized by the US-China Business Council.
South Korea Trade Talks: Korea proposes a shipbuilding partnership with the US and is preparing a trade package.
UK–US Relations: PM Starmer and Trump to meet in Scotland to discuss the UK–US trade deal implementation, Middle East ceasefire, and pressure on Russia.
Thus far, the US has announced trade deals with the UK, Vietnam, Philippines, Indonesia, Japan and The EU. Trade delegations are working to finalize deals with China, Mexico, Canada
Key Economic Data Releases:
Monday: Treasury refunding financing estimates.
Supply: 2-Year and 5-Year Note Auction, 3 & 6-Month Bill Auction
Tuesday: US Advance Goods Trade Balance, Wholesale Inventories Advance, CB Consumer Confidence, JOLTS Job Opening (Jun), Atlanta Fed GDPNow, Australian CPI Q2
Supply: 7-Year Note Auction
Wednesday: German GDP Q2, EUR GDP Q2, US ADP Non-farm Employment, US GDP Q2, Crude Oil Inventories, Chinese Manufacturing PMI
Canada: BoC Interest Rate Decision, Rate Statement, Monterey Policy Report, BoC Press Conference
US: Fed Interest Rate Decision,FOMC Statement, Fed Press Conference.
Japan: BoJ Interest Rate Decision, Monetary Policy Statement
Thursday: EU Unemployment (Jun), US PCE & Core PCE Price Index (Jun)
Japan: BoJ Press Conference
Friday: EU CPI, US NFP, Unemployment Rate, Average Hourly Earnings, ISM Manufacturing PMI, Michigan 1-Year & 5-Year Inflation Expectations.
It is also a busy earnings week. See here for a complete earnings schedule .
Markets are interpreting trade deals as positive news thus far. The dollar is strengthening.
As we previously mentioned, we anticipate no rate cuts this year as economic data proves to be resilient and inflation largely under control. WSJ also posted an article stating that most tariffs costs are being absorbed by companies due to weaker pricing power. We previously wrote about this on our blog: “ In our analysis, the inflation impact of tariffs may not show up until Q4 2025 or early 2026, as tariff threats are mostly used as a lever to negotiate deals. While effective tariff rates have increased, as Trump reshapes how tariffs are viewed, cost pass-through to consumers will be limited in Q3 2025, as companies’ front-loaded inventory helps mitigate the risks of increased tariff exposure.
So, what we have is an interesting development shaping up where, while inflation may rise and remain sticky, it is yet to be seen whether slowing consumer spending will weaken enough to the point where companies must start offering discounts, which would nullify the tariff risk to the end consumer and result in companies absorbing all tariffs. This scenario will see reduced earnings margins leading into the last quarter and early 2026. However, it will materially reduce risks of higher inflation.”
In our view, the US dollar has a higher probability to rally in the short-term i.e., Q3 as markets re-align FX rate differentials. Bond yields stabilize, Equities continue pushing higher, while Gold retraces as previously mentioned. This in our view, is what investors and participants refer to as the Goldilocks scenario. If this plays out as expected we anticipate continued strength with AI, tech, energy and defense sectors outperforming into mid- 2026.
Institutional View: Morgan Stanley
Morgan Stanley also sees no rate cuts in 2025, despite market pricing for two 25 bps cuts. They forecast more aggressive cuts in 2026 due to:
• Tariff-related inflation emerging before labor market deterioration
• Slowing US growth, as fiscal support fades
• Impact of tighter immigration policy and global trade realignment
That said, MS continues to cite longer-term risks to the dollar, including:
• Twin deficits (fiscal + current account)
• Ongoing debate around USD’s safe haven status
• USD hedging activity picking up by international investors
• Strained credibility of the Fed due to tension between Fed Chair and the US Administration
How Fed policy evolves in Q4 2025 and Q1 2026 will depend heavily on the incoming Fed Chair nominee, who is expected to replace Jerome Powell in May 2026. This nomination could significantly influence future policy direction around growth and inflation targets.

Important week for EURUSDOn Friday, EURUSD reached a support level and bounced off it.
This week, all eyes are on the Fed's interest rate decision on Wednesday and the U.S. jobs data on Friday.
The trend remains bullish for now, and the upcoming news will likely determine the next move.
Today and tomorrow, the market may stay in a range as traders wait for the key events.
Don't rush into new trades and avoid using large position sizes!

Markets face a PACKED schedule this weekThe tariff truce between the U.S. and several major trading partners is set to expire on August 1 . A deal with Japan has already been reached, but talks with the EU, Canada, and Mexico remain active.
In monetary policy, the Federal Reserve is widely expected to hold rates steady at 4.5% during its midweek meeting .
Across the border, the Bank of Canada is also expected to leave its interest rate unchanged at 2.75% . After cutting rates twice earlier this year, the BoC is seen as entering a wait-and-see phase.
In Asia, the Bank of Japan will announce its decision on Wednesday . While the BoJ isn’t expected to hike this month, recent U.S.–Japan trade progress has opened the door for policy tightening later this year.
Finally, the week concludes with the U.S. Non-Farm Payrolls report on Friday. Economists expect job gains of around 110,000 in July, down from 147,000 in June.
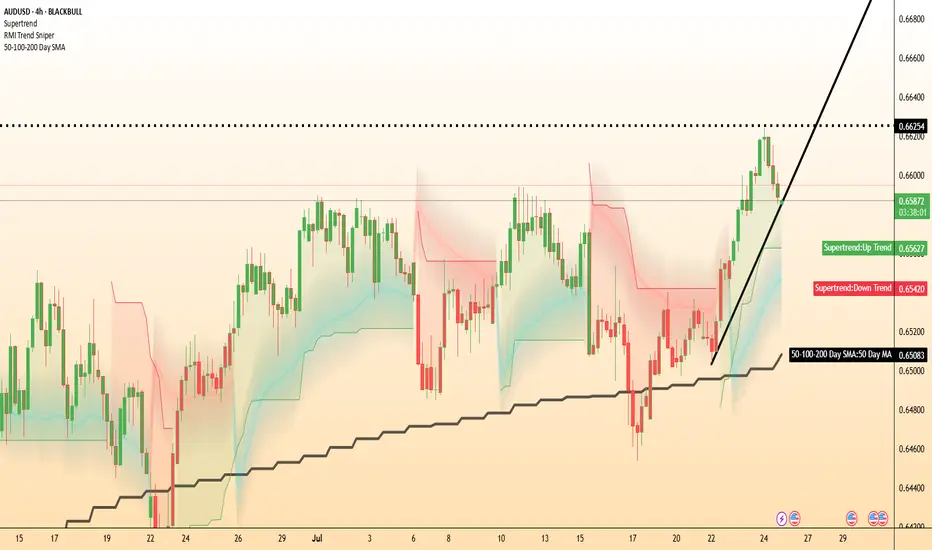
AUD/USD tests uptrend as Trump targets Powell at Fed siteThe US dollar is trading mixed after President Trump made a rare appearance at the Federal Reserve’s renovation site, in an attempt to distract from you know what.
While the visit had no formal policy announcements, Trump did try to further undermine Chair Jerome Powell by erroneously claiming the renovation cost had blown out to 3.1 billion by adding the cost of a building finished 5 years ago.
Meanwhile, AUD/USD could be of the most interest. Traders might like to watch to see if it can hold its uptrend after its downside breakout from yesterday. AUD/USD remains potentially supported above its 50-DMA, with momentum pointing to potential further upside beyond 0.6625.
10Y: Positioning for a Falling Yield EnvironmentCBOT: Micro 10 Year Yield Futures ( CBOT_MINI:10Y1! ), #microfutures
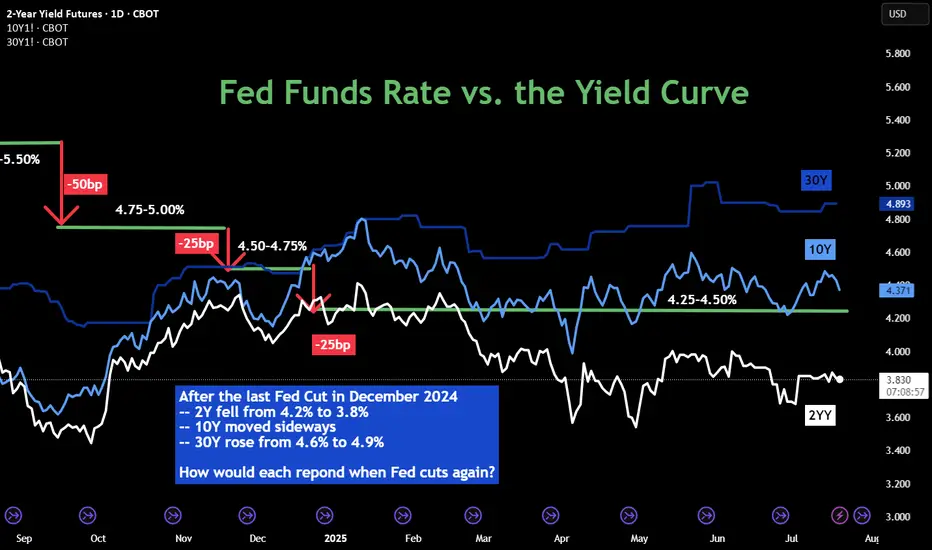
The Federal Reserve last cut interest rates in December 2024. Since then, it has kept the rates unchanged in its January, March, April and June FOMC meetings. While the official Fed Funds rate stays at 4.25-4.50% in the past seven months, we have seen diverging trends in the interest rate market:
• 2-Year Yield has trended down from 4.25% to around 3.85%;
• 10-Year Yield mostly moved sideways, currently at 4.42%;
• 30-Year Yield rose from 4.60% to top 5.00% in May, then pulled back to 4.89%.
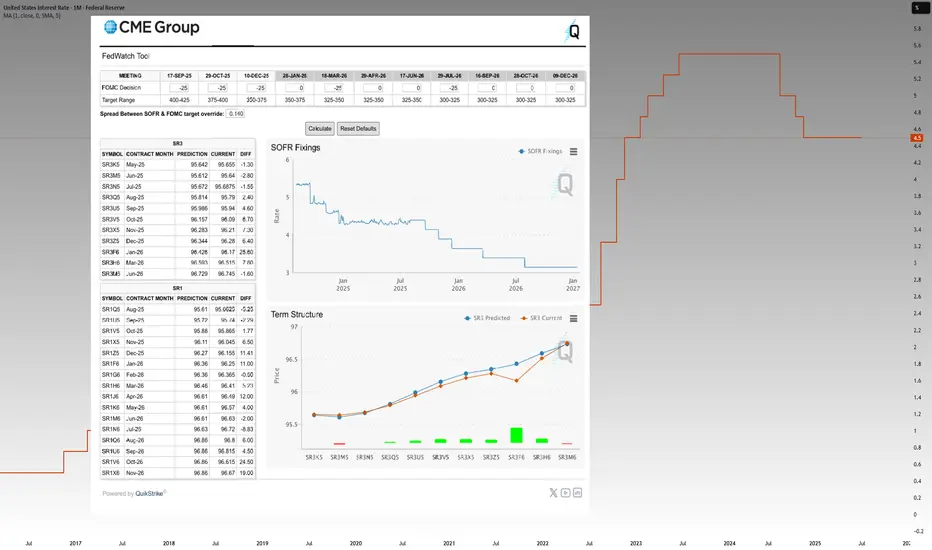
The futures market expects the Fed to cut rates once or twice in the remaining four FOMC meetings in 2025, according to CME Fed Watch Tool.
• As of July 20th, there is a 95.3% chance that the Fed will keep rates unchanged in its July 30th meeting;
• The odd of lowering 25 bps is approximately 60% for September 17th;
• By the last 2025 meeting on December 10th, futures market sees just 6.4% chance that the Fed keeps the rates at current level 4.25-4.50%, while the odds of 1 cut to 4.00-4.25% are 29.2%, and the odds of 2 cuts to 3.75-4.00% are 64.3%.
The Fed’s Challenges
The Fed tries to fulfil its dual mandate established by the Congress: (1) to support maximum employment and (2) to maintain price stability. Its official targets are to keep the unemployment rate below 4%, as measured by the BLS nonfarm payroll data, and to keep the inflation rate at 2%, as measured by the PCE price index. When we face an outlook of rising prices and slowing employment, the Fed will have a hard time meeting both policy goals.
Firstly, as the Trump Administration raises tariffs for all trading partners on all imports, it’s a matter of time before the inflation rate picks up again. Even if many countries may reach trade agreements with the U.S., they will still get a bigger tax bill.
• According to the Bureau of Economic Analysis (BEA), the total US imports of goods and services was $4.1 trillion for 2024.
• Imports account for 14% of the US GDP in 2024, which is $29.2 trillion (BEA data).
• Simple math suggests that a universal 10% tariff hike could contribute to 1.4% in price increases, assuming all tariffs are passed through to the retail prices.
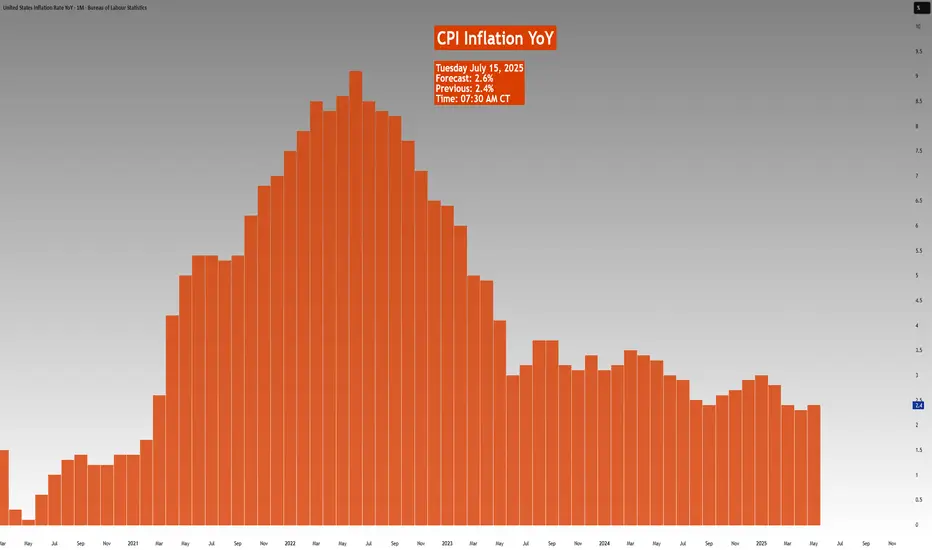
The most recent inflation data is the June CPI at 2.7% (BLS data). The tariff hike could easily push inflation to twice the Fed policy target. Therefore, cutting rates will be a very difficult decision if inflation rebounds.
Secondly, US employment growth has slowed down significantly in 2025. On July 3rd, the BLS reported total nonfarm payroll increased by 147,000 in June, and the unemployment rate changed little at 4.1 percent. Current employment growth is less than half the level in December 2024, which saw the data above 300,000.
There are weaknesses in the payroll data. All private sectors combined accounted for about half of the employment gain, or 74,000. Government jobs, while at a much smaller base, accounted for the other half.
Tariffs raise the cost of input, while business borrowing costs remain high at current rate level. To support growth and maximum employment, cutting rates make sense.
Finally, the Fed is under tremendous pressure from the Administration. President Trump openly and repeatedly calls for a 300bp cut.
In an ideal world, the Fed wants to make monetary policy decisions free of political interference. It may not be the case. Let’s look at the Fed rate decisions during the first Trump presidential term. The current Fed Chair was appointed to the role by President Trump in February 2018.
• The Fed raised interest rates four times in 2018, for a total of 100 basis points, with the Fed Funds rate increased from 1.25-1.50% to 2.25-2.50%.
• Under pressure from the White House, the Fed cut rates three times in 2019 for a total of 75 basis points, with the Fed Funds rate ending at 1.50-1.75%.
• In 2020, in response to the Pandemic, the Fed cut rates by 150 points, all the way to a zero-rate environment (0%-0.25%).
In my opinion, the Fed will cut rates this year, similar to 2019. Once the Fed Chair retires in May 2026, his replacement, who will be nominated by President Trump, will no doubt follow his guidelines and bring the Fed Funds rate all the way down to 1%-2% level.
While there is uncertainty in the timing and pace, we are likely to embark on the path to low interest-rate environment.
Shorting Micro 10-Year Yield Futures
A trader sharing a bearish view on interest rates could explore shorting the CBOT Micro 10-Year Yield Futures ($10Y).
Last Friday, the August 10Y contract (10YQ5) was settled at 4.425. Each contract has a notional value of 1,000 index points, or a market value of $4,425. To buy or sell 1 contract, a trader is required to post an initial margin of $300. The margining requirement reflects a built-in leverage of 14.7-to-1.
Let’s use a hypothetical trade to illustrate how to use a short futures position to take advantage of a potential Fed rate cut.
Hypothetical Trade:
• Short 1 10YQ5 at 4.425, and set a stop loss at 4.60
• Trader pays $300 for initial margin
Scenario 1: Fed keeps rates unchanged on July 30th, 10Y moves sideways
• If Futures price changes little after the July FOMC, the trader could close the position
• He could short the September contract 10YU5, with an eye open for the September 17th FOMC rate decision
• This is a futures rollover strategy.
Scenario 2: Fed cuts 25 bps on July 30th, 10YU5 falls 250 points to 4.175
• Short position gains: $250 (= (4.425-4.175) x 1000)
• The hypothetical return will be 83% (= 250 / 300)
Happy Trading.
Disclaimers
*Trade ideas cited above are for illustration only, as an integral part of a case study to demonstrate the fundamental concepts in risk management under the market scenarios being discussed. They shall not be construed as investment recommendations or advice. Nor are they used to promote any specific products, or services.
CME Real-time Market Data help identify trading set-ups and express my market views. If you have futures in your trading portfolio, you can check out on CME Group data plans available that suit your trading needs www.tradingview.com
Inflation vs. Growth : Is the Fed Behind or Ahead of the Curve?CME_MINI:NQ1! CME_MINI:ES1! CME_MINI:MNQ1! CME_MINI:MES1! CBOT:ZN1!
Fed Policy recap:
There is an interesting and unusual theme to keep an eye on this week. The Fed is in a ‘blackout period’ until the FOMC meeting- this is a customary quiet period ahead of an FOMC policy meeting. Fed Chair Powell is scheduled to give a public talk on Tuesday. Although his address will be focused on the capital framework of the large banks, this appearance will be closely watched for any subtle signals on the FOMC policy stance.
Especially given that last week, Federal Reserve Governor Chris Waller made a speech, “The Case for Cutting Now” with a purpose as he stated to explain why the FOMC should reduce rate by 25 bps at the July 30th, 2025 meeting.
His stated reasons were:
1. Tariffs create one-off price level increases with transitory inflation effects, not sustained inflation momentum.
2. He argued that much of economic data points towards interest rates should be lowered to FOMC’s participants' median neutral rate, i.e, 3%.
3. His third stated reason notes that while the state of the labor market looks resilient on the surface, accounting for expected data revisions, private-sector payroll growth has peaked, with more data suggesting increased downside risks.
His speech further explains:
• Growth has decelerated sharply: Real GDP rose only ~1% annualized in 1H25, a significant slowdown from 2.8% in 2H24, and well below long-run potential.
• Consumer spending is weakening, with real PCE growth falling to ~1%, and June retail sales showing soft underlying momentum.
• Broader labor market indicators, including the Beige Book and JOLTS data, show declining labor demand and hiring caution, suggesting increasing downside risks to employment.
• Inflation is slightly above target (PCE ~2.5%) but driven primarily by temporary, one-off tariff effects. Core inflation ex-tariffs is likely near 2%, and expectations remain anchored.
• Current fed funds range (4.25%–4.50%) is well above neutral (3%), implying excessive restraint.
• With inflation risks subdued and macro conditions deteriorating, a preemptive rate cut now provides optionality and avoids falling behind the curve if the slowdown deepens. Further cuts may be warranted if trends persist.
• The tax bill contains pro-growth provisions, but its economic impact is expected to be minimal in 2025.
Source: Federal Reserve Speech, The Case for Cutting Now Governor Waller
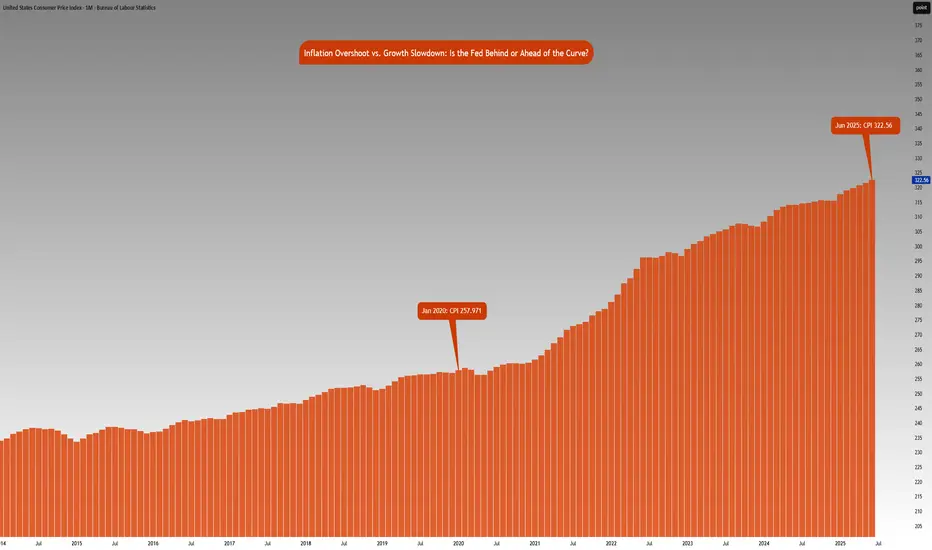
Inflation Analysis:
Let’s compare this with what we have previously mentioned regarding inflation. CPI index stood at 257.971 points in January 2020. Projecting this at a 2% Fed target, June 2025 inflation should be around 287.655 points. However, June 2025 inflation is currently at 322.56 index points, 12.2% higher above 2% the inflation trend. Effectively, this means annualized inflation since January 2020 is roughly 4.15%.
The Fed is in a real dilemma whether cutting rates given the inflation trend in the last 5 years and risks to inflation outlook justify cutting rates.
Key Questions to ask
Markets are forward looking. Investors and participants want to know:
• How will the rates impact the cost of debt service? Currently the third largest government expenditure, over $1.03 trillion.
• Will the tariff rate offset the tax revenue losses by extending tax cuts?
• Is the fiscal path sustainable?
• What happens to the long end of the yield-curve?
• Will the Fed monetize the debt issuance imbalance?
• Is this simply Governor Waller positioning himself for the next appointment of Fed Chair when Fed Chair Powell’s term expires in May 2026?
It seems there is a huge conflict between longer term implications vs quick short term fixes that align with US administration objectives.
The Week ahead:
It is a relatively light economic calendar in the US. Flash PMI readings and housing data on the docket. The primary focus as it has been for most weeks since President Trump took office, will be on the developments in trade policy and any further comments on Fed and Chair Powell. The threat of renewed tariffs starting August 1st, is also key to monitor and whether these protectionist measures will force US’s trading partners to make further concessions to negotiate trade deals.
The earnings season is off to a good start with major US banks reporting higher EPS and revenue than expectations. This week investors will be looking at Q2 earnings reports from Alphabet, Meta, Microsoft from the Mag 7 and Tesla.
What Happens the Day Jerome Powell Is Fired or Quits?A sudden exit by Fed Chair Jerome Powell would create both a political and monetary shock.
While the Chair is technically protected from arbitrary removal. Recent reports confirm that President Trump and his allies are scrutinising the Fed’s $2.5 billion renovation project—potentially laying the groundwork for a “for cause” dismissal.
A surprise departure would undermine confidence in the Fed’s independence. The U.S. dollar could fall sharply across major pairs.
USD/JPY could fall toward ¥145, with safe-haven demand favouring the yen. However, the reaction may be less severe than in pairs like Swiss franc which we have noted in the past is the potentially preferred safe haven. A panic selloff could extend to 142.20—a prior consolidation floor.
GBP/USD could surge as traders anticipate a more dovish Fed stance under the new Trump-stooge Fed Chair. From a technical perspective, GBP/USD is maybe already oversold and potentially poised for a potential rebound anyway—Powell’s resignation or firing could potentially exacerbate this. The first level to watch being a return to 1.3700, assuming the likely expectation of Fed rate cuts rise.

Weekly Macro Brief: Chinese Economic Data, US Inflation, Tariff CME_MINI:ES1! CME_MINI:NQ1! COMEX:GC1! CME:BTC1! CME_MINI:RTY1! COMEX:SI1! CME_MINI:MNQ1! NYMEX:CL1! CME_MINI:M6E1! CBOT:ZN1! CME_MINI:MES1!
Highlights this week include Chinese economic data points, UK CPI, US CPI, PPI, and Retail Sales. Inflation data is key, as it comes ahead of the Fed's meeting on July 30th, 2025.
Market participants, including institutional investors and futures brokers like EdgeClear, will be scrutinizing these data points closely to monitor global growth and underlying inflation pressures.
Fed speakers are scheduled throughout the week. With increasing calls for Fed Chair Powell voluntary resignation and impeachment, the US administration desiring lower rates, the Fed’s independence and credibility to carry out its dual mandate is at risk. It will be interesting to monitor who folds first. Last week’s FOMC minutes revealed a divided Fed on the interest rate outlook, affirming its June dot plot.
On the fiscal policy front, we are already witnessing a shift in global trade policies, with many nations making concessions to negotiate trade deals with the world’s largest economy. In our analysis, the inflation impact of tariffs may not show up until Q4 2025 or early 2026, as tariff threats are mostly used as a lever to negotiate deals. While effective tariff rates have increased, as Trump reshapes how tariffs are viewed, cost pass-through to consumers will be limited in Q3 2025, as companies’ front-loaded inventory helps mitigate the risks of increased tariff exposure.
So, what we have is an interesting development shaping up where, while inflation may rise and remain sticky, it is yet to be seen whether slowing consumer spending will weaken enough to the point where companies have to start offering discounts, which would nullify the tariff risk to the end consumer and result in companies absorbing all tariffs. This scenario will see reduced earnings margins leading into the last quarter and early 2026. However, it will materially reduce risks of higher inflation.
In summary, the complex interplay between tariffs, inflation, and consumer behavior presents critical considerations for traders. EdgeClear, as a dedicated futures broker, remains focused on equipping clients with the insights needed to help navigate this evolving macroeconomic environment.
Overnight Data Recap:
• Chinese Trade Balance (CNY)(Jun) 826.0B (Prev. 743.6B)
• Chinese Trade Balance USD* (Jun) 114.77B vs. Exp. 109.0B (Prev. 103.22B)
• Chinese Imports YY* (Jun) 1.1% vs. Exp. 1.3% (Prev. -3.4%)
• Chinese Exports YY* (Jun) 5.8% vs. Exp. 5.0% (Prev. 4.8%)
Key Economic Releases:
• MON: EU 90-Day Retaliatory Pause Ends
• TUE: OPEC MOMR, Chinese House Prices (Jun), Retail Sales (Jun), GDP (Q2), EZ Industrial Production (May), German ZEW (Jun), US CPI (Jun), NY Fed Manufacturing (Jul), Canadian CPI (Jun)
• WED: UK CPI (Jun), EZ Trade (May), US PPI (Jun), Industrial Production (Jun)
• THU: Japanese Trade Balance (Jun), EZ Final HICP (Jun), US Export/Import Prices (Jun), Weekly Claims, Philadelphia Fed (Jul), Retail Sales (Jun)
• FRI: Japanese CPI (Jun), German Producer Prices (Jun), US Building Permits/Housing Starts (Jun), Uni. of Michigan Prelim. (Jul)
China GDP / Retail Sales/ Housing (TUE):
• Q2 GDP is expected to slow to 5.1% Y/Y (vs 5.4% in Q1) and 0.9% Q/Q.
• Retail sales have been resilient, but industrial production and investment show signs of weakness; deflation and labor market concerns persist.
• Property prices continue to decline, fueling stimulus speculation; policymakers remain cautious, with only modest easing expected (LPR and RRR cuts in Q4).
US CPI (TUE)
• June CPI expected at +0.3% M/M headline and core, suggesting a modest rebound from May’s subdued figures.
• Inflation impact from tariffs seen as temporary; Fed officials maintain a cautious stance with possible rate cuts only if price pressures stay benign.
• Markets are pricing near-zero odds for a July rate cut, but still expect two 25bps cuts by year-end in line with Fed guidance.
US Retail Sales (THU):
• Headline June retail sales expected flat M/M; ex-autos expected to rise +0.3%, showing signs of consumer stabilization.
• BofA data shows mild spending rebound, though discretionary service spending continues to weaken, especially among lower-income households.
• Spending strength remains concentrated in higher-income cohorts; weakness in wage growth limits broader consumption momentum.
US Trade Tensions – Tariffs & Negotiations:
• Trump announced 30% tariffs on EU and Mexican goods effective August 1st, separate from sector-specific tariffs.
• Trump stated the EU is engaging in talks and South Korea is also pursuing a trade deal.
Mexico Response:
• President Sheinbaum expects a deal before August 1st but reaffirmed Mexican sovereignty is non-negotiable.
• Mexico’s Economy Ministry is negotiating to protect domestic firms and workers, aiming for an alternative resolution.
EU Response:
• European Commission President von der Leyen warned that 30% tariffs would disrupt key transatlantic supply chains.
• The EU will extend suspension of countermeasures until early August but is prepared to respond proportionally if needed.
• The EU prefers a negotiated solution and dropped plans for a digital tax, seen as a concession to US tech interests.
• Separately, the EU is drafting a broad corporate tax on firms with turnover above EUR 50 million to support its budget.
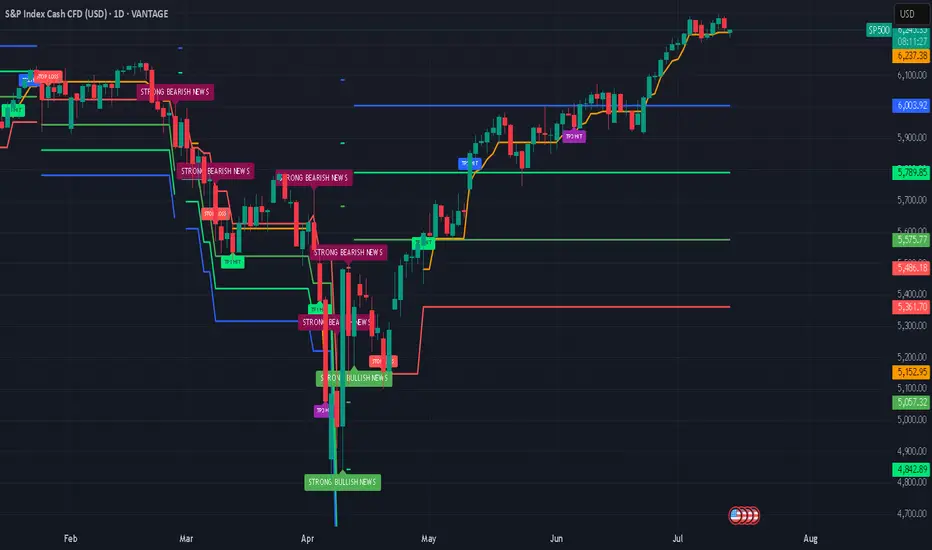
S&P 500: Defying Tariff Headwinds, Breaking RecordsThe S&P 500 has staged a remarkable rally in 2025, shattering all-time highs and capturing global attention. This surge has unfolded despite the negative economic overhang of renewed tariff threats and ongoing trade tensions, raising critical questions for investors: How did the market overcome such headwinds, and what lies ahead for both the short and long term?
The Rally Against the Odds
Tariff Turbulence: Earlier this year, President Trump announced sweeping new tariffs, sparking fears of supply chain disruptions and higher costs for American companies. Historically, such moves have triggered volatility and corrections.
Market Resilience: Despite these concerns, the S&P 500 not only recovered losses from the spring but surged to new record highs, with the index climbing over 23% since April’s lows. Major tech companies, especially those leading in AI and innovation, have been at the forefront of this advance.
Investor Sentiment: The rally has been fueled by optimism around potential Federal Reserve rate cuts, robust corporate earnings, and expectations of long-term economic growth—even as the immediate impact of tariffs remains uncertain.
Short-Term Correction: A Healthy Pause?
While the long-term outlook remains bullish, several indicators suggest the market may be due for a short-term correction:
Narrow Market Breadth: The current rally has been driven by a handful of mega-cap stocks, leaving the median S&P 500 stock well below its own 52-week high. Historically, such narrow leadership often precedes periods of consolidation or pullbacks.
Valuation Concerns: Stock valuations are at elevated levels, and some analysts warn that earnings growth could slow as companies adapt to higher input costs and shifting trade policies.
Correction Forecasts: Some strategists predict the S&P 500 could correct to around 5,250 by the third quarter of 2025, citing factors like slowing consumer spending and persistent policy uncertainty.
Long-Term Outlook: Higher Highs Ahead
Despite the potential for near-term volatility, the long-term trajectory for the S&P 500 remains positive:
Fed Policy Tailwinds: Anticipated rate cuts and lower bond yields are expected to provide further support for equities, encouraging risk-taking and higher valuations.
Corporate Adaptation: Companies are actively offsetting tariff impacts through cost savings, supply chain adjustments, and strategic pricing.
Growth Sectors: Innovation in technology, productivity gains, and deregulation are setting the stage for sustained profit growth, especially in sectors like AI, robotics, and defense.
Key Takeaways for Investors
Stay Disciplined: While a short-term correction is possible, history shows that markets often rebound strongly after periods of volatility.
Diversify Exposure: With market gains concentrated in a few names, diversification and active stock selection are more important than ever.
Focus on Fundamentals: Long-term investors should look beyond headlines and focus on companies with resilient earnings and adaptive business models.
The S&P 500’s ability to break records in the face of tariff headwinds is a testament to the underlying strength and adaptability of the U.S. economy. While short-term bumps are likely, the path ahead still points toward new highs for those with patience and perspective.
This article is for informational purposes only and does not constitute investment advice. Always consult with a financial advisor before making investment decisions.
#spx500 #stockmarket #analysis #economy #us #nasdaq #fed #bonds #rates #trading
Orangeman vs The Federal Reverse: Season 1 (2018–2020)It all started in 2018... 🎬
🧱📈💼 March 21, 2018: Jerome Powell steps in as the new Fed Chair. Almost immediately, the Fed hikes rates from 1.50% to 1.75%, citing a strong U.S. economy.
💬📊🇺🇸 June 13, 2018: Another hike to 2.00%. Powell says the U.S. economy is “in great shape.” But markets? Not so thrilled.
🗣️📉🇺🇸 July 19, 2018: Enter The Orangeman—President Trump publicly attacks the Fed's policy, breaking tradition. He’s “not thrilled” with the hikes.
📉🏦 September 26, 2018: Yet another hike to 2.25%. The Fed stays firm. Trump? Getting louder.
❗😠💬 "I'm not happy with the Fed." – Trump
⚠️📉📉 December 19, 2018: Fourth hike of the year to 2.50%. Markets tank. Rumors swirl: Trump wants Powell gone.
🔥💣👔 Behind the scenes: Trump reportedly explores ways to dismiss Powell. The pressure is on.
📛🇺🇸📉 June 10, 2019: The battle heats up. Trump calls the hikes a “big mistake” and demands rate cuts.
✂️📉📉 July 31, 2019: Powell blinks. The Fed cuts rates by 0.25%—first cut since 2008. Trump tweets:
👎🐦💸 “Powell let us down.”
⬇️📉🔁 September 18, 2019: Second cut.
⚖️🔁🧩 October 30, 2019: Third consecutive cut. The Fed pivots completely. The Orangeman’s influence is undeniable.
🦠🧪📉 March 2020: COVID strikes. The Fed responds with emergency rate cuts.
🌀🧻💸 March 15 & 23, 2020: Rates slashed to near zero. QE infinity unleashed. Powell goes full printer mode. Bitcoin begins to stir...
Season 1 closes with markets melting down, a pandemic, and the Fed surrendering to zero rates.
But The Orangeman isn’t done...
And The Federal Reverse still lurks in the shadows.
Next up: tariffs, China, currency wars, and another campaign trail. 🐉💵⚔️
Season 2 is coming.
Stay tuned...
One tweets.
The other tightens.
Who controls our future?
One Love,
The FXPROFESSOR 💙

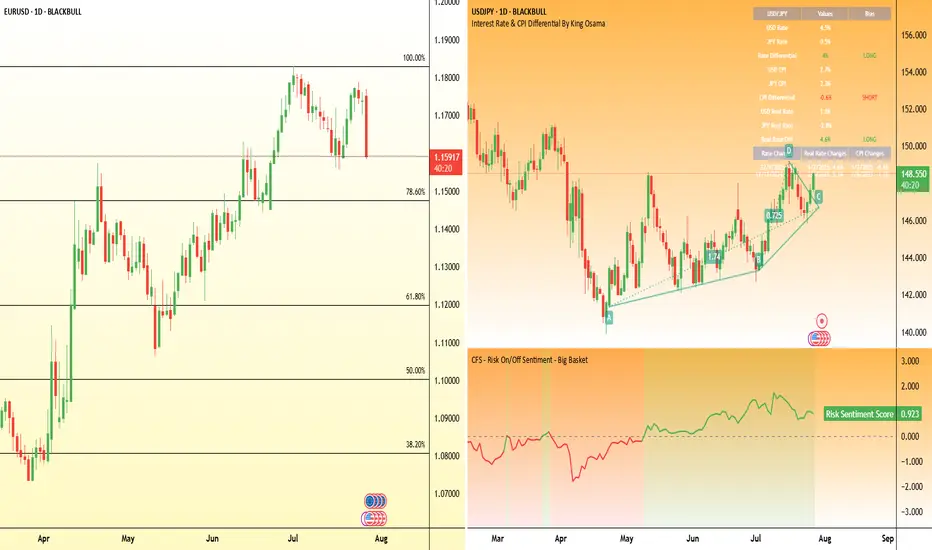
EUR/USD: A Perfect Storm for BullsThis is a high-conviction long setup based on a powerful combination of macroeconomic divergence and a confirmed multi-year technical breakout.
The Non-Farm Payrolls report has now been released, and the resulting price dip has created what I believe is an ideal entry opportunity to align with the dominant bullish trend.
The Fundamental Why 📰
NFP Aftermath: Yesterday's NFP report was a mixed bag that ultimately reinforces the case for Fed rate cuts. The headline number beat expectations, causing an initial USD rally and a dip in EUR/USD. However, the underlying details like wage growth were soft. Crucially, the market continues to price in a 96% probability of a Fed rate cut by September, a figure that was unchanged by the data. The core driver of USD weakness—a dovish Fed—remains firmly intact.
Resilient EUR 🇪🇺: In contrast, the ECB has signaled it is at or near the end of its easing cycle. Economic data from core Eurozone countries is stabilizing, providing the Euro with relative strength.
Risk-On Sentiment 💹: The broader market remains in a "risk-on" mood, which is typically negative for the safe-haven USD. Gold is soaring and equities are near all-time highs, confirming the anti-dollar flow.
The Technical Picture 📊
The Secular Breakout 🚀: The most significant event is the breakout of a decade-long downtrend resistance line. This is a major structural shift. The pair has also achieved a monthly and quarterly close above the critical 1.1500 handle, turning a historic resistance level into a new support floor.
The Impulsive Uptrend 🌊: On the 4-hour chart, the price is in a clear ascending channel. The post-NFP dip represents a healthy correction within this uptrend, bringing price back toward key support.
Key Levels 🔑:
Support Zone: The dip has brought price directly into the key support confluence between 1.1700 and 1.1760, making this an ideal area to enter long.
Resistance Zone: Major resistance still sits at 1.1900, making it a prudent take-profit target.
Strategy & Risk Management 🧠
The stronger-than-expected NFP headline has provided the exact pullback this strategy was designed for. The dip presents a prime opportunity to buy into the dominant uptrend at a more favorable price. Instead of chasing the market, we are now positioned to enter on a technically sound correction.
Good luck, and trade safe!
Trade Parameters ✅
Pair: EUR/USD
Direction: Long / Buy 🟢
Entry Type: Limit Order
Entry Price: 1.1745
Stop-Loss: 1.1685 (60 pips) 🔴
Take-Profit: 1.1895 (150 pips) 🎯
Risk/Reward Ratio: 2.5 : 1

Get Ready! Hot Air Rises. Fartcoin About To Break Wind.Trading Fam,
Our national debt is a meme. The buying power of our dollar is a meme. Our monetary system is a meme. The Fed is a ponzi scheme and a meme. Everything related to geopolitical economics has become a meme. We can't take any of this stuff seriously anymore. So, why not make a profit on the best memes of the day? Enter pungeant FARTCOIN. AI-created and managed, FARTCOIN is cutting loose with no reservations. And it looks like it is about to break wind again. They say hot air rises. Let's see how far this stink can go.
Let her rip!
Stew

Fed speak - Not broken, not cutting “Don’t fix what isn’t broken” seems to be the Fed’s current stance. Two Fed officials made that clear over the last 24 hours.
Vice Chair for Supervision Michael Barr warned that tariffs could fuel inflation by lifting short-term expectations, triggering second-round effects, and making inflation more persistent.
New York Fed President John Williams echoed that view, noting that tariff-driven inflation is “likely to get stronger in the months ahead.” He also called policy “well positioned” and said the Fed needs more data before making any move.
EUR/USD has formed a rising wedge pattern on the daily chart—typically a bearish structure that warns of a potential reversal. Price action has narrowed, building two clear tops. The downside target from the wedge could potentially be 1.1066 initially, and possibly down to 1.0732 if bearish momentum accelerates.

Can Geopolitics Power Tech's Ascent?The Nasdaq index recently experienced a significant surge, driven largely by an unexpected de-escalation of tensions between Israel and Iran. Following a weekend where U.S. forces reportedly attacked Iranian nuclear sites, investors braced for a volatile Monday. However, Iran's measured response - a missile strike on a U.S. base in Qatar, notably without casualties or significant damage - signaled a clear intent to avoid wider conflict. This pivotal moment culminated in President Trump's announcement of a "Complete and Total CEASEFIRE" on Truth Social, which immediately sent U.S. stock futures, including the Nasdaq, soaring. This rapid shift from geopolitical brinkmanship to a declared truce fundamentally altered risk perceptions, alleviating immediate concerns that had weighed on global markets.
This geopolitical calm proved particularly beneficial for the Nasdaq, an index heavily weighted towards technology and growth stocks. These companies, often characterized by global supply chains and reliance on stable international markets, thrive in environments of reduced uncertainty. Unlike sectors tied to commodity prices, tech firms derive their value from innovation, data, and software assets, which are less susceptible to direct geopolitical disruptions when tensions ease. The perceived de-escalation of conflict not only boosted investor confidence in these growth-oriented companies but also potentially reduced pressure on the Federal Reserve regarding future monetary policy, a factor that profoundly impacts the borrowing costs and valuations of high-growth technology firms.
Beyond the immediate geopolitical relief, other crucial factors are shaping the market's trajectory. Federal Reserve Chair Jerome Powell's upcoming testimony before the House Financial Services Committee, where he will discuss monetary policy, remains a key focus. Investors are closely scrutinizing his remarks for any indications regarding future interest rate adjustments, particularly given current expectations for potential rate cuts in 2025. Additionally, significant corporate earnings reports from major companies like Carnival Corporation (CCL), FedEx (FDX), and BlackBerry (BB) are due. These reports will offer vital insights into various sectors' health, providing a more granular understanding of consumer spending, global logistics, and software security, thereby influencing overall market sentiment and the Nasdaq's continued performance.

Bitcoin, Interest rates & Key fundamental points since 2021
The Growing question is just how much does the American Federal Reserve interest rate changes effect Bitcoin.
We can see how in 2022, it appears they did but from late 2022 and early 2023, it doesn't seem to.
Bitcoin began its rise even while rates were being put up.
The Fundimental Key points may have had more impact but again, there are moments were we can see something that should have been Great for BTC, had little effect and Visa Versa.
Has Bitcon Truly Broken away from being effected by the worlds "largest" economy ?
We are currently seeing the ever growing threat of WW3 and Rates being Kept artificially High by the US Fed Reserve. The EU Central banks has already reduced its rate twice while the USA remained with no change )
And Bitcoin remains stable.
And Bitcoins international adoption continues.
STACK SATS

$USINTR -Fed Keeps Rates Uncut (June/2025)ECONOMICS:USINTR
June/2025
source: Federal Reserve
- The Federal Reserve left the federal funds rate unchanged at 4.25%–4.50% for a fourth consecutive meeting in June 2025, in line with expectations, as policymakers take a cautious stance to fully evaluate the economic impact of President Trump’s policies, particularly those related to tariffs, immigration, and taxation. However, officials are still pricing in two rate cuts this year.
