BluetonaFX - EURUSD KEY LEVELSHi Traders!
Please see our new levels for EURUSD below.
Vector Level: 1.08047
Vector Level: 1.09298
Anchor Level: 1.04833
Apex Level: 1.10956
The recent price action on the 1D chart is telling us that EURUSD is looking for a direction to continue in. We have been stuck in a range (highlighted on the chart) for the past two weeks or so, and key decisions and announcements this week from the ECB and the Federal Reserve will most likely take us in a certain direction.
To the upside, if there is any USD weakness or EUR strength, our first vector level is at 1.08047; we have not been above this level for almost a month. If the market breaks and closes above this level, then we have the next vector level at 1.09298 and then our apex level at 1.10956.
If there is EUR weakness or USD strength and we stay below 1.08047, then it is very likely that we will target our anchor level of 1.04833. This anchor level is a very important level, as we have not been below it this year.
This trading week will be very busy with all of the upcoming fundamental announcements, and there are bound to be big market moves, so make sure you trade safely and responsibly.
Please do not forget to support us by liking, following, and commenting on our posts; this helps us greatly.
Thank you for your support.
BluetonaFX
Federalreserve

BluetonaFX - USDJPY CRITICAL WEEK FOR THE US DOLLARHi Traders!
This is a critical week for the US dollar. The US dollar's long term direction heavily weighs on the outcome of the Federal Reserve's interest rate decision and their statement this coming Wednesday.
Here on the USDJPY 3H chart, the price action shows that since the 140.934 high shown on the chart, the sellers have taken over, and we have had numerous attempts to break back above 140, but have failed to do so.
That being said, traders are still trying to push upward. As you can see on the chart, we have higher highs and higher lows on the price swings and have now established an upward price channel.
Depending on the outcome of the Federal Reserve's decision on Wednesday, if there is a positive outlook on the US dollar, we may get a break above the 140 area with a possible continuation to test the 141 level again. If we do not get this, then a break and close below the 139 area is likely, and our long term outlook on the US dollar will change to bearish and we will look for opportunities to the downside.
This trading week will be very busy with all of the upcoming fundamental announcements, and there are bound to be big market moves, so make sure you trade safely and responsibly.
Please remember to like, follow, and comment, as this helps us greatly.
We appreciate your support.
BluetonaFX

XAUUSD - KOG REPORT!KOG Report:
In last week’s KOG Report, we said we would be expecting to adapt our plan over the week as we were expecting the range and choppy price action to continue. We suggested sticking with the same plan and levels from the week prior which worked very well to give us the trades within the range. The short-term swing we were expecting for the move to the downside came in the later part of the week after we managed to take the long trade back up into range high giving us a short opportunity we wanted. So, we wanted to short down, then long up before shorting down, instead, we got the long up, short down and long up. A decent week on the markets again but a very frustrating range to have to deal with.
So, what can we expect in the week ahead?
For this week we can expect some more choppy and whipsawing price action during the first half due to FOMC being on Wednesday. We’re expecting them to want to clear the voids and grab liquidity from the highs and the lows, so for that reason we’re going to start by suggesting we continue to scalp the range for the first initial sessions while we assess the price action. We’re then going to be looking for the two key levels to hold price, either from above to go short, or, from below to go long.
Key levels are the order region 50-55 with the break below taking us into 30-35 previous order region which are levels we would expect to see a reaction in price. Resistance levels now stand at 80-85 key level and above the institutional level 90-95 which price needs to remain below for this to continue with another decline.
So, in summary, we have a potential range now forming between 40-45 support and the resistance levels of 80-85 with extension into 90-95 for the spike. Scalps in-between with KOG’s bias of the day and the levels with the view to take the longer position from the levels illustrated on the chart.
Its going to be another difficult and frustrating week to navigate so please exercise patience in your trading, wait for the price to come to your levels, don’t force the trades just to be in the market. Always remember, cash is also a position in the market. We’re going to take it easy until FOMC, smaller lots and smaller captures before we hunt for the trade of the week.
Please do support us by hitting the like button, leaving a comment, and giving us a follow. We’ve been doing this for a long time now providing traders with in-depth free analysis on Gold, so your likes and comments are very much appreciated.
As always, trade safe.
KOG

EURUSD 05/06/2023 TRADING LEVELS UPDATEHi Traders,
PLEASE SEE LINK TO ORIGINAL IDEA BELOW.
Rounding off the week with an update to our forecasted EURUSD levels on the 1D chart. After the bounce from the 78.6% Fibonacci support level, there was a bullish push upwards (highlighted on the chart) and we have now pulled back near our forecasted Vector Resistance 1 level at 1.08047.
The trading range on EURUSD was quite small this week as we have traders waiting for both the ECB & Federal Reserve interest rate decision announcement next week.
We will continue to analyse the markets and will have new levels for you for the upcoming trading week.
Please do not forget to like, comment and follow.
Thank you for your support.
BluetonaFX

DXY and the Dollar TrapIn global finance, everything is relative. For now, there is no good answer to the perennial question: If not for the US dollar, then what?
That is why, despite all its flaws, the dollar remains the ultimate haven currency. And the US Dollar Index (“DXY”) measures the performance of the US Dollar against a basket of six major currencies of USA’s major trading partners.
The DXY measures USD performance against currency majors. Euro, Japanese Yen, and the British Pound represent more than 80% of aggregate weight.
Intriguingly, the absence of emerging majors such as the Chinese Yuan (CNY) and the Australian Dollar (AUD), stands out. The DXY will likely be modified in the future to reflect shifting global dynamics.
History of the DXY
The DXY was first created in 1973 after the establishment of the Bretton Woods agreement which abandoned the gold standard. The index has since been modified just once when the Euro was established as the official currency of the EU.
The DXY commenced with a value of 100 in 1973. The Index above 100 signals that USD is stronger than the basket compared to 1973 values. Meanwhile an index below 100 points to a weak dollar.
The current DXY value of 104 indicates that the USD is 4% above the value of the basket relative to its value in 1973.
During periods of major global financial upheavals, the DXY tends to drift away from 100. In the 1980s as the Fed hiked rates aggressively, the dollar’s value soared. Eventually, the dollar was intentionally weakened in an historical agreement known as the Plaza Accord.
Why would the US weaken its own currency?
In short, a strong currency is not always a good thing. A strong dollar made US goods less viable in global markets and led to a sharp increase in the US trade deficit. As such, weakening the dollar was in the best interests of not just US’s trading partners but also the US.
Another period of upheaval for the DXY was the 2008 global financial crisis. The USD was in crisis when Lehman Brothers collapsed amid the US housing crisis. The confidence in the dollar was shaken.
Comparatively, other countries were less severely affected. This pushed the DXY to its lowest level of 71.
Excluding these exceptional periods of time, the DXY trades around its base value. Movements in DXY are at times drive by policy changes in the US or its partner countries such as Japan, EU, UK, Canada, Switzerland, and Sweden. The real elephant in the room is the Fed policy. Fed decisions have an outsized effect on the DXY.
The DXY is not very volatile. Its 30-day annualized rolling volatility ranges between 5 and 10. However, major economic events can lead to a rise in volatility. Volatility spikes during periods of global crises or major events in the US (Fed Hikes) or EU (EU Debt Crisis) with both currencies having major weightage in the index.
DXY CORRELATION WITH OTHER ASSET CLASSES
Fed Funds Rate
Although not tightly correlated, Fed Funds rate has a major impact on the DXY. Higher rates make the dollar more attractive which leads to it strengthening. However, as other major central banks usually move in tandem with the Fed, rates in the partner countries also rise dampening the buoyancy in DXY.
Fed policy action has a major impact on the DXY at the beginning of shifts in policy. However, this effect soon fades as markets price in terminal rates according to expectations.
Fed & ECB Policy Divergence
The divergence of policy between ECB and Fed has a major impact on the DXY. As policies start to diverge (correlation between rates starts to decline), DXY experiences large directional moves.
2Y Treasury Yields
As treasury yields are derived from Fed Funds rate, the correlation between DXY and 2Y constant maturity treasury notes is similar. In general, both are positively correlated.
The correlation breaks during periods where rates grind lower, but the USD continues to rise. Case in point is the experience of 2020. When the US Fed drove rates to zero, the US dollar soared as the only credible haven. This is the classic dollar trap.
Furthermore, DXY and treasury yield correlation can break due to effects of economic policy action. For instance, in 2018, DXY remained muted despite rising treasury yields as markets were confident of the terminal rate and the Fed not hiking rates very aggressively.
FOMC MEETINGS AND THE DOLLAR INDEX
FOMC meetings decide the fate of interest rates. Typically, decisions move in tandem with expectations.
But when FOMC decisions diverge from consensus, impact on the DXY can be large. For instance, in its May 2023 meeting, markets anticipated the Fed to pause its aggressive hiking campaign against a backdrop of regional banking crisis. However, Fed mercilessly cranked up another 25bps driving DXY higher.
WHAT’S UP AT THE NEXT FOMC MEETING?
CME FedWatch tool highlights the probability of changes in FOMC rate as measured by 30-day Fed Fund futures pricing data.
For the next FOMC meeting on the 14th of June, CME FedWatch tool points to an 80% probability of no hike. For the meeting on 26th July, markets are pricing a 55% probability of a 25bps hike. This would take rates to 5.25%-5.5% which is expected to be the terminal rate.
In case Fed decides to hike in the June meeting, it could lead to a sharper upward move in the DXY.
COMMITMENT OF TRADERS REPORT
The Commitment of Traders report shows weekly changes in open interest by investor category. Institutional investors expect DXY to move higher as both managed money and small speculators have increased their net long positioning over the last three weeks.
TRADE SETUP
Market expectations have moved wildly from rate hike to no hike multiple times over the past two weeks.
Cooling inflation in April, signs of a weakening job market, anemic services data, credit tightening are shaping market consensus for a rate pause in June. However, if May inflation data, which is due a day before the FOMC meeting paints a different picture or the job market continues to remain strong, the Fed may throw in another rate hike.
Anticipating Fed move is difficult. Investors deploying a long straddle can potentially lock in gains from large moves in DXY if FOMC moves against consensus.
A long straddle is a delta-neutral options strategy that can be used to benefit from rising volatility in options. It involves simultaneously going long call and long put at the same delta. Delta-neutral makes the structure directionally agnostic to upside or downside moves. Loss on one leg will be offset by gains from the other leg when the underlying moves sharply.
Straddles are powerful in that they are long Vega which makes it gain not only from a directional move but also from volatility expansion. With uncertainty looming around Fed outcomes, volatility will likely spike heading into the meeting.
A delta neutral strategy would be difficult to run directly on DXY futures due to slim liquidity for these options on ICE.
As such, investors could consider long straddles in CME Euro FX options, CME Japanese Yen options, and CME GBP options to obtain similar exposure. These three majors represent 83% of the DXY and largely drive major moves in the DXY.
The above charts show the payoff for the straddle on each of these individual options. ATM strikes can provide higher profit potential with higher risk potential.
However, ~25 delta options have cheaper premium due to which the loss is limited at a lower level, consequently, 25 delta straddle would also require a larger price movement before the position is in the money. Moreover, the profit potential on these would also be lower due to wider strike levels.
A notable exception to these is the Japanese Yen put options which have noticeably lower IVs and are thus cheaper. Each of these pairs would have to move ~1.5% over the next two weeks for the position to make money.
DISCLAIMER
This case study is for educational purposes only and does not constitute investment recommendations or advice. Nor are they used to promote any specific products, or services.
Trading or investment ideas cited here are for illustration only, as an integral part of a case study to demonstrate the fundamental concepts in risk management or trading under the market scenarios being discussed. Please read the FULL DISCLAIMER the link to which is provided in our profile description.

The Overnight Reverse Repo Facility Looks to be Breaking DownMoney that is being parked at the Feds Reverse Repo Facility due to attractively high interest rates the fed has set for money parked at the facility has been on a steady decline since late 2022 and we have now confirmed a lower high and are looking to break down below a Bearish Dragon trend line that could be the initial trigger that gets it started to going down all the way to an 88.6% retrace or lower even. One can only speculate that the money exiting this facility will lead to more trading of short term debt on the open market, which could eventually lead to yields coming down overall and for all of this excess liquidity to chase Equities instead as the value of the US Dollar declines due to the shock of all this newly added supply of liquid cash to the open market thereby causing a loosening of market conditions.

USDebtCeilingCrisis.ComLet’s make some noise for the 11th hour party people. Bipartisan talks between US President Biden and House Republicans over the debt ceiling crisis have finally come to a resolution. Well, in theory at least since there is the small matter of Congress having to vote on it later this week. US lawmakers might balk at the idea that this is an 11th hour deal since the much touted ‘hard deadline’ of the 1st of June has now moved to the 5th of June. Any chances we could see that pushed forward by a few more days in the event of further brinkmanship during the Congressional vote on the deal?
Make no mistake. Regardless of the real hard deadline before the US technically defaults on its public debt, this will have been an 11th hour deal. The thing with 11th hour deals whether they’re related to business, divorce settlements, ransom/hostage negotiations or drug deals is that they tend to be equally bad for both parties but at least everyone walks away equally disappointed. A deal as critical as the one needed to tackle the debt ceiling crisis should have been done and dusted well before this game of chicken ended in both parties swerving just before the head on collision.
The US debt ceiling issue is a bubble. The limit has been lifted 78 times since 1960 and is quite the magician’s trick. Raising the limit each time a ceiling is reached and then kicking the issue into the long grass until the next time negotiations need to take place is dangerous enough but the way in which this current deal has been tentatively reached has created micro tears in this bubble and only time will tell if the bubble bursts at some point in the not- too-distant future. Even a smooth run through Congress later this week will be short-term relief for markets as the possibility of a crash depends on the extent of any liquidity leaving the system and where exactly that liquidity drain comes from as soon as the US Treasury turns on the T-bill tap to full blast after a confirmed deal.
These are exciting times for FX traders as we trade the bull runs, the bear runs and the crashes. Keep yourself educated and informed at all times. And remember that whenever you go to the market, be careful out there.
BluetonaFX

More Rate Hikes on the MenuCBOT: Micro 30-Year Treasury Yield ( CBOT_MINI:30Y1! )
President Biden and House Speaker Kevin McCarthy reached an agreement in principle late Saturday to raise the nation’s debt limit and cut federal spending, ending a rollercoaster round of negotiations.
The current national debt ceiling is $31.4 trillion. The tentative deal would raise it by $4 trillion through the end of 2024. In return, it would cap annual discretionary spending for two years, keeping non-defense spending levels flat.
Future Fed Rate Actions
With a US default and potential economic disaster being averted, the Federal Reserve (Fed) would likely stay on its course of fighting inflation.
On May 26th, the Bureau of Economic Analysis (BEA) reported the Personal Consumption Expenditures Price Index (PCE) up by 0.4% in April to an annual rate of 4.4%.
This surpassed both the market consensus of 3.9% and the March PCE of 4.2%.
The Core PCE excluding food and energy is 4.7%, exceeding March level by 0.1%.
The surprising rebound in inflation indicates that the Fed’s job is not done, even after it hiked the Fed Funds rate seven times last year and three more times in 2023.
CME FedWatch Tool gauges the probabilities of rate hikes based on 30-Day Fed Funds futures pricing data. It shows that, on May 28th, the odds of a 25-bp hike in June FOMC meeting at 64.2%. The probability of raising another 25 bps in July is 27.1%. The futures market does not expect the Fed to cut interest rates before the end of the year.
The interest rate market is in disarray, and this may present new trading opportunities.
Mortgage Rate Tops 7%
On Sunday, May 28th, the average 30-year fixed mortgage interest rate is 7.15%, rising 16 basis points from last week, according to Bankrate.com.
This is an annual increase of 1.61%: the 30-year fixed was 5.54% on May 26th, 2022;
Prior to the Fed rate hikes, it was only 3.65%-3.85% in February 2022.
MORTGAGE30US, the mortgage rate data tracked by the Federal Reserve Bank of St. Louis, records 6.57% on May 25th. Meanwhile, CBOT 30-Year Micro Yield Futures is quoted 3.988% for its May contract last Friday. What does this mean?
The 30-year duration interest rate spread between the riskless Treasury rate and a risky mortgage rate is now 258 basis points.
For comparison, in September 2021, the same spread was only 80 bps with a 2.1% Treasury yield and a 2.9% mortgage rate.
The spread has more than tripled in the past two years.
When the Fed started raising rates last year, both Treasury yield and mortgage rate rose. The trends diverged in October. In the mortgage market, banks continued to raise lending rates in response to the actual increases in the cost of capital.
In the financial market, “Fed Pivot” expectations weighed on Treasury prices. As the Fed lowered the rate increases from 75 bps to 50 bps and then 25 bps, 10- and 30-Year bond yields fell, while 1-Month and 2-Year yields rose, creating a negative yield curve, or the so-called inverted yield curve.
Why Treasury Yield Needs to Catch Up
In hindsight, mortgage bankers are proven to be right, while the rate cut forecast by bond investors is premature. With the new twist in inflation data, both bond yield and mortgage rate have the potential to go up further in the coming months. Treasury bond yield has some “catching up” to do as investors adjust their expectations.
Here is my logic:
Firstly, raising the debt ceiling opens up trillions of dollars of new government borrowing. By the rule of supply and demand, a high demand of money will raise its price, all else constant. Treasury bond yield is the price the government paid to borrow money;
Secondly, the last-minute deal on debt ceiling helps avoid a potential economic crisis. The housing market is cooling but unlikely to crash any time soon. This ensures that the higher mortgage rates are here to stay;
Thirdly, the large interest rate spread created an arbitrage opportunity for lenders by borrowing from the bond market to fund the mortgage operations with the same maturity;
Therefore, the 30-year Mortgage-to-Treasury spread could narrow in the future. Since mortgage rate is not likely to fall, the gap could be closed by a higher Treasury yield.
We could express the view of high Treasury yield expectation by establishing a long position in CBOT 30-Year Micro Yield Futures. The June contract 30YM3 is quoted 4.000% last Friday. Each contract has a notional value of 1,000 index points, which equates to $4,000 at current quote. CME Group requires an initial margin of $300 per contract.
Current Fed Funds target rate is 500-525 bps. Hypothetically, if the Fed raises 25 bps in June, and 30-Year Treasury Yield goes up by the same amount, a long futures position could gain $250. This would be equivalent to an 83% return, excluding commissions.
Long Futures would lose money if the yield falls, by $10 for each basis point movement.
The July contract 30YN3 will begin trading this week. I would monitor the opening price to determine if it is still quoted at a discount - below short-term Treasury rate and mortgage rate.
Happy Trading.
Disclaimers
*Trade ideas cited above are for illustration only, as an integral part of a case study to demonstrate the fundamental concepts in risk management under the market scenarios being discussed. They shall not be construed as investment recommendations or advice. Nor are they used to promote any specific products, or services.
CME Real-time Market Data help identify trading set-ups and express my market views. If you have futures in your trading portfolio, you can check out on CME Group data plans available that suit your trading needs www.tradingview.com

Debt ceiling aside, watch the dollar and central bank meetings!As the debt ceiling discussions draw to a close, the dollar's rally indicates that markets have largely priced in this event. The focus now returns to the Federal Reserve (Fed) and its notably hawkish stance. Fed officials' recent statements and fed fund futures, which are pricing in another rate hike in the upcoming meeting, suggest it might be the right time to reassess the dollar pairs.
Two weeks ago, we discussed the USDCNH pair, which made a swift upward move. Interestingly, the correlation between USDCNH and USDAUD has been increasing, and USDCNH has been a leading indicator for the last few moves, with USDAUD following its trend shortly after.
To understand why, let's look at the AUDCNH as well as the USD. The moves in these pairs seem to be largely driven by the USD, as the AUDCNH has remained range-bound since 2022.
The Reserve Bank of Australia (RBA) is scheduled to meet on June 6th and is expected to maintain its policy, while the Fed will meet on June 13th and is expected to hike rates. This divergence in monetary policies could further strengthen the case for a USDAUD rally.
Current yield differentials continue to favour the USD carry trade and this trend appears set to continue as the Fed is expected to raise rates while the RBA remains on hold, widening the yield differentials.
With the Fed poised for another rate hike and the RBA expected to maintain its policy stance, along with the dollar's strengthening and the USDCNH leading the AUDUSD pair, we could express our market views via a risk-managed trade long on the USD and short on the AUD. To set up this position, we can take a short position on the Micro AUD/USD futures, with stop-loss orders placed at 0.673 and take-profit orders at 0.627. A Micro AUD/USD futures contract represents 10,000 AUD, with each point move in AUD equalling USD 10,000.
The charts above were generated using CME’s Real-Time data available on TradingView. Inspirante Trading Solutions is subscribed to both TradingView Premium and CME Real-time Market Data which allows us to identify trading set-ups in real-time and express our market opinions. If you have futures in your trading portfolio, you can check out on CME Group data plans available that suit your trading needs www.tradingview.com
Disclaimer:
The contents in this Idea are intended for information purpose only and do not constitute investment recommendation or advice. Nor are they used to promote any specific products or services. They serve as an integral part of a case study to demonstrate fundamental concepts in risk management under given market scenarios. A full version of the disclaimer is available in our profile description.
Reference:
www.cmegroup.com
www.cmegroup.com

Decoding the Structure of the Federal Reserve System 🏦
If you've ever wondered how the U.S. monetary system functions and who runs the show, keep reading. In this article, we will break down the structure of the Federal Reserve System and help you understand how it operates.
🏦 The Federal Reserve System, often referred to as the Fed, is the central banking system of the United States. It was created in 1913 by the Federal Reserve Act and is an independent entity within the government. The Fed has a three-part structure, including the Board of Governors, the Federal Reserve Banks, and the Federal Open Market Committee (FOMC).
1️⃣ Board of Governors:
The Board of Governors is the governing body of the Federal Reserve System. It consists of seven members appointed by the President and confirmed by the Senate for 14-year non-renewable terms. One person is designated by the President as Chair and another as Vice-Chair. The Board's main function is to set monetary policy, supervise and regulate banking institutions, and maintain the stability of the financial system.
2️⃣Federal Reserve Banks:
There are 12 Federal Reserve Banks located throughout the United States. Each Federal Reserve Bank serves a specific geographic district and is responsible for carrying out the policies set forth by the Board of Governors. The Federal Reserve Banks are overseen by a board of nine directors, six of whom are appointed by banks in the district, and three by the Board of Governors.
In addition to overseeing the banking system, the Federal Reserve Banks also provide services to financial institutions and the U.S. Treasury. These services include processing and clearing checks, storing currency, and distributing new currency.
3️⃣Federal Open Market Committee:
The FOMC is the most powerful body within the Federal Reserve System. It is responsible for setting monetary policy, specifically the target for the federal funds rate, which is the interest rate that banks charge each other for overnight loans. The FOMC is made up of the seven members of the Board of Governors and five of the 12 Federal Reserve Bank presidents.
The FOMC meets eight times a year to analyze economic data and determine appropriate policy decisions. Their decisions impact not only the banking system but also the overall economy. For example, if the FOMC decides to raise interest rates, it will become more expensive to borrow money, affecting everything from mortgages to credit card payments.
Conclusion:
The Federal Reserve System is a complex organization that plays a critical role in the U.S. economy. Its structure is designed to ensure checks and balances across its three branches so that no one entity has too much power. While the Board of Governors sets policy and oversees the entire system, the Federal Reserve Banks carry out those policies and provide essential services to the financial system. The FOMC, on the other hand, is responsible for setting monetary policy, affecting the interest rates that impact our daily lives.
Understanding the Federal Reserve System is essential for anyone wanting to understand the U.S. economy. Knowing how the Fed operates can help individuals and businesses make informed decisions about their finances. With this knowledge, you can better navigate the ups and downs of the economy and protect your hard-earned money.
❤️Please, support my work with like, thank you!❤️

Artificial Banks Wane: Bitcoin Ushers in Financial Epoch This chart shows a view of the top 8 banks in the United States and the charts go back to at least 2008 so you may see how artificial the bubble is.
As the Federal Reserve continues its interest rate hikes, a cloud of uncertainty looms over the banking sector. This trading strategy anticipates potential instabilities in major banks, which could catalyze a significant migration towards decentralized finance solutions such as Bitcoin. Higher rates could strain over-leveraged banks, leading to a fall in their value, while Bitcoin could rise as an alternative financial refuge.
COMBINED TOTAL OF ALL 8 BANKS = 1.5 Trillion
1. JPMorgan Chase & Co. (JPM): $391.88 billion
2. Mastercard Incorporated (MA): $360.32 billion
3. Bank of America Corp. (BAC): $218.28 billion
4. Wells Fargo & Co. (WFC): $151.81 billion
5. Morgan Stanley (MS): $137.6 billion
6. Goldman Sachs Group, Inc. (GS): $106.65 billion
7. Citigroup Inc. (C): $88.48 billion
8. U.S. Bancorp (USB): $46.62 billion
The colossal $1.5 trillion valuation of these traditional banking institutions may give an illusion of robustness, yet this façade might not withstand the test of an evolving financial landscape. These banks, laden with their outdated models and susceptibility to Fed's rate hikes , represent a realm of finance that is increasingly becoming unsustainable. I believe a significant portion of the capital currently tied in these institutions is likely to flow into more resilient, decentralized financial systems such as Bitcoin. By doing so, investors may pivot from a seemingly sinking ship to a dynamic and emergent financial framework, embracing the future of finance with open arms.

DXY Forecast | Pre Fed Chair Powell Speaks | 19th May 2023Fundamental Backdrop
Unemployment Claims decreased from 264K to 242k, far better than the forecast of 253K. This signals an overall healthier economy.
Fed Chair Powell will be speaking later on today on the concerns around the status of the US debt ceiling.
Technical Confluences
Near-term resistance at 103.500
Next resistance at 105.000
Minor support at 102.765
Idea
If Fed Chair Powell's speech is hawkish, we could see DXY break the near-term resistance at 103.500, before heading towards the next resistance at 105.000.
Alternatively, if the speech is dovish, we could see price head back down towards the minor support at 102.765
NOT FINANCIAL ADVICE DISCLAIMER
The trading related ideas posted by OlympusLabs are for educational and informational purposes only and should not be considered as financial advice. Trading in financial markets involves a high degree of risk, and individuals should carefully consider their investment objectives, financial situation, and risk tolerance before making any trading decisions based on our ideas.
We are not a licensed financial advisor or professional, and the information we are providing is based on our personal experience and research. We make no guarantees or promises regarding the accuracy, completeness, or reliability of the information provided, and users should do their own research and analysis before making any trades.
Users should be aware that trading involves significant risk, and there is no guarantee of profit. Any trading strategy may result in losses, and individuals should be prepared to accept those risks.
OlympusLabs and its affiliates are not responsible for any losses or damages that may result from the use of our trading related ideas or the information provided on our platform. Users should seek the advice of a licensed financial advisor or professional if they have any doubts or concerns about their investment strategies.

Bitcoin PA and USD and Debt ceilingOld chart now topical
With the USA "Debt Ceiling" being talked about more and more in public, it looks like this fractel may now loose some accuracy but I do expect PA to run along these lines.
The Longer PA follows a fractel, the more chance it has of Falling off
Hopefully, the 200MA (Yellow) will continue along current path and PA remain above the MA
The Big question is what will the Treasury do and how will this effect Bitcoin, Stocks and USD
It is important to remember the real situation here. BANKS have lent money to entire countries, including the USA
The banks are getting worried that Countries will not repay their debts while interest rates are High
The Treasury has been raising the Debt Ceiling to allow more borrowing from the banks
The treasury now realises, maybe, it needs to Stop Borrowing
And That will slow down business and possibly fall into recession, which in turn will upset investors
And the other Big question is WHERE WILL PEOPLE SAFEGUARD THE VALUE OF THEIR MONEY
Used to be GOLD, may still be Gold - But BITCOIN HAS A HIGH RETURN
Mr Powell from the DXY Support Group ( Federal reserve, which is a PRIVATE GROUP OF BANKERS) talks tomorrow
Everyone is waiting on that
Tomorrow is going to be Fun

KRE Is a reversal underway?KRE the regional bank ETF is down about 50 % YTD, with a couple of bank failures leading the
way. The question that arises is whether there is more downside. Faith and trust in the
the banking system is at risk. The big banks came in their rescue on First Republic. A run on
the little banks can hurt the big banks even Goldman Sacks. Holding treasuries with fixed
rates lower than current rate sucks for sure. The fed will clean up this mess and will
do it right and has started that process. KRE chart with the fisher transform indicator
and the zero-lag MACD tells me that KRE is now " reverting to the mean" & dropped below
the Fibonacci bands of the basis EMA. Line crossovers on the indicators are confirmatory.
I will seize the situation and add to my long position. Due you agree that this is picking low
laying fruit?

PANW Is this bank stock reversing or a correction?PANW as a stressed back stock has been trending down. However as seen with the regional
banks at large ( KRE as an example ) the bear market had a bullish rally the past couple of
trading days. So, is this a reversal to trade or merely a pullback of the trend down good for
a short entry? On the 15 minute chart price has ascended to outside the Fibonacci bands
(EMA 42 2.618 bands) where mean reversion may soon apply. The fisher transform lines are
approaching the redline above where reversal is statistically likely. On the zero lag MACD,
the lines have crossed and are about to cross the zero line. Overall, the chart suggests to be
that PANW and perhaps the regional banks in general are merely taking a break from the trend
down. I see this as an entry opportunity to join the continuation of the trend and will take
a short position.

💥 WORLD ECONOMY: ...big drop is coming? 😡Amazon rarely delays deliveries, but I ordered the crystal ball over 30 years ago and it still hasn't arrived! 😢😂 ...So, I don't know what will really happen in the coming months, but what we can do right now is try to make some considerations.
The chart above represents the DJ Transportation Index , an excellent "thermometer" of US economy. If we look at a monthly time frame, we see that a deep pullback appeared after a structure with "Wave 1 Extension", so we cannot exclude that it could happen again. At the same time however, we see that the Price Action has reached an important static support around 14,000, and only its failure could confirm a bearish leg with a first target around 11,000, obviously we are talking about a monthly chart, so to confirm this hypothesis, we have to wait until the end of the month.
In this historical context, many things could change in global economy, and the geopolitical situation is one of the main actors of this period. Inflation, the war in Ukraine, wide social gap, the dollar crisis, are all key factors that could still lead to uncertainty in the medium term.
INFLATION and THE PRICE WAR
We are well aware that a large part of the developed economy is struggling with rising prices, and even if inflation in the U.S. and in Europe it is driven by different reasons, Central Banks are using the same tools (are they wrong??) of monetary policy, , but something could change in the coming months. The most important Central Bank (Federal Reserve) could face a diabolical "pincer", because the danger of hyperinflation is the same as a potential stagflation.
Thanks for your attention.
A.B. ❤

Rising wedge still on the tableThis rising wedge of relief rally is very much happening,
All market movers (Fed, gov, banks & exchanges) will push for increases in assets for insiders to sell off.
Micro ( 1 month ) go long
Macro ( 3 month+) go short
Inflation needs to be addressed, money printing and spending approaching big lows
same old sh!t, just new school assets playing their part of the manipulation game
just my paranoid opinion, share yours, all welcome!

Got mine, happy Friday, doneOANDA:EURUSD
Took a short scalp before news and TP hit
Nice way to end the week, a good week....

IMPORTANT! Bitcoin Long-term Price Projection Update!I have officially decided to update our long-term price projection for Bitcoin. A major key change is the elimination of the mini-bull market. Instead we are expecting the current bull market to develop into a major bull market. There is also a very high likelihood that this will be the only bull market for the 4th cycle. In this video we partially stepped outside of The Crypto Weather Channel world to explain our reasoning behind these changes. Thanks for watching!

Euro thoughts before fomcI believe eurusd is gonna make new highs after today's fomc number release! We have a daily order block and price can sweep the liquidity into this order block before going for the previous weekly high as the first target!
It is much better if we do not touch the previous weekly high before the news! Otherwise the probability of the bullish case drops in my opinion!

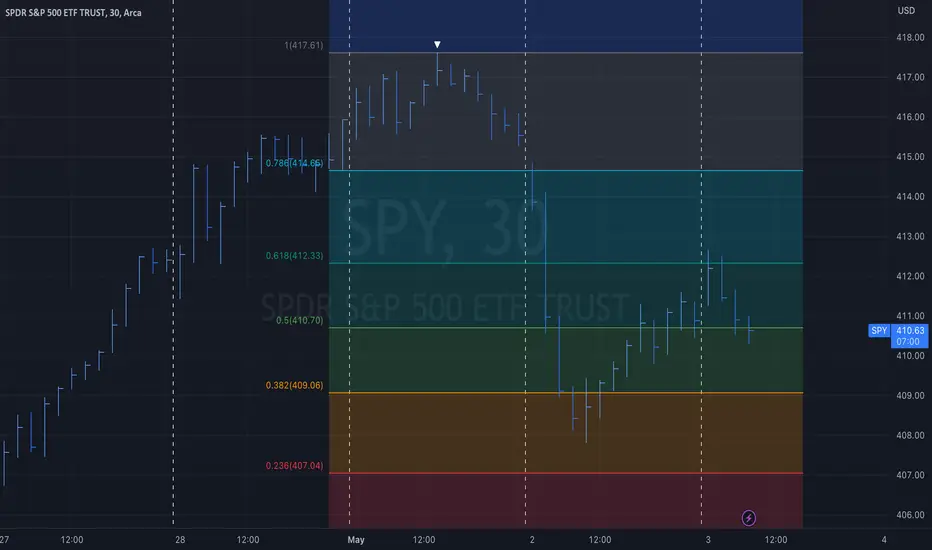
$SPY Fibonacci Support and Resistance Levels FOMC announcementAMEX:SPY Fibonacci Support and Resistance Levels FOMC at 2pm
Free Market vs The FedAs of late, the vast majority of us probably have been hearing about "too big to fail" or " a free market vs. a central market" What does all of this mean?"
Well, let's go over some of the basic stuff. As in some of my prior posts, it is important to understand that the "Fed" does NOT control mortgage rates or loan rates from your local banks. Let me repeat that the Fed does NOT control mortgage rates or consumer loan rates
So now you might ask yourself why the Fed raises rates matter?
Well, that's a great question. Because, in short, it should not matter if we were in a free market. Well, sadly, we are not in a free market. We are in a centralized market with different flavors available to us.
"Ah, but Guy, you just contradicted yourself by saying the fed does not control mortgage rates, and now you're saying we're in a controlled market rabel rabel rabel "
Let me explain... The Fed cannot have any direct contact with "average" consumers; it's currently illegal FOR NOW . Now, everyone, the biggest fear with CBDC is a rightfully placed fear. And we will discuss this in a separate post.
So, view the Federal Reserve's manipulation of the economy as a game of pool (billiards) or snooker; what have you. In billiards (for the purpose of the post, billiards = pool), the player cannot directly hit the numbered balls with the stick (cue). Instead, one must use a medium to engage the cue ball. So, to pocket your balls, you must have a small degree of understanding of physics to transfer energy from you to the stick to the cue ball to the desired ball into the desired pocket.
The Fed (cue) is the same way. They set the FFR (cue ball), which then goes to the regional and big banks (numbered balls), which then sink into the economy (pocket)
So, how does this work? To explain that, you need to understand how a bank makes money.
(The Following is highly watered down for simplicity's sake)
A bank does not make money because you have an account with them. On the other hand, a bank makes money BECAUSE you have an account with them.
So when you use your local JPM, WFC, or C bank :) as a piggy bank, they pay you an interest rate of something like a percent of a percent; however, it's still considered a liability to the bank because that's cash flow going to you from them even if it's a penny a year.
So, how can they make money then?
The fractional Reserve system. Mike Maloney debates this, and I'm super interested in hearing his thoughts on this... another post for another time.
What is the Fractional Reserve System? Basically, for every dollar you put into your account, the bank can lend out 10$
It's basically in place because you're not running to the bank to close your account. So, they can do this. When you put money into your account, it's already out the door into someone else's pocket in the form of a loan by the time you place your wallet in your pocket/ purse what have you. And that's probably too slow for the bank. (velocity of money)
Well, that bank's balance sheet of physical liquid cash probably only is enough to pay the onsite staff hourly wage the bank needs more. so they have one of two options
1. go to the Fed and borrow money at the FFR
2. go to the repo market and borrow from another bank by offering t-bills and bonds as collateral. (shadow banking)
Typically they go with number one because it's cheaper.
The vast majority of times they use the repo market is for cash now! or if their risk management department is trying to make some quick cash off the bond market. (shadow banking is outside the purview of this post, and I'm still learning about it. I will post about it later)
( the fed lining up their billiard shot) So, the Fed has decided the US economy needs to grow more...
(the Fed hitting the cue ball) So, lets say the Fed makes the FFR 0% (hypothetically LOL)
( the cue ball hits the numbered ball) So your local JPM will go to the Fed and take out a loan at 0%, so they need to lend this money out and make money, and make their, JPM's rate, interest rate on that money 3% LOL!
(The numbered ball sinks into the desired pocket) you the consumer want to go out and buy something you can afford on your 9-5 salary.
So you go to the bank and qualify for a loan at their 3% rate to be amortized over 10-30 years, and the economy grows.
If that sounds familiar its coincidence LOL
However, in a free market how it would work is the loan system would be heavily dependent on the local economy and local wage potential.
How?
If a bank is set up in an area with low-income earning potential, then the market will tell the bank exactly how much they can charge on money.
Example: let's say the Risk Manager at your local WFC decides he is conservative and makes the DTI Ratio for loans 30%. That means the minimum someone must make for a 200,000$ loan is around 60,000$. If the local median income is 45,000$, no one can afford a 200,000$ loan. The maximum loan amount they can make is around 150,000$.
So, for the bank to grow, it either needs to up the DTI requirements, it needs to be content with its current earnings and hope the area grows or wages increase, or it can close down and move.
Now where the free market comes into play is when WFC is having their DTI at 30%, JPM is at 40%, and C is at 60%, (free market remember) in the same area as the example
The following happens:
WFC sees their default rate is less than 10%
JPM sees thier default rate at 40%
C sees thier default rate in the upper 80%.
So, what this means is that the market is telling WFC they are leaving money on the table but are playing it safe. Because less people qualify for the loan
JPM has almost found the sweet spot. 40% of their loans are in default, but more than half are paid on time. could use some minor tweaking but solid none the less. (With my risk tolerance, 30-35% default is a good number depending on loan size.)
C is in trouble because they have lent out too much, and people can't afford that much money in the area.
So in a free market, WFC will fail in the area because they're not seeing enough volume, and C will fail because they're seeing too much volume. which leaves JPM to buy up both of the failing banks and grow bigger LOL!

Calm before the stormTVC:DXY
Welcome, mingle around for a few hours, and have a seat...
We have a special treat for you later in the day.
