GBP/USD soars as US inflation fallsThe British pound has surged in today's North American session. GBP/USD has jumped a massive 1.20% on the day and is trading at 1.2218.
The economic calendar is very light on both sides of the pond today, but that didn't matter as today's US inflation report has sent the US dollar on a nasty slide. The July data saw both the headline and core readings come in lower than expected. Core CPI remained steady at 5.9%, lower than the forecast of 6.1%. However, the real news was the headline reading, which dropped to 8.5%, down from 9.1% in June and below the estimate of 8.7%.
It is of course too early to talk about a peak in inflation based on one reading, although readers may see some headlines trumpeting just that. Still, the markets have responded with vigour, sending the US dollar sharply lower on the assumption that the Fed can ease its rate hiking, possibly to a 50 basis point hike in September. It wasn't long ago that a 50bp rise was labeled "supersize", but times have changed and with central banks raising rates by 75 and even 100bp, a 50bp move is almost modest.
The Fed is breathing easier today and is hoping that inflation is on its way down, after relentlessly accelerating. This is also good news for President Biden, as voters have been hit hard by the cost of living crisis and may well take out their anger on the Democrats in the mid-term elections. I'm assuming Biden will not credit his brand new Inflation Reduction Act as the reason that inflation has fallen, but there's no doubt that the drop in inflation is great news for the White House.
The pound certainly got a fortuitous break as US inflation fell and has taken advantage by rising sharply. It could be a very different outcome on Friday, as the markets are braced for a downturn in the UK economy. GDP is expected to slow to 2.8% YoY, down from 8.7% in Q1. On a quarterly basis, GDP is projected at -0.2%, following a 0.8% gain in Q1. If GDP is weaker than expected, a fall in the pound is a strong possibility.
GBP/USD is testing resistance at 1.2241. Next, there is resistance at 1.2361
There is support at 1.2123 and 1.2061
Federalreserve

Euro edges higher despite soft confidence dataThe euro has started the week in positive territory. In the North American session, EUR/USD is trading at 1.0217, up 0.36% on the day.
The week wrapped up with a superb nonfarm payroll report, which sent the US dollar broadly higher. However, the gains proved to be short-lived, as the euro has recovered most of Friday's losses. The July nonfarm payroll report posted a blowout gain of 528 thousand, crushing the estimate of 250 thousand, and improving on the solid June release of 398 thousand. Unemployment ticked down to 3.5% from 3.6%, and wage growth remained unchanged at 5.2%, ahead of the forecast of 4.9%.
The nonfarm payroll release was certainly impressive, but the Federal Reserve may be less than enthusiastic. Why? Since the data points to a tight labor market, especially the sharp gain in wages, as firms continue to experience labor shortages and must sweeten their compensation in order to attract employees. At 5.2%, wage growth is far higher than the Fed's inflation target of 2%, and Fed policy makers are concerned about a wage-price spiral which could increase inflationary pressures and force the Fed to remain hawkish.
Fed officials were already pushing back against the idea that the rate-hike cycle was almost over, and with the latest employment numbers, the Fed may feel the need to remain aggressive and respond with another supersize 0.75% increase at the next policy meeting in September. Fed Chair Powell has said that the Fed will be data-dependent as it considers its next move, which means that upcoming inflation and employment reports will be crucial and carefully monitored by the markets and Fed officials.
The eurozone could well face a recession, as Germany, the bellwether of the bloc, has posted weak data which is raising concerns. With a possible energy shortage this winter due if Russia decides to turn off the tap, the economic outlook is troubling. Unsurprisingly, German and eurozone confidence indicators have been pointing downwards, a reflection of uncertainty and pessimism. Earlier today, Eurozone Sentix Investor Confidence for August came in at -25.2, a bit better than the July reading of -26.4 but shy of the estimate of -24.7. This indicator has been mired in negative territory for a sixth straight month, pointing to prolonged pessimism amongst financial experts.
EUR/USD is testing resistance at 1.0199. Above, there is resistance at 1.0274
There is support at 1.0103 and 1.0028

GBP/USD slides as Nonfarm Payrolls surgesThe British pound is falling sharply in the North American session, after a massively strong US nonfarm payment release. GBP/USD is trading at 1.2040, down 0.98% on the day.
It wasn't so long ago that US nonfarm payrolls was one of the most anticipated events on the economic calendar and often had a significant impact on the movement of the US dollar. That has changed in the new economic landscape of red-hot inflation and central banks raising interest rates practically every month. The markets seem more absorbed with new inflation records and the threat of recession, which may make for more catchy headlines than labor market statistics.
Today, however, NFP demonstrated its ability to be a market-mover. The July gain of 528 thousand crushed the estimate of 250 thousand and follows the June release of 372 thousand. The US dollar has responded with strong gains against the majors, as a strong labour market will enable the Fed to remain hawkish with its rate moves.
The BoE was widely expected to raise rates by 50bp, and the central bank did exactly that. The MPC vote was 8-1 in favour, with one member voting for a 25bp hike. This split shows that Governor Bailey appears to have the MPC members in line, which should bolster Governor Bailey's credibility. With inflation hitting 9.4% in June and no sign of a peak, the BoE has been accused of raising a white flag with regard to inflation. The 50bp increase, the biggest in 30 years, is an important step in fighting inflation, which has hit 9.4% and shows no signs of peaking. Even with this hike, the Bank Rate is at 1.75%, well behind the Federal Reserve, the central banks of Canada and New Zealand and others.
The BoE's rate increase was accompanied by a stark warning of a prolonged recession, and the pound responded with losses. The pound managed to recover these losses but it is clear that the currency isn't getting any support from the BoE's rate moves, with such a huge gap between inflation levels and current rates.
Investors were also less than impressed as the BoE said that it might ease up on raising rates in the coming months. Governor Bailey has said he would be forceful in combating inflation, but the message that the central bank doesn't plan to be forceful with its forward guidance is weighing on the pound.
GBP/USD is testing resistance at 1.2128. Next, there is resistance at 1.2295
There is support at 1.2010 and 1.1876

XAUUSD - KOG REPORT - NFP!KOG Report – NFP
This is our view for NFP today, please do your own research and analysis to make an informed decision on the markets. It is not recommended you try to trade the event if you have less than 6 months trading experience and have a trusted risk strategy in place. The markets are extremely volatile and can cause aggressive swings in price.
We’re going to keep this short this time as we don’t really want to get stuck around this price point if there is a move to come during NFP and the US session. We’ve done well this month so far with most of our targets being hit and the move on Gold that was illustrated in our reports now being completed.
For us this is a short region, however, we have NFP so it’s thrown a bit of a spanner in the works. For that reason we have plotted the higher levels on the chart that we feel would represent price regions to short from and the lower levels we feel would represent an opportunity to long from.
The key resistance here is that 1795-1806 level which has been used previously to propel the price in either direction so there is a possibility of a spike into that area before then coming down and then coming back up at some point. A break of this level and you can see the higher levels that we have illustrated, the highest one around 1825-35 is our preferred choice to short if it goes there!
When it comes to the lower levels, we’re looking for the price point of 1775 as a key region which if broken should take us down into that lower level shown where, based on strong support we feel an opportunity to take the long trade back up could be on the cards.
Please note, this chart is for NFP only at the moment, and that’s if the price moves. Lately, we’ve seen most NFP’s and FOMC are priced in and we don’t get much of a chop in the markets.
In summary, we’ve been following the same plan for a few months now and will remain with it. We can see a push to the upside at some point into that 1825-35 price point, so please keep this level in mind!
Please do support us by hitting the like button, leaving a comment, and giving us a follow. We’ve been doing this for a long time now providing traders with in-depth free analysis on Gold, so your likes and comments are very much appreciated.
As always, trade safe.
KOG

USD/CAD eyes Canada, US job reportsIt's a busy day in both Canada and the US, with both countries releasing July employment reports. It wasn't so long ago that US nonfarm payrolls was eagerly anticipated and was the most important event of the week. The NFP often had a significant impact on the movement of the US dollar. That has changed in the new economic landscape of red-hot inflation and central banks raising interest rates practically every month. The NFP has been overshadowed as the media breathlessly reports new inflation records and the threat of a recession. Still, the NFP remains an important indicator and a surprise reading can still shake up the markets.
The July NFP is expected at 250 thousand, following a surprisingly strong June release of 372 thousand. A weak reading will raise concerns about a recession, which would likely see US yields and the US dollar fall. Conversely, a stronger than expected number would probably boost yields and the US dollar, as a stronger labour market would allow the Fed to remain hawkish regarding rate policy.
The markets have priced in an inflation peak and the Fed winding up its rate-tightening cycle, which has sent the US dollar on a hasty retreat. Fed policy makers have been pushing back, sending out the message this week that there are more large hikes on the way as inflation is not yet under control. A strong NFP reading would reinforce the Fed's message and provide some support for the US dollar.
Canada will also publish employment data later today. The economy is expected to have created 20.0 thousand jobs in July, after a decline of 43.2 thousand in May. A stronger-than-expected reading should boost the Canadian dollar, while an underperformance could result in the currency losing ground. As well, Canada releases Ivey PMI. The indicator slumped to 62.2 in June, down from 72.0, and is expected to slow to 60.3. A surprise reading could have an impact on the direction of USD/CAD in the North American session.
USD/CAD is putting pressure on 1.2899. Above, there is resistance at 1.3002
USD/CAD has support at 1.2741 and 1.2686

Yen edges lower ahead of household spendingUSD/JPY continues to gain ground and has pushed across the 134 line. In the European session, the pair is trading at 134.12, up 0.20%.
The week started off nicely for the Japanese yen, which took advantage of broad weakness in the US dollar. USD/JPY fell 1.22% on Monday and touched a low of 131.60, its lowest level since mid-June. However, the dollar has since recovered and then some with a strong rally.
Japan's household spending was miserable in May but is expected to bounce back in the June report. Household spending declined in May by 1.9% MoM, with a June forecast of a 0.2% gain. On an annualized basis, Household Spending fell in May by 0.5%, marking a third straight decline. The forecast for June is for a strong gain of 1.5%.
Inflation is much lower in Japan than in other major economies, but food and electricity prices have been rising sharply due to the war in Ukraine. Households have responded by cutting their spending on items such as vegetables and cars. A rebound in the June report would indicate increased consumption. That would certainly be good news for the economy, which contracted in the first quarter.
There is increased chatter in the markets about the Fed nearing the end of its rate-tightening cycle and actually lowering rates, but Fed policymakers are trying to dispel that notion. A slew of Fed members have been sending out the message that the inflation battle is far from over and further rate hikes are coming. James Bullard, for example, said that he expects 1.5% or more in rate increases this year and the hikes won't peak until the Fed is convinced that inflation is easing lower. Bullard downplayed the consecutive quarters of negative growth in the US, saying that the strong labour market was proof that the US was not in a recession. The Fed does not hold a policy meeting until September and will have some time to monitor data and determine whether to deliver a rate hike of 50bp or 75bp.
USD/JPY is putting pressure on resistance at 134.40, which was tested on Wednesday. 136.30 is the next resistance line
There is support at 131.34 and 130.70

Alphabet Inc - Short PositionWith an underlying share value equal to $117, Alphabet Inc has seen bullish movements since our last position published on 28/07/22. When reassessing Alphabet Inc using a 4hr range, investors can see that it’s now trading above its central Fibonacci PP level. In fact, the stock is trading above its PP 0.382 1st level resistance. The underlying price of Alphabet is in line with it's PP 0.5 resistance level. This is a bearish signal, investors should anticipate bullish trends to begin to correct and for stock prices to bear towards their support. Whilst it would be reasonable to anticipate the bullish resistance trend to continue to strengthen, this signal tells us to begin to anticipate a bare and profit off a short. This notion is further supported by the 20-day ranged Bollinger Band. The underlying stock price is currently trading close to the Bollinger’s upper bound which suggests a correction toward it’s lower bound, close to the Fibonacci’s central PP level. It would be justified to set a buy price in line with the Fibonacci’s P 0.5 resistance pivot. We anticipate the underlying stock price of Alphabet to reach this resistance point before bareish corrections occur.
Therefore, we have set a buy price in line with the PP 0.5 resistance pivot, our investors will look to buy at a price of $118. Based buy and sell trends since the start of the year, we anticipate a strengthening bareish trend. We anticipate bareish trends to strengthen over bullish trends and for the underlying stock price to reach it’s Fibonacci support level. We have set a target price in line with the Fibonacci’s PP 0.5 support level. The buyer should sell at around $105.

DXY As I said FED increased the interest rate . That's an update. That's analyses based on trend lines, price action, and wave analysis.

Yield Curve Inversion Imminent (3M/10Y)Well, it has happened again!
We of course see the 2yr/10yr yield curve inversion:
It has been like this for some time. However, all I hear is: “But this time it is different!”
The U.S. curve has inverted before EACH recession since 1955, with a recession following consistently between 6-24 months after. Only one time in this time-frame has this signal failed.
I am hearing now, the only yield inversion that matters is the one the fed is paying attention to.
The 3-Month/10-Year.
Let’s keep in mind the Federal Funds Rate will continue to rise, most likely at a more modest pace and maybe with less regularity.
The point being that the 3month is highly correlated to the federal funds rate:
With the federal funds rate rising, and the 10y dropping we can speculate that even this 'curve comparison of curves' will also invert.
WHAT DOES THIS MEAN TO ME?
Inflation is certainly high, and the federal funds rate rising will reign it in with the sacrifice of jobs & growth
The yield curve impacts businesses & consumers
The higher borrowing cost will impact car loans, and mortgages
We are already getting data indicating a cooling housing market
Many Americans live off plastic credit cards. When the short-term rate rises the US Banks raise the benchmark rates for consumer loans, credit cards and other borrowing products. This increases cost for consumers.
Many banks love this environment. They enjoy the spread. When the yield curve steepens, banks borrow at lower rates and lend at higher rates. When the curve is flatter their margins are squeezed, which deters lending.

Macroeconomic ViewDecember 2021 seems to be the end of this long lasting bull market.Markets affected by the inflationary easing policies followed by the FED, going back to the end of the subprime mortgage crisis, were blooming.
The rise of the NASDAQ100 is only an example of what happened due to boosting culture adopted by FED. This brings us to now.
What US is facing is the inflation rate rising, while interest rate hikes look like not being enough to pause this. The Ukraine-Russian war is something that adds on the energy crisis existing globally, even though it is not the only reason to blame for the rising on CPI .FED-among many countries- decided to counter COVID-19 loses with further easing providing money that correspond to no real product, and basically as Milton Friedman would point providing the market with inflation . What we are watching though is an effect of what has been accumulated for years and has no single cause.
The recession scenario seems to be the most realistic one for the years coming.
It is my view thought that what FED is trying to achieve with the rate hiking though, is not to control the inflation , but rather to make the production less "money supply prone" so that the effects -the most important being production decline and unemployment rise- of the imminent freezing of the money flowing out of it's machines will be minimised.

📌 How long Will this AltParty last? (crypto & Altcoins)🥂🚀 What is the reason behind the recent growth of crypto market❓❔
The rise of cryptocurrencies following market optimism to reduce/stabilize the trend of increasing interest rates without the risk of recession❓❔❕❗
✅ BITCOIN has reached above $24 k and Ethereum above $1700 , and the markets are still welcoming the possibility of the arrival of the last steps of the US central bank to suppress inflation, as well as optimistic data indicating a slowing down of the economy (without the risk of entering a recession). Although, in reality, the drop in the GDP of the United States in this quota was more than expected; The gross domestic product was not positive this time either, and recording the second consecutive negative number (although small) for this index, at least from a technical point of view, means that the world's largest economy has now entered a "recession".
✅ It seems that the market's interpretation of this economic contraction was something else; The market now believes that in the face of this bump in the path of economic growth, the Federal Reserve will actually put the brakes on its interest rate hike at its next meeting in September.
In fact, the market has already celebrated this auspicious event, and after that, the risk-free indicators of the market all started to rise. From the S&P 500 index to the Nasdaq and the Dow Jones, they all began to rise, and of course, as expected, whenever there is talk of risk-taking, cryptocurrencies have been and are at the forefront of jump and sharp movements.
✅ In fact, although we have entered a "technical recession", many economists - and even Jerome Powell (Federal Reserve Chairman) and Janet Yellen (US Treasury Secretary) have so far refused to use the word recession because other factors For example, the "labor market situation" is considered as a sign of a "strong economy".
✅If we look closely, the optimism came when on Wednesday, investors reacted positively to a 75 basis point increase in the base rate by the US Federal Reserve and Powell's "dovish" signals that the Federal Reserve is unlikely to raise interest rates in the next few months. . The next day, that is, Thursday, following the announcement of the second negative GDP data in a row, Yellen stated that the definition of an economic recession is actually "a broad weakening of the factors of the economy" and "this is not what we are currently witnessing". And of course, it is believed that Yellen was referring to the National Bureau of Economic Research's (NBER) definition of the term recession, which, in addition to GDP, also includes indicators such as employment, personal income, and industrial production in the definition of this term.
👉 It didn't take long that the wave of optimism caused by this misinterpretation quickly spread from the stock market to the crypto market, and in the middle of the rise of cryptocurrencies, even the negative news related to the bankruptcy filing by the Zipmex exchange in Singapore was lost. Voyager Digital, which filed for Chapter 11 bankruptcy protection in a U.S. court earlier this month, also faced an executive order to stop spreading falsehoods about government support. But even this bad news could not stop the crypto party.👌💯
📛 But The question is ;how long does this celebration last? 🤔
We know that the economy is now walking on the edge of inflation-recession. All the tools that the Federal Reserve has are to control the demand side; So the Fed cannot control the inflation caused by the crisis in Ukraine, this institution does not even have control over the inflation caused by the supply chain problems, and this is what we think will cause the world economy to slide into recession sooner or later, and may all this celebration will not be stable (from stocks to crypto).
This article is for informational purposes only. It should not be considered Financial or Legal Advice.

USDJPY fundamental analysis: Is the yen out of the woods now?The Japanese yen rose to 133 against the dollar ( USD/JPY ), recovering from its 24-year lows.
Short-term tailwinds are supporting the yen as the market has repriced Fed interest rate risks to the downside and has already priced in a rate cut in the first half of 2023. The yen is currently doing well in its traditional role as a recession hedge, with the US economy in a “technical recession” and the need to maintain growth “below potential” for a while in order to rebalance supply and demand. The yen has also recently received fresh support after Bank of Japan Deputy Governor Masayoshi Amamiya acknowledged that the BoJ should start considering the tools for ending ultra-loose monetary policy, even though the actual shift will not take place soon.
USD/JPY vs US/Japan 2-year spread
Treasury yields are falling, providing some relief to the rate differential between the United States and Japan, which has been the primary driver of the yen’s depreciation this year.
The 2-year yield spread between the United States and Japan has narrowed to around 300 basis points (or 3pp), as the US 2-year yield fell to 2.87 percent, while the Japan 2-year yield remained negative at -0.1 percent.
Despite this short-term narrowing of the US/Japan rate spread, the monetary-policy gap between the Fed and the BoJ still remains well in place, which may prevent the yen from strengthening too much against the dollar, unless some major catalysts occur.
What could push USD/JPY below 130?
The first refers to disappointing US employment and economic data, which would support an economic slowdown. If this is coupled with easing inflationary pressures, it would strengthen market expectations of a Fed’s policy U-turn in early 2023, pushing the 2-year US/Japan differential to 2.5 percent or slightly below. This level is consistent with a USD/JPY pair in the 128-130 range.
The second factor that could support the yen’s resurgence is Japan’s rising inflation rate, which, despite remaining relatively low, has risen for 10 consecutive months, exerting pressure on the Bank of Japan to change its monetary policy.
Bottom line: short-term relief, but medium-term doubts
In general, the macro picture may be tilting in favour of the yen, at least in the short term, but the downside risks, in the medium term, are not over.
The Fed has already stated that the Q2 GDP figures should be taken with “a grain of salt” because the labour market remains very solid and tight for an economy in recession.
There will still be two inflation prints in the United States between now and the September 21 FOMC meeting. Despite the fact that the United States was already in a de facto recession in the first half of the year, inflation has continued to rise.
As a result, it will be remarkably difficult to bring inflation down quickly, implying that the Fed must maintain a hawkish stance for the months to come.
Analysis by Capital.com's forex and metals analyst Piero Cingari

How to trade USD after the rate call? NZDUSD exampleLast night the FED raised their interest rate by 75 basis points.
When interest rates go up, the currency should strengthen right? However looking at NZDUSD from a technical standpoint the market was oversold. Therefore the market has no place to go but up!
Now the market it overbought and it is time to sell it again at 0.6260. There is nice consolidation and divergence happening now.
45 pip stop loss and targeting 90 pips.

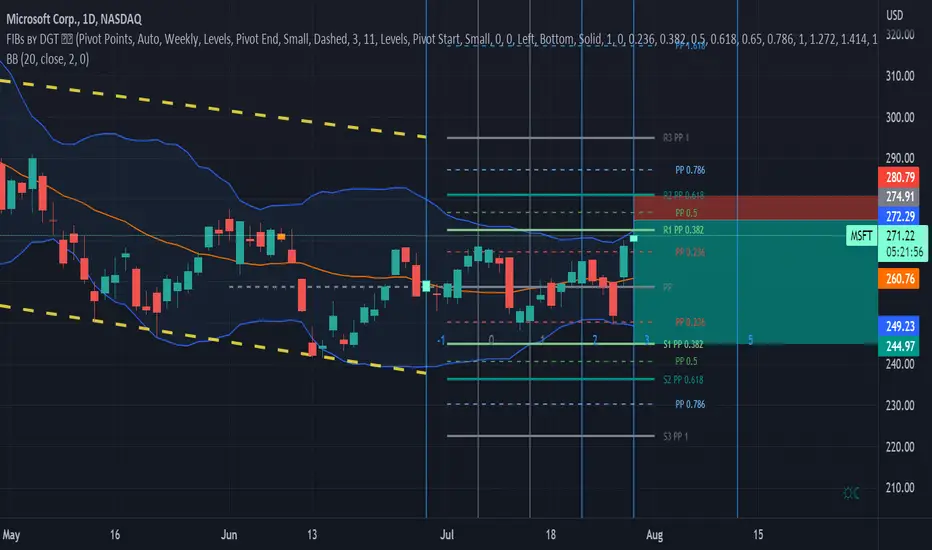
Microsoft Short PositionCurrently trading around $270, Microsoft is priced close to this month’s R1, PP1 pivot resistance level. Currently priced bellow this weaker resistance level the stock is trading above its central PP level. Furthermore, using a 20-day ranged Bollinger investors can see that the price currently lies just below its upper bound. In fact, the upper bound is equal to the R1, PP1 resistance level supporting a bareish sentiment.
Based on these signals, it would be reasonable to assume a bareish correction towards its support. However, it would also be reasonable to assume more bullish movement towards it’s PP1 resistance pivot before any bareish corrections were to occur. Based on buy trends represented by the green candles, it would seem as though there will be modest bullish movements before the stronger bareish corrections were to occur. This trend is represented by swing high and low patterns since the start of the year.
Therefore, we have set our purchase price in between the PP 0.5 and R1 resistance levels. We anticipate based on chart trends that the green candles will reach the price of at least $275 before any bearish corrections occur. The team have set a target price in line with the Fibonacci’s S1, PP 0.382 support pivot. The buyer should sell around $244.
Moreover, negative earnings are expected to be announced today. Therefore, expect bareish corrections in line with this report.
Zomato LTD - Short PositionHaving closed yesterday at a price of $43 the price has seen buying momentum throughout the week as represented by the daily green candles.
When taking a broader picture, the golden lines present the swing low/ high points since the start of 2022. This shows an incredibly greater resistance to the short-term buying trends like those presented in the past couple days and a far greater bearish momentum.
The data present monthly Fibonacci pivot levels. Currently priced at $45.5, the stock is valued moderately within its middle, S2 support level (PP 0.618).
The middle bound; P value is equal to $62. Based on the current macroeconomic climate and the stock’s previous yearly performance, the overall trends presented are bareish in sentiment. Therefore, it is unlikely for the price to reach this level by the end of the week. It is highly unlikely to reach its resistance. I anticipate the selling candles to begin to resist the green buying candles however I anticipate the green candles to reach at least $47.8 before this resistance begins to occur.
Therefore, our target is bareish and we anticipate the price to strengthen towards a greater support level. The target is in line with this month’s Fibonacci S3 (PP1 Pivot level). We have set the purchase price as $47.8, this allows a reasonable P&L level and Risk/Reward level.

Gold analysis: Is the worst behind us? Gold prices reacted positively to the Federal Reserve's decision not to raise interest rates by a full percentage point in July.
First and foremost, the reduction in expectations of future rate hikes due to concerns about a recession in early 2023 drove gold above $1,740 per troy ounce. The expectations of lower rates in 2023 also weakened the US dollar, as evidenced by the DXY index falling to the 106 mark, as of this writing.
Is the worst for gold now behind us?
Even though fears about rates are less than they were a few weeks ago, there is still no sign that the Federal Reserve is taking a more dovish stance.
However, gold may begin to decouple from its negative relationship with interest rates and see strong investment demand if economic actors start to factor in that inflation will be difficult to control even with higher interest rates.
The event of a de-anchoring in inflation expectations, which historically happened when inflation exceeded the double digit mark, will provide a strong support for gold as inflation hedge.
Gold technical analysis
Technically, the downward channel is still in place, but gold's price momentum is picking up as the RSI is getting close to the important 50 threshold, which it hasn't seen since mid-June.
The MACD offered a bullish crossover this week, supporting the thesis of a likely short-term trend rebound.
Gold is attempting to test the $1,750 resistance level, which if broken could open the door for a $1,786-1,790 resistance test. Beyond this point, the psychological level of $1,800—which corresponds with the upper line of the descending channel—becomes crucial for a trend reversal confirmation.
On the downside, $1,710 continues to offer strong short-term support, and year-to-date lows of $1,680 appear more difficult to retest if the Fed doesn't unexpectedly make extremely hawkish comments before the September meeting.

Fed rates and S&P 500 analysis: A short window to rebound?Following the Federal Reserve meeting, which delivered a back-to-back 75-basis-point rate hike to 2.25-2.5% ( USINTR ), S&P 500 index broke above 4,000 points, marking a 2.6% daily gain, as market expectations pointed to a halt in rate hikes at the end of the year, and a rate cut in the first half of next year.
A window for a "bear market rally" in the S&P 500 could be the case between now and the next September meeting if upcoming economic data indicate a peak in inflation and a weakening labour market. This would bolster the Federal Reserve's soft-landing goal and keep short-term interest rates in check.
First of all, the market is repricing the fear of an impending recession, as the earnings season continues to produce positive results. Second, given the recent negative correlation between short-term rates and the S&P 500 index, a stabilization or even a decline in short-term 2-year Treasury yields would provide further oxygen to the stock-market rebound.
Momentum indicator (14-day RSI) has been hovering above 50 for the past week and is now pointing northward, indicating that bulls are gaining the upper hand in the short term.
4,160 is a short-term technical resistance at the May/June peaks and March 2022 support. A break above this level would pave the way for a 4,300 target (4 May high). A rise to 4,500 (21 April high) seems to be more challenging at this stage.
The alternative scenario, in which inflation data remains higher than expected and Fed representatives remain extremely hawkish, might portray a pullback in the 3,800-3,720 region. However, to revise the S&P 500 ’s year-to-date low ( 3,639 ), it is appropriate to witness a new "rate-shock", with short-term Treasury yields spiking above 3.4-3.5% in response to a Federal Reserve's aggressive tightening bias.

Why Bitcoin cant go up right now ? After FED's interest rate decision Bitcoin started increasing quickly to its channel's resistance level. If it's wanna breakout from the channel we need a high volume at breakout. Importing point in this situation is because of FED, Bitcoin increased without being accumulated. So before a breakout, we have to see an accumulation zone(for example flag formation) that's how BTC can take power to breakout.
-Moving averages below price saying uptrend
-CCI is in the overbought zone. A correction move can happen.
-Momentum turned positive newer.
-ADX is 36 so the trend still can get more powerful after an accumulation.

Fed hints at slowing down after a 75 bps rate hikeEUR/USD 🔼
GBP/USD 🔼
AUD/USD 🔼
USD/CAD 🔽
XAU 🔼
WTI 🔼
Earlier today, the Federal Reserve continued its path of aggressive rate hikes by increasing it by 75 basis points to 2.50%. Meanwhile, Chairman Powell claimed it would be appropriate to slow down the tightening eventually, providing some breathing space for other major currencies, USD/CAD dropped from 1.2895 to 1.2821.
Regarding concerns over a recession, the US GDP data for the second quarter will be available tonight, and the market estimated a 0.5% growth - which could avoid meeting the technical definition of a recession.
As the dollar retreated, the British Pound became the bigger winner, GBP/USD rose and stabilized at the 1.2170 level, gaining over 130 pips to close at 1.2151, and the EUR/USD also maintained a foothold at the 1.0200 level before closing at 1.0202. Australia’s Retail Sales reading in June missed market projections at 0.2%, but AUD/USD nonetheless reached 0.6993, edging towards 0.700.
Gold futures took advantage of a weakened greenback and sluggish bond yields and climbed to $1,719.1, currently trading at $1,743.0 an ounce. US crude oil inventories further went down by 4.523 million barrels, and since Russia reduced gas supplies to Europe, WTI oil futures increased $3 to $98.17 a barrel.
More information on Mitrade website.

BTCUSDTAccording to the previous analysis, Bitcoin is pulling back to the midline of the ascending channel in the range of 21500 to 21700 after breaking its main support areas, and on the other hand, it is facing the middle resistances of the fork and the 1-hour trend line, and since it has been able to more than from 50% of the previous rising wave, it is more likely to continue the downward trend to the bottom of the channel around the psychological range of 20000, which is symmetrical with the main middle line of the fork, but considering the return from the 0.618 Fibonacci level, if it crosses the 21700 resistance range Its main level is 23,000, and upon its failure, the confirmation of the start of the upward rally up to the range of 28,400 is issued.
Today, the main economic data is the announcement of the interest rate increase for the fifth time in 2022, which increases or decreases the rate 8 times a year.
According to most experts, this rate increase will be 0.75% and will bring the interest rate to 2.5%, and as it is clear in the interest rate graph, 2.5 is the interest rate ceiling in 2019, but if the Federal Reserve Like the European Union, there is a surprise on the way and it increases the interest rate by 1%, this resistance has been broken and it can grow up to the previous ceiling of 5% that happened in 2006-2007 (that is, technically at this level? 😁)
On the other hand, yesterday's economic data, which was the index of consumer confidence and the sale of newly built houses, was significantly lower than the previous period and the expectations of experts (it should be noted that Mr. Biden, who these days has improved the good behavior of the locksmith 😜), it was announced that this data shows a decrease There is a strong demand in the market, and this can be the factor influencing the further increase of the interest rate by the Federal Reserve, because the main determining factors in the American economy are data, not leadership and oversight, and the Federal Reserve and the government operate independently.
With these words, in general, it is more likely that the market will continue to fall, although we are in the most difficult market conditions and new data can affect the market conditions at any moment.

$BTC 👀 – 07/27/2022 #WaveRecount$BTC 👀 – 07/27/2022 #WaveRecount - 📸 🚨
📌 Let me first say, #ElliotWaveTheory wave counting is #subjective. When rules are invalidated by price action, you simply pick yourself up, brush yourself off, and you revise the wave count (recount) accordingly.
📌In this case, upon release of the #Feds decision to #hike the interest rates by another 0.75 #percentage #points. The #DXY (US Dollar Currency Index) , plummeted meanwhile #stocks #indexes #cryptocurrencies rallied.
⚠️ For $BTC specifically, I am subjectively considering the overall corrective wave B (in black) finished; as the break-and-close above $22,264.81, represents a #BreakOfStructure and invalidates the idea of an extended corrective wave c (in blue).
📌 We are now currently working on corrective wave C (in black), which is #bullish impulse wave of 5 swings. Therefore, I recounted the waves and relabeled them accordingly (see the updated screenshot).
🎯 As we are already in Impulse Wave i (in blue), we could enter ('Buy Positions') on the completion of corrective wave ii (in blue) after either 3-7-11 swings down.
✅ If you thought this was helpful or insightful: Follow, Like, or Share ✌🏾 #PublicCommunity
📈 View My Chart:
⚠️ This is not investment or financial advice; Anytime you enter the #markets, you fully accept the #implications at your own risk❗️
#longterm #learning #makingmoneymoves #invest #strength #buildandgrow #breakingnews #crypto #cryptowinter #ElliottWave #FedReserve #StrongDollar #FOMC

FED. Federal Reserve raises interest rates by 75bps REAKING: The Federal Reserve raises interest rates by 75bps - that’s two back-to-back, largest since Volcker
#fed #FederalReserve #interestrates #rates #jeromepowell #powell #75bps #spx #spy #qqq #tipos #tipodeinteres

XAUUSD - KOG REPORT - FOMC!KOG Report FOMC:
This is our view for FOMC today, please do your own research and analysis to make an informed decision on the markets. It is not recommended you try to trade the event if you have less than 6 months trading experience and have a trusted risk strategy in place. The markets are extremely volatile and can cause aggressive swings in price.
Gold is at a crucial price point at the moment just before a big federal statement release. After the move we’ve had to the downside, we would expect Gold to want to attempt some form of recovery, to at least the 1800 price region. However, as you can see, the institutional selling isn’t giving bulls an opportunity to cover any positions that are being held above. We witnessed a bullish weekly candle last week, but it’s still weak and lacks volume. It was a failed attempt to recover, which entails caution for this FOMC and the days ahead until the end of the month. We published a KOG Report last week showing the liquidity pool sitting below around the 1650-65 price zone; this is a potential target to swoop the lows before an attempt to test the voids above. For this reason, we will look at the extreme levels for FOMC and the days ahead, not being concerned about the immediate range and levels.
We already know the 1750 psychological level is going to try and be defended and have indications of a push up in price if that 1720 -16 level holds as support. We want to see if bears defend it by coming in and taking this down into the liquidity region breaking the yearly low! We can see MA’s grouped together on the hourly and now on the 4 hourly timeframes. We have a huge gap to the mean above on the daily, that either needs to be visited or the ranging price action will bring it down lower. We’re still in bearish mode here expecting a swing to the upside before then a break of this low to continue downwards so let’s set the scene for the potential move to come. As always, we’ll trade this with two scenarios in mind using the 4H extreme levels as a guide.
Scenario 1:
They push the price up towards 1750 or potentially slightly above or below, we see resistance there and a clear rejection in price. This is the first level we feel that will represent an opportunity to short the market down into the 1720, 1710, 1695 and below that 1675 levels. These levels below 1675, especially that 1665-40 region is where we want to see exhaustion in price to then look to take this back up towards the 1750 price point as the first target.
Scenario 2:
They push the price down into the lower support levels of 1690-80, this is where we want to see the first level of support, based on strong support we feel this level would represent an opportunity to then long the market back up towards the 1720, 1735 and above that 1750 price points. As we said above, there is a huge chance they will try to break that level to the downside so expect a swoop into that liquidity pool below. The ideal long is more likely going to be from there and that’s our preferred region at the moment.
Because it is FOMC we’re focusing on the extreme levels, we’re not interested in trying to capture quick pips in a volatile market against the volume driven candles. If the plan works out it works out, if it doesn’t, we’re happy to sit tight and let Excalibur guide us intra-day through the markets.
Please do support us by hitting the like button, leaving a comment, and giving us a follow. We’ve been doing this for a long time now providing traders with in-depth free analysis on Gold, so your likes and comments are very much appreciated.
As always, trade safe.
KOG
