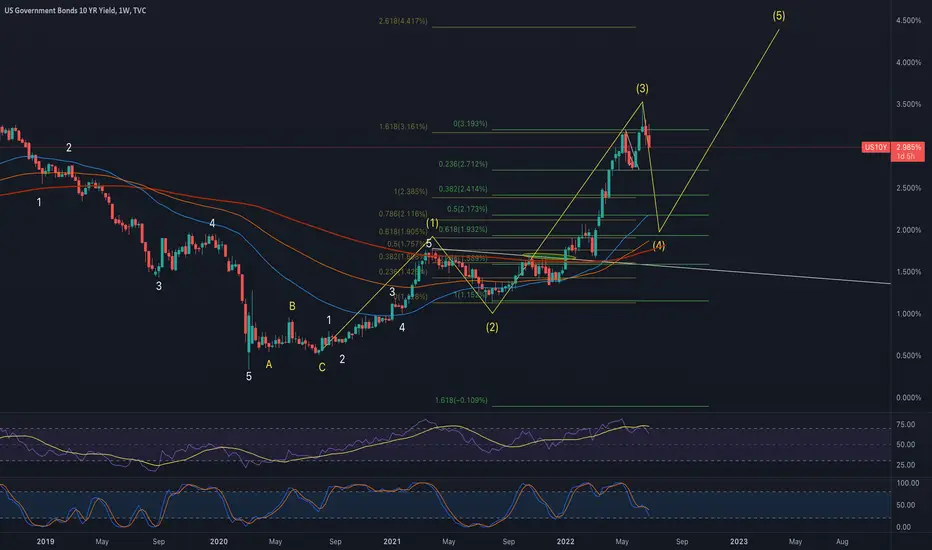
US 10-year rate. Elliott wave possibilitiesThe US 10-year yield has pulled back from 3.50% to 2.75%, which is a sizeable drop by any stretch of imagination. The Fed has clearly said its current focus is on price stability and with yesterday's employment numbers, there is still little reason to believe that fears of a so-called slowdown, or even worse - a recession, are showing up in high frequency data that the central bank is using, atleast for now (or they have the data, but because of political pressures, continue to focus on containing inflation).
The vertical drop in commodities has been puzzling no doubt; in fact the descent has been so quick that most people are aligning towards the fact that Fed forward guidance of more hikes (it remains to be seen whether existing measures of tightening policy are having the desired effect) are showing signs of demand destruction. I think for the Fed to acknowledge that a recession is a bigger worry than growth (at a certain point of time in the future), they would like to see a consistently southward CPI print which shows credible signs of not being sticky on the downside. For now, I believe they are simply taking back all that they made available in terms of additional QE to pull the world economy out of the Covid led crash.
Tactically, the visit to 2.75% was fleeting -- that was a key support level, so the market comfortably vaulted past 3% on employment gains that were more than expected. These moves have now resulted in the market dangling at a critical juncture which I will try to address via the three best Elliott wave counts I have conjured up (the right to be wrong is exclusively mine, and so is the right to adapt quickly to what the market might be doing regardless of what I think it should do) given the presently available evidence. All three counts start from the July 2021 lows -- the count from the 2020 crash lows of 0.34% has not been used for the sake of this analysis (which suggests the bull market in yields has much longer and higher to go) but that's a separate discussion altogether.
Primary Count: Long term trend in yields higher and is very much intact, but more sideways churn is expected within a RUNNING TRIANGLE before a surge:
Requirement: 2.75% must hold for this to be valid labelling
Alternate count #1: Long term higher, but one dip below 2.75% is needed to meet the minimum requirements for w((4)) to end
Requirement: One more dip before a larger degree 5th wave targets 3.50% and higher; 2.75% can be broken or at the least, retested
Link:
Alternate count # 2: More aggressive count that suggests higher immediately, longer-term higher yields play
Requirement: 2.75% cannot be broken from here, not even by a tick as per the rules of the wave principle for an impulse
Link:
Conclusion: Regardless of which wave count is in play - we will know that as we have more information appearing from the right of the chart, the impulse up in yields is anything but done. Perhaps, inflation will remain sticky longer than the consensus view is.
-- Guest Contributor at the @CMTAssociation
Federalreserve

XAUUSD - KOG REPORT - NFP!KOG Report NFP:
This is our view for NFP today, please do your own research and analysis to make an informed decision on the markets. It is not recommended you try to trade the event if you have less than 6 months trading experience and have a trusted risk strategy in place. The markets are extremely volatile and can cause aggressive swings in price.
After the bearish pressure we’ve seen on Gold this week we’re not seeing the price range tight and start to accumulate orders in this range. We can see the price needing to go up but being supressed so we suggest caution with this NFP. The levels above are limited if there is to be more downside on this but shorting the market here isn’t a great idea! We’re in the same level as the previous short squeeze which has been used to propel the price in either direction. For that reason we would say wait out the NFP move, don’t get involved in trying to trade it unless you see the extreme levels targeted. They will take the price to where they want to buy or sell, so control the FOMO and look for the extreme high or lows on the chart. We’re going to illustrate the immediate moves but we’re not likely to be trading this event.
Levels below:
1730-25 below that 1705
Levels above:
1745-55 above that 1775-80
Its a short on today, no scenarios as we've still got the FOMC report layout in play so please use that as reference if you need more clarification.
Hope this helps in preparation for NFP, we will update you as we go along as we usually do. Please do support us by hitting the like button, leaving a comment, and giving us a follow. We’ve been doing this for a long time now providing traders with in-depth free analysis on Gold, so your likes and comments are very much appreciated.
As always, trade safe.
KOG

GOLD Daily TA Cautiously BearishGOLD Daily cautiously bearish. Recommended ratio: 25% Gold, 75% Cash. *The Head and Shoulders formation is currently completing as the 50 MA crosses under the 200 MA (Death Cross). Gold, Oil, USD, Treasuries, Crypto and Equities are all either up or flat; this is indicative of a broader reversal in market sentiment regarding recessionary fears. Both Fed Governor Christopher Waller and St. Louis Fed President James Bullard said they expect a 75bps rate hike in July followed by at least 50bps in September and then potentially 25bps thereafter because financial markets and the economy are both responding to the rates hikes appropriately thus far; they also both suggested that recession fears are overblown, which prompted almost all markets to rally. Considering that the Fed largely operates off of lagging data, it would be prudent to assume that inflation may not have peaked quite yet; that said, it's advised to continue to be vigilant as the bottom continues to be found.* Price is currently completing a H&S breakdown and is testing $1742 minor support after also breaking down out of the uptrend line from April 2020 (~$1800). Volume remains Moderate (high) and is currently on track to favor buyers for a second consecutive session if it can close today's session in the green. Parabolic SAR flips bullish at $1800, this margin is mildly bullish. RSI is currently trending up at 28 while testing 27 support; the next resistance is the uptrend line from April 2013 at 36. Stochastic is currently resisting a test of max bottom as it crosses over bullish at 25. MACD broke down below -11 support and is currently trending down at -25 with no signs of trough formation; the next support is at -39. ADX is currently trending up at 21 as Price continues to break down, this is mildly bullish. If Price is able to bounce here at $1742 and continue up, it will likely test $1784 resistance . However, if Price continues to break down here then it will likely retest $1684 major support . Mental Stop Loss: (two consecutive closes above) $1748.

XAUUSD - KOG REPORT - FOMC!KOG Report FOMC:
This is our view for FOMC today, please do your own research and analysis to make an informed decision on the markets. It is not recommended you try to trade the event if you have less than 6 months trading experience and have a trusted risk strategy in place. The markets are extremely volatile and can cause aggressive swings in price.
What a great time we’re having on Gold at the moment with the moves playing out nearly to perfection into all our levels. We’ve done well on this and we’re not interested in giving anything back so we will wait for the levels shown to give us strong support or resistance before we attempt to take a trade, even then it will be with a small lot and a tight stop in place. Please don’t mess around with Gold when its like this, if you’re in the wrong way Gold can really cause you sleepless nights!
So, moving forward we’re going to trade this with two scenarios in mind, looking at only the highs and the lows of the present range.
Scenario 1:
We have a target below which is sitting around 1720, this is also the weekly support level so potentially this can be a short term stop on the selling pressure we’re witnessing. If price spikes into that level during FOMC or in the coming sessions we feel an opportunity to long the market exists. We’re not looking for huge captures, simply the 1775 and 1785 levels initially. After this, take partials, stop to entry and let it run. Breaking the level to the downside and you can see what's next!!
Scenario 2:
They push the price up, the first level we’re looking for is 1775 and above that 1785-90. If we see resistance there we feel an opportunity to short the market back down in to the 1750 and below that 1735 and 1720 levels could be on the cards. Breaking above the 1795 level and holding above it then its likely we will see this go a little higher before then attempting to come back down
It’s a dangerous market to trade and its not for the faint hearted. Please be sensible and don’t try to get rich quick, it won’t happen! Have a risk model in place and make sure your lots sizes are in accordance with your account size.
Hope this helps in preparation for FOMC, we will update you as we go along as we usually do. Please do support us by hitting the like button, leaving a comment, and giving us a follow. We’ve been doing this for a long time now providing traders with in-depth free analysis on Gold, so your likes and comments are very much appreciated.
As always, trade safe.
KOG

Nasdaq-100 May Have Signs of a Bullish TurnA painful half is finished for the Nasdaq-100. Now there could be signs of a turn.
The first pattern on today’s chart is the 11,069 level. NDX peaked in that area in July 2020 and bounced there 3-1/2 months later. The index returned to hold the same support in mid-June 2022.
Second, notice how prices held about 2.6 percent above that low in the past week. Could it be a higher low , after six miserable months of lower lows ? Some technicians may view that as a potential sign of the bearish trend fading.
Third, NDX probed below Friday’s low yesterday before rallying back above its high. That kind of outside candle is a potential bullish reversal pattern.
Next, this chart includes two of our custom scripts: Distance from MA and MA streak . Both are plotted using the 10-day simple moving average (SMA).
The line chart shows how last month’s low was the lowest versus the 10-day SMA since the nadir of the coronavirus crash in March 2020.
The histogram illustrates how the 10-day SMA has frequently shifted direction since that oversold condition. It could be another sign of the trend running its course and losing cohesion.
Earnings season is around the corner, bond yields are slipping and commodities are falling. Those macro changes could also be potentially favorable for the Nasdaq -- especially considering the pain caused by inflation earlier this year.
TradeStation has, for decades, advanced the trading industry, providing access to stocks, options, futures and cryptocurrencies. See our Overview for more.
Important Information
TradeStation Securities, Inc., TradeStation Crypto, Inc., and TradeStation Technologies, Inc. are each wholly owned subsidiaries of TradeStation Group, Inc., all operating, and providing products and services, under the TradeStation brand and trademark. You Can Trade, Inc. is also a wholly owned subsidiary of TradeStation Group, Inc., operating under its own brand and trademarks. TradeStation Crypto, Inc. offers to self-directed investors and traders cryptocurrency brokerage services. It is neither licensed with the SEC or the CFTC nor is it a Member of NFA. When applying for, or purchasing, accounts, subscriptions, products, and services, it is important that you know which company you will be dealing with. Please click here for further important information explaining what this means.
This content is for informational and educational purposes only. This is not a recommendation regarding any investment or investment strategy. Any opinions expressed herein are those of the author and do not represent the views or opinions of TradeStation or any of its affiliates.
Investing involves risks. Past performance, whether actual or indicated by historical tests of strategies, is no guarantee of future performance or success. There is a possibility that you may sustain a loss equal to or greater than your entire investment regardless of which asset class you trade (equities, options, futures, or digital assets); therefore, you should not invest or risk money that you cannot afford to lose. Before trading any asset class, first read the relevant risk disclosure statements on the Important Documents page, found here: www.tradestation.com .

UPDATE: MEDIUM TERM OUTLOOK ON THE DOLLARWhat's up trading world! Hope you have been well & taking care of yourself in these uncertain economic times! I am back with another DOLLAR INDEX update, now I did say I would update at the end of June however, with 1st July being a Friday, I wanted to observe how the market plays out so I could give a move comprehensive update!
UPDATE:
1. Bearing my previous post in mind, we saw the dollar shoot upwards and this was due to the biggest interest rate hike by the Fed since 1994. Monkeypox cases have also remained small in number which has only boosted the dollar even more.
2. As a result of the above, we saw pattern ABC play out in June (see previous post) where point 'B' illustrated opportunities for optimal buy-entries and these signals were shared with my private community and we were able to have a lovely 1:4 risk-reward trade (+420pips) that smashed through relevant targets!
MOVING FORWARD:
1. The dollar doesn't plan on slowing down anytime soon, we will definitely be expecting a rate hike again in July, it is the only way to crumb the inflation and do a hard reset on the debt the US has accumulated.
2. Barring covid & monkeypox cases remaining below 10K per/day, the dollar will continue to soar as commodities continue their much-needed reset.
3. Unemployment (NFP) numbers coming this week will also be a key indicator and although we expect it to be higher than last month, should there be a drop, I don't believe the drop will be extensive enough to stop the dollar's rally.
Technical analysis:
1. For optimal BUY-entry opportunities moving forward, wait for pattern ABC to play out, with point-B signalling entry point for buy-trades however, given the strength of the dollar, it might not even retest our daily support but rather continue going up due to strong fundamentals & key institutional traders trade-positions that are pushing the market right now.
2. Whether there is a RETEST or not of our daily-support zone, should the above 'moving forward' conditions happen, expect the DOLLAR index to make its way to $108, a price level it hasn't reached in almost 20 years!!
Thanks for reading! Let's take advantage of the markets together! These are generational wealth times that we are living in, don't let them pass you by! :))

Has Gasoline Price Already Peaked?NYMEX:RB1!
While the U.S. stock market performed miserably lately, energy commodities have a banner year. According to the American Automobile Association (AAA), the national average gasoline price reached an all-time high of $5.016 a gallon on June 14th. Diesel logged its own record on June 19th, at $5.816 a gallon.
Crude oil price hike is certainly a major contributing factor. However, refined products have been rising a lot faster. AAA gasoline was at record high $4.114 in July 2008 when WTI crude oil made history at $147 a barrel. Last month, WTI peaked at $123, at 16% below the 2008 high. However, gasoline broke $5, a whopping 22% above its 2008 record.
Since mid-June, WTI lost steam and entered a downturn. It trades below $110 today. Meanwhile, gasoline price barely moved and still stands above $4.80 per AAA data.
In my view, the gasoline market has already peaked, and a downtrend would follow. RBOB gasoline wholesale price, currently at $3.68 a gallon, could fall 30% or more in the next year. I came to this assessment based on two key factors:
Firstly, refining margins could decrease significantly due to mean reversion.
Refinery is the process to turn crude oil into gasoline, diesel, heavy fuel oil and other petrochemical byproducts. Refining margin measures the revenue from selling refined products, subtracting the cost of crude oil and natural gas going into the process. Below is a simple formula:
Refining margin = revenue (94% of crude processed) - costs (crude oil + natural gas used)
Whereas refining revenue = 23% gasoline + 63% diesel oil + 8% heavy fuel oil
A barrel of 42-gallon crude oil is processed into 40 gallons of refined. For each barrel, you would get approximately 25 gallons of gasoline, 9 gallons of diesel, and 3 gallons of heavy fuel oil.
According to Polish oil refiner LOTOS Group, the latest daily model refining margin is $59.06 per barrel of crude oil. Before the Russia-Ukraine conflict, refining margin was below $10 in February. Margins were in single digits throughout 2021 and sometimes even turned negative.
Crack Spread is a “quick and dirty” way to measure profit margin of a U.S. refinery. To calculate the 3:2:1 crack spread for a Gulf Coast refinery that processes Louisiana Light Sweet (LLS) crude oil, add the spot price for two barrels of Gulf Coast conventional gasoline to the spot price for one barrel of Gulf Coast ultra-low sulfur diesel. Then subtract the spot price for three barrels of LLS crude oil. Finally, divide the result by 3 to produce a crack spread in dollars per barrel.
Once the summer driving season is over, I expect crack spread to go down due to a combination of market force (reduced demand) and political pressure.
Secondly, gasoline demand could decline significantly in a U.S. economic recession.
In the past 15 years, gasoline market has crashed three times. The first was in 2008, following the subprime crisis. The second time in 2014, driven by a 60% crude oil price fall. The latest was in March 2020 when COVID-19 broke out in the U.S., leading most states to travel restrictions, lock-down or social distancing.
Today, a Federal Reserve tracker suggests that the U.S. has already entered a recession. The Atlanta Fed’s GDPNow, which tracks economic data in real time, sees second-quarter GDP contracting by 1%. Coupled with the first-quarter’s 1.6% decline, two consecutive quarters of negative GDP fits the technical definition of a recession.
Gasoline market is very sensitive to changes in consumer spending. Automobile driving, which shows clear “seasonal patterns”, is the dominant demand factor. In my view, this is the defining price driver in RBOB. For viewers who read my previous writings, you would understand why I prefer RBOB over WTI in forming a trading strategy – it’s more straight-forward with fewer moving parts.
A short position in NYMEX RBOB Gasoline Futures (RB) is a way to express this bearish view. The January (RBF3) contract is quoted at $2.779 on July 1st. RBOB futures is based on wholesale gasoline price. We could add $1 to RBF3 to get to a ballpark estimate of retail price in January. For the month after the Christmas holiday seasons, $3.80 a gallon seems to be overpriced.
RBOB futures is quoted at USD per gallon. Each contract has a notional value of 42,000 gallons (1,000 barrels), equivalent to $116,760 in current market value. To place an order, $8,500 margin is required per contract. A move of 1 cent in gas price will result in $420 gain or loss to your account.
Alternatively, if you are uncertain of which direction gasoline price would go, but agree that refining margin could revert to mean, we could Short the Crack Spread . A 3-2-1 short crack spread can be constructed by placing 3 Short WTI, 2 Long RB and 1 Long HO contracts.
We can also monitor the following data points to be released to test the validity of these two trade set-ups:
• Holiday driving data (July 4th, Labor Day, Thanksgiving and Christmas)
• Q2 and Q3 earnings releases from the retail sector (Walmart, Target, Dollar General, etc.)
• Q2 and Q3 GDP data
• Monthly CPI data
• Fed rate decisions (JUL 26-27, SEP 20-21, NOV 1-2, and DEC 13-14)
Russia-Ukraine conflict poses the biggest risk to our trade. If the contagion risk intensifies and ripples through Europe, energy prices could hike sharply again.
Happy Trading.
Disclaimers
*Trade ideas cited above are for illustration only, as an integral part of a case study to demonstrate the fundamental concepts in risk management under the market scenarios being discussed. They shall not be construed as investment recommendations or advice. Nor are they used to promote any specific products, or services.

Possible short on further fed funds hikes down to $5I expect more downside in miners if perceived hawkishness from the fed is maintained. Soon though, they'll cave and sacrifice the dollar to do what they think will save the markets, which will lead to an explosion in precious metals. These miners will be the ultimate levered trade on the coming fed pivot so be ready to reverse to long.

Dollar DXY Top happens May-June - Biden Policy CatalystDXY can run a bit higher, based on fib extension and candle patterns, this should find a catalyst to move it back down lower. This Dollar Long Mania is similar to the Gold fake-pump at the beginning of Russia-Ukraine conflict
WILMINGTON, Del. - President Joe Biden will draw a contrast between his economic plans and those of Republicans in remarks on Tuesday focused on inflation, a White House official said.
BATTERED U.S. STOCKS MAY NOT BE BARGAINS AS INVESTORS BRACE FOR INFLATION DATA
Biden, a Democrat who is suffering from low approval poll numbers ahead of the November midterm elections, has sharpened his rhetoric against Republicans in recent weeks, dismissing, for example, former President Donald Trump's "Make America Great Again" MAGA movement as extreme.
President Joe Biden will draw a contrast between his economic plans and those of Republicans in remarks on Tuesday focused on inflation, a White House official said. (Getty Images / Getty Images)
On Tuesday Biden will lay out his plan to fight inflation and "contrast his approach with Congressional Republicans' ultra-MAGA plan to raise taxes on 75 million American families and threaten to sunset programs like Social Security, Medicare, and Medicaid," the official said.
GET FOX BUSINESS ON THE GO BY CLICKING HERE
Last week Biden took aim at Republican U.S. Senator Rick Scott's economic plan, saying it would raise taxes on 75 million Americans, most of whom make less than $100,000 a year. Scott, who said he planned to cut taxes, is leading Republican efforts to get Republicans elected to the Senate.

SPX Daily TA Cautiously BearishSPX Daily cautiously bearish. Recommended ratio: 20% SPX, 80% Cash. *Gold and treasuries are down, cryptos and equities are flat, USD and Oil futures are up; financial markets are still trying to price in a recession and it looks like there is still room left to fall on the Weekly chart for SPX. CPI report is due to be released on 07/13 and the next Fed funds rate hike (expected to be 75bps) is due on 07/27.* Price is attempting to avoid a retest of $3706 minor support after being rejected by the lower trendline of the descending channel from August 2021 (~$3950) and is currently trending up slightly at $3800. Volume is Low and currently on track to break a four session streak of seller dominance if it can close today's session in the green (if it closes today bullish but with Low volume this would be bearish). Parabolic SAR flips bearish at $3679, this margin is mildly bearish at the moment. RSI formed a trough at 41 and is currently trending up slightly at 42; the next resistance is at 53 and the next support at 38. Stochastic remains bearish and is currently forming a trough at 65, if it can break above 66 it would be a bullish crossover; the next resistance is at 76 and the next support at 48. MACD remains bullish and is currently trending up slightly at 67 as it is still attempting to defend -76 minor support; the next resistance is at -44. ADX is currently trending sideways at 23 as Price is currently resisting a move lower, this is neutral at the moment. If Price is able to bounce here it will likely retest the lower trendline of the descending channel from August 2021 at $3938 minor resistance . However, if Price continues lower here it will likely retest $3706 minor support before potentially heading lower to test $3508 minor support. Mental Stop Loss: (two consecutive closes above) $3900.

Euro slides as inflation jumpsThe euro is sharply lower on Friday and is currently trading just above the 1.04 line, down 0.76%.
Eurozone CPI for June was higher than expected, at 8.6% YoY. The estimate stood at 8.4% and inflation rose sharply from the May reading of 8.1%. This marked a record-high. There was better news from the core reading, which dropped marginally to 3.7% YoY, down from 3.8% in May. Investors have given the inflation data a thumbs-down today and sent the euro tumbling ahead of the weekend.
With inflation continuing to accelerate and the ECB revising downwards its growth forecast, the spectre of stagflation in the bloc remains very real. The ECB is no doubt dismayed that inflation was higher than expected, but it's unclear if the record-high CPI release will be enough to deliver a supersize 0.50% hike for its lift-off next month. At this week's ECB forum, ECB head Lagarde talked tough and downplayed concerns over a recession, but there are plenty of dark clouds hovering above the eurozone economy. High inflation, weak growth and the energy crisis with Russia mean that there is certainly good reason to be concerned about a significant downturn in the eurozone economy.
In the US, there are worrying signs that the economy is weakening. US Personal Spending fell to 0.3%, down from 0.6% (0.4% exp.). Inflation appears to be declining slowly and the labour market is in solid shape. CME's FedWatch is putting the likelihood of a supersize 0.75% rate increase at 75%, as markets expect the Fed to remain aggressive against inflation. Can a recession be avoided? Fed Chair Powell is saying all the right things in downplaying concerns about the "R" word, but many market participants have their doubts and feel that the US economy will not be able to avoid a recession.
.

Have Treasury Yields Peaked?Soaring inflation and bond yields have hammered sentiment all year. But now there could be signs of yields peaking.
A few patterns appear on this chart of the 10-year Treasury yield. First is the October 2018 high of 3.248 percent. TNX jumped above that level for six sessions before rolling over. It tried it again on June 28, but failed. That lower high may confirm long-term resistance remains in effect.
Second is the rising trendline along the lows of March and May. The yield closed below that pattern yesterday. Has the trend broken?
Third, MACD made a lower high in mid-June as TNX made a higher high. That kind of divergence is a potential reversal pattern.
We’ve also seen widening losses in most non-oil commodities: copper, wheat, iron ore -- even natural gas. While inflation remains an issue, those declines could help lower yields.
Finally, it’s noteworthy that the 30-year Treasury yield never even broke its 2018 high. That may also suggest that long-term inflation worries haven’t gotten completely out of control.
TradeStation has, for decades, advanced the trading industry, providing access to stocks, options, futures and cryptocurrencies. See our Overview for more.
Important Information
TradeStation Securities, Inc., TradeStation Crypto, Inc., and TradeStation Technologies, Inc. are each wholly owned subsidiaries of TradeStation Group, Inc., all operating, and providing products and services, under the TradeStation brand and trademark. You Can Trade, Inc. is also a wholly owned subsidiary of TradeStation Group, Inc., operating under its own brand and trademarks. TradeStation Crypto, Inc. offers to self-directed investors and traders cryptocurrency brokerage services. It is neither licensed with the SEC or the CFTC nor is it a Member of NFA. When applying for, or purchasing, accounts, subscriptions, products, and services, it is important that you know which company you will be dealing with. Please click here for further important information explaining what this means.
This content is for informational and educational purposes only. This is not a recommendation regarding any investment or investment strategy. Any opinions expressed herein are those of the author and do not represent the views or opinions of TradeStation or any of its affiliates.
Investing involves risks. Past performance, whether actual or indicated by historical tests of strategies, is no guarantee of future performance or success. There is a possibility that you may sustain a loss equal to or greater than your entire investment regardless of which asset class you trade (equities, options, futures, or digital assets); therefore, you should not invest or risk money that you cannot afford to lose. Before trading any asset class, first read the relevant risk disclosure statements on the Important Documents page, found here: www.tradestation.com .

US500/SPX enters into a bear market The last time this happened was in 2018 but the market some how management to rally which resulted in a false breakout.
In 2020 the market came back to this level and spiked around this area before turning into an almost 2 year rally.
2007 was a different story as market broke structure and the result was a sell of that lasted one year.
What will happen in 2022? Will the bulls take control and result in the SPX hitting another all time high.
Or will we see similar events of what happened in 2007 which resulted in a huge sell off that one year.

10 yr My W4 on weekly HTF chart is looking likely. If the Fed & ECB are in the debt market trying to stabilize the system via repo swaps then this dump is going to be a normalization process and the markets will chop around in some f**ked up range until W4 is complete around 1.9%-2.2% during this normalization period bullish momo will fizzle out and bears will short all pumps and win , but the greedy bears will get squeezed as all big dumps in markets will get bought up quick and change the direction b4 most traders know what even happened. I suggest only buying your core positions until w4 is finally done projected to finish July-Sept 2022. This would be a good move for the patient investors here to hold and add because once the W4 finishes and markets stabilize (if the fed pivots like I am saying above) W5 will line up on the 10 yr with W5 for stocks & crypto. Conversely If W4 becomes a fear trade (inflation narrative grows momo, war in Ukraine gets worst possibly nuclear war, china invades Taiwan or anything else unforeseeable) then W4 will decimate markets and 3200 SP500 is possible and $12K BTC.
US Inflation is Nearing a Harmonic PeakIf we are to base our views of this chart like we would any other price chart, the harmonics we see forming here would imply that US Inflation is reaching a peak and that we will see Inflation come down signfiicantly over the the coming years. If i were to give a target i'd say we'd wanna see it come down to atlest 3% as a first target but it could go down even more depending on how tight things get.
The smaller harmonic is a Bearish Butterfly with a reversal zone between the 1.272 and 1.618 and the bigger one if we get that high is a Bearish Shark. Ideally we'd like to see the Butterfly playout and us not to have to go as high as the Shark.

Comparison of German and US month over month inflation rates.Comparison of German and US month over month inflation rates. Germany's data came out ahead of our PCE number tomorrow so looking for correlations here.

BOJ reaffirms policy, yen at 136The Japanese yen is one of those currencies that keeps investors on its toes, and it has certainly lived up to its billing in recent weeks. USD/JPY has shot up 5.79% in the month of June and is back above the 136.00 line. BoJ Core CPI, the central bank's preferred inflation gauge, ticked upwards to 1.5% in May, up from 1.4% prior and matching the forecast.
There is no mystery behind the yen's sharp depreciation of some 17% in 2022. The currency has been at the mercy of the US/Japan rate differential, which has continued to widen. The Federal Reserve is in the midst of an aggressive rate-tightening cycle, with the Fed delivering a massive 0.75% increase at its last meeting. The Bank of Japan continues to take an opposite approach, that of an ultra-accommodative policy. The BoJ has maintained this stance at a time when other central banks are tightening, in order to boost the fragile Japanese economy. While other major economies are struggling with surging inflation, Japan's inflation is around 2% - quite low but nonetheless on the rise after some 15 years of deflation.
Governor Kuroda reiterated on Wednesday that the BoJ would maintain an accommodative policy, insisting that the increase was mostly a result of higher energy prices. Kuroda has said in the past that the present bout of inflation is temporary and that the BoJ would not change policy until inflation was anchored by higher domestic demand and an acceleration in wage growth. With neither of those criteria likely to occur anytime soon, we can expect the BoJ to continue to tenaciously defend its yield curve control and do little more than jawbone about the exchange rate. This does not bode well for the yen, which could continue its sharp slide and fall below the 140.00 line.
USD/JPY faces resistance at 1.3654 and 1.3785
There is support at 1.3540 and 1.3409

My plan for deploying cash over the next six monthsNTSX is an ETF that holds 60% S&P 500, 40% leveraged bonds. This is a highly efficient portfolio composition known as "return stacking" (recently popularized on Twitter by Corey M. Hoffstein). You get the best of several worlds: the lower volatility of the 60-40 portfolio, and the higher returns offered by leverage. Since leverage is used on the relatively safer part of the portfolio (bonds rather than stocks), it doesn't add too much extra risk.
Stocks and bonds have sold off together over the last several months, creating a rare situation where there's been a large drawdown in 60-40 portfolios and in NTSX. I think there's an opportunity shaping up, but the hard part is going to be timing it. I've been sitting on a fair bit of cash for several months (you may have noticed I haven't posted much!) and am debating when to deploy it. It's likely still too early, but I think we're nearing good levels at which to deploy anywhere from a quarter to a third of it, and NTSX is a good vehicle for that. I'll likely hang onto the remainder of my cash till October.
Macroeconomic Considerations
Rates are soaring, and there's no question that will be a bit of a drag on growth. But it's offset by a strengthening dollar. The US is hiking rates faster than other developed markets, which has the dollar index soaring. A strong dollar is generally very good for US stocks. In fact, stocks usually rise as interest rates do, and it's only at the end of a rate hike cycle that we tend to see a recession.
There's probably a recession coming in the next couple years, but we're not there yet. Several parts of the yield curve recently inverted, which usually signals a recession in the next 18 months. You might think that means it's time to get defensive, but stocks often go up quite a bit after yield curve inversion and before the recession hits. (Plus, this yield curve signal has been a bit wonky, because parts of the curve are steepening while others flatten. So it's hard to know how to interpret this recent inversion.)
For the last several weeks, the Leading Economic Indicators index and the ECRI Weekly Leading Index have been steadily improving, a good sign for near-term growth. Meanwhile, commodities prices have weakened somewhat, with the GSG broad commodities ETF breaking its uptrend:
It's possible we could even see some disinflation, which would obviate the need for the Fed to get so aggressive.
There are certainly headwinds: China lockdowns, war in Ukraine, and rising US Covid cases. These headwinds need to be taken seriously. But there's also the possibility that any of these situations could suddenly improve at any time, especially if certain policymakers in Asia come to their senses. So I think it's worth having some exposure here.
Policy Considerations
So with the macro picture looking not too bad, why would I hold onto 2/3 of my cash? Because the Fed is about to start selling assets in May, including treasury and mortgage bonds. And when one of the biggest holders of assets starts selling, you probably don't want to be exposed.
Now, the market has been front-running this move for the last several months, and bonds have already have gotten a lot cheaper. It's quite possible that a lot of it is already priced in, and that we could see some counter-trend asset buying that will offset selling by the Fed. The market is also pricing in really aggressive Fed rate hikes, with a 50 basis point hike at the May meeting and 75 basis points in June. That expectation may prove to be too hawkish. The Fed's own dot-plot projections imply a somewhat slower hiking cycle than the market rate does:
www.cmegroup.com
Any dovish surprise from the Fed might cause bond prices to pop.
But I still think you want to play it somewhat conservatively here. The ten-year yield is still much too low for this level of inflation, so on balance, there's probably more downside than upside ahead for bonds.
Seasonality Considerations
Usually, May inaugurates the bullish season for stocks. But this is a mid-term election year, and mid-term election years are usually bearish from May to October. This may be an especially bearish year, because we're likely to hear a lot of talk tough from candidates about how they're going to stop inflation.
The chart shows one possible scenario for how NTSX might move between now and October. I'm envisioning mostly sideways price action through July-August, followed by a summer selloff as we approach the election. If I'm right, then NTSX might even complete a full round-trip to pre-pandemic February 2020 levels by the end of the year. If this scenario does play out, then I'd probably deploy the rest of my cash around October.
That might be the bottom, with the rate hike cycle mostly complete. Or it might be the beginning of a recession, as rate hikes cause the economy to blow up. But if it does turn out to be the start of a recession, NTSX won't be too bad a place to hide out. Stocks will go down in a recession, but bonds will likely go up as the Fed lowers rates to stabilize the market. That's part of what makes NTSX such an attractive vehicle.

Case-ShillerYOY% and BTCUSD are Correlated = Danger for BTCUSDThis bodes ill for BTCUSD at a time when housing prices and rent are a national policy priority

GOLD Daily TA Cautiously BearishGOLD Daily cautiously bearish. Recommended ratio: 10% Gold, 90% Cash. **H&S WATCH. DEATH CROSS WATCH.** *USD is down a bit while energy, commodities, equities, cryptos are up and gold is relatively flat. The relief rally is primarily benefiting risk on markets as money begins to enter it from risk off markets (like gold and bonds); this is still just a technical relief rally that was precipitated by very oversold daily and weekly conditions, the Core PCE report due next Thursday (06/30) should give a clearer picture of what the Fed will do on 07/27/22 and therefore guide the markets in the near term.* Price is currently completing a H&S pattern and trending down at $1827 as it prepares to formally retest the uptrend line from April 2020 (~$1815) as support for the second time since 06/15/22. The 50 MA is currently trending down at $1860 as it quickly approaches the 200 MA at $1845 where it would technically form a Death Cross. Volume remains Moderate (high) and fairly balanced between buyers and sellers (which is indicative of consolidation before a next move). Parabolic SAR flips bullish at the 50 MA ($1860), this margin is neutral at the moment. RSI is currently trending up at 45 after bouncing off of 42 support for the third time in a month, the next resistance is at 67.24. Stochastic remains bearish and is currently beginning to form a trough at 43 as it is still technically testing 53.13 support. MACD is currently crossing over bearish at -8 as it hovers above -10.84 support. ADX is currently trending down at 10 (with little sign of trough formation) as Price is trending down as well, this is neutral at the moment; if ADX was to bottom and begin trending up as Price continued down this would be bearish. If Price is able to bounce here and resist a H&S AND Death Cross then it will likely retest the 200 MA at ~$1840 before potentially retesting $1867 minor resistance. However, if Price continues down here, it will likely formally retest the uptrend line from April 2020 at $1815 as support before potentially falling to retest the largest supply/demand zone on the chart at $1783 support. Mental Stop Loss: (two consecutive closes above) $1844.

GOLD Daily TA Cautiously BearishGOLD Daily cautiously bearish. Recommended ratio: 30% GOLD, 70% Cash. *H&S Formation Watch. In anticipation of a critical FOMC statement to be released tomorrow at 2pm (deciding on whether or not to raise FFR by 75-100bp to more aggressively combat inflation), the US dollar and treasuries are once again stealing the bullish spotlight as cryptos and equities remain relatively flat and Gold is taking a tumble.* Price is currently retesting the lower trendline of the ascending channel from April 2020 at ~$1810 after testing it back on 05/13/22 and failing to climb even halfway back up the channel; this is bearish. Additionally, Price has completed a second shoulder formation in the H&S and could see a short term bounce here before completing a potential H&S sell off. Volume remains Moderate (high) and is currently on track to favor sellers in a second consecutive session if it can close today's session in the red. Parabolic SAR flips bullish at ~$1880 (which coincides with the 50 MA); this margin is neutral at the moment. RSI is beginning to form a trough at 38 as it fast approaches a test of the uptrend line from April 2013 at ~37; if it breaks below this level, the next support is at 27.07 which hints that Price will have a bit of room to fall in a short amount of time. Stochastic remains bearish and is currently trending down at 33 as it approaches a test of 25.40 support. MACD is currently crossing over bearish at -9.60 which is just above -10.84 resistance (though it crossed above this level it still has not confirmed it as support). ADX is currently trending down slightly at 13 as Price is beginning to develop downward momentum; if ADX can begin trough formation here as Price continues to fall, this would be bearish. If Price is able to defend support at the lower trendline of the ascending channel from April 2020 at ~$1810, it will likely aim to retest the 50 MA at ~$1840 before either a) potentially moving higher or b) completing a H&S formation bull trap before plummeting lower. However, if Price breaks down here then it will likely formally retest $1783 support for the first time since 01/28/22. Mental Stop Loss: (two consecutive closes above) $1840.

Recession fears rekindle greenback appealEUR/USD 🔽
GBP/USD 🔽
AUD/USD 🔽
USD/CAD 🔼
XAU 🔽
WTI 🔽
Yesterday (23 June), as Federal Reserve Chair Jerome Powell said his team is "acutely aware that high inflation imposes significant hardship". Meanwhile, he also acknowledges "our actions affect communities, families, and businesses across the country" - admitting their monetary decisions could bring the economy to a recession.
As a result, investors flocked to the US dollar to get shelter from possible economic turbulences. EUR/USD fell from 1.0575 to 1.0494, then closed at 1.0523. Germany's Manufacturing PMI in June underperformed with a 52.0 reading against a 54.0 forecast.
The latest PMI figures for the UK were a mixed bag of results, while the Composite and Services PMI were slightly better than market projections, Manufacturing PMI fell short of expectations at 53.4. GBP/USD recovered from 1.2170 to a closing price of 1.2261. Later tonight, the UK Retail Sales will be available.
The AUD/USD pair dropped 28 pips to 0.6899, and USD/CAD closed at 1.2994, while just retreating from 1.3013 today. The results of yesterday's Federal Reserve annual bank stress test show banks continue to have strong capital levels, maintaining their lending capacity.
Gold futures briefly went to 1,846.6 a troy ounce then cooled off to close at 1,829.8. Oil prices experienced minor fluctuations, finally closing with a loss at 104.27 a barrel.
More information on Mitrade website.

MEDIUM TERM OUTLOOK ON THE DOLLARFor the longest time, I have been debating whether or not to begin posting my trading sentiments since the trading community I look after & am a part of is a very private one. That said. we are in unprecedented times, a lot of people do not know what is coming their way. nevermind how to protect themselves/ take advantage of relevant opportunities. So I have decided to help those who are looking to understand financial markets not only from a trading perspective but from an actual investing perspective. So as my first post, let's take a look at a currency that impacts the rest of the global & emerging market currencies & that can help you plan your trading approach over the next 3 - 6 months. But before we do that kindly understand the following:
As a former investment bank trading analyst. There is absolutely noway you can incorporate technical analysis without fundamental analysis. When I see retail traders/people just speak about technical analysis and understand nothing about fundamental dynamics & how it affects trading pairs/executions/decisions as a whole, not only do I laugh but it also makes me understand why there is truly only 5-10% of retail traders globally that are consistently profitable. But enough about that, let's get to the charts!
DOLLAR INDEX OUTLOOK:
Fundamental ( DOWNSIDE ): If another rate hike takes place & MONKEYPOX cases cross the 10K margin in the US &/or employment numbers (NFP) drop.
Technical ( DOWNSIDE ): Should the above fundamental case happen, trading opportunities can be taken advantage of through the WXY scenario, where X represents the entry-point.
Fundamental ( UPSIDE ): A rate hike & more stimulus money will see the dollar go up. Mid-term elections being favourable would also send the dollar much higher.
Technical (UPSIDE ): The above fundamentals taking place would allow scenario ABC to take effect with point B representing the optimal entry-point for relevant trades.
Let us see how it plays out, as for exact entry points and iterations to this post as time goes on, that will be given to members only. However, that said, I am willing to do analysis on different pairs/derivatives' on behalf of those who would appreciate an informed opinion on both the technical and fundamental sides.
At the end of the day I want to see traders progressing and doing much better but the truth is you need to understand the markets from a technical & fundamental perspective in order to truly be successful as a trader & ultimately become an active investor in financial markets. If all you have been doing at this point in time is trading only incorporating technical analysis then all you are/have been doing is donating money to the market, your broker/s and my former employers in the investment banking/hedge fun world. :)
Don't forget to like & comment, I look forward to beginning this new journey with all of you!! :)))
