Bear Market is Far from OverCME_MINI:ES1!
In the past six months, the S&P 500 has fallen from an all-time high of 4,818.62 to a fresh 52-week low of 3,636.82, down 1,181.8 points, or -24.5%.
Following a brutal week, the U.S. stock market rose on Tuesday, as investors weighed the Fed rate hikes amid rising fears of a recession. The Dow rose 2.15%. The S&P popped 2.45%, and the Nasdaq climbed 2.51% at market close. Has the stock market correction ended?
Let’s look at a 5-year chart. The previous peak of S&P 500 was 3,383 on February 10, 2020. It hit bottom on March 23 at 2,177, down 35.6%. Since then, the S&P has a great run for nearly two years, up 121%, with very little hiccup along the way. The new high was 40% above the pre-pandemic high.
After recent steep fall, the S&P is still 400 points above the pre-COVID peak, which, in my view, is our first support line. If recession fear materializes into a real one, the post-COVID dip will become the second support. I believe that the bear market is far from over.
My reasoning bogs down into two essential questions:
1. Will Government policies be effective in controlling the runaway inflation?
2. Will U.S. economic growth be sustainable at current high price level?
On March 16, the Fed raised interest rates by 25 basis points (bps). A second hike followed on May 4, for 50 bps. On June 15, a big 75-bps move upped the Fed Fund Rate to 1.50%-1.75%. Meanwhile, U.S. inflation continues to rise. In May, the official Consumer Price Index rose 8.6% year-over-year. The core CPI (all items less food and energy) was also at a record high of 6.0%.
While aggressive Fed tightening could reduce the excess money supply, it could not affect the record gas price, nor the supply chain bottleneck from China.
President Biden will try to convince the Saudis to increase oil production during his visit. However, we need to understand it is the best interest of OPEC to maximize oil revenue. High oil price is good for them as long as it does not cause demand to decline. Besides, if Biden can’t control his own bike, do you really expect him to get OPEC to fall in line behind us?
Removing the Trump era tariff could bring some relief to U.S. consumers. However, the extent of imported goods covered by tariff reductions remains unclear. From policy discussion to actual implementation, it would take months before we see price drops on store shelves.
In a nutshell, my answer is NO for the first question.
As to the second question, even if the Fed succeeds in bringing down the inflation, will the U.S economy sustain its growth momentum?
Take the $5 gas price for instance. For an average family with two cars, the consumption of 100 gallons a month is budgeted at $500, and it is $200 more than when gas was $3/gallon. Record gas price has already resulted in less driving and reduced trips to grocery stores and supermarkets.
A major impact of Fed rate hikes is higher mortgage payments for millions of homeowners. For a family with a $400,000 house and $300,000 mortgage, a 6.5%, 30-year-fixed loan will require $1,900 interest payment per month. This is $380 more than when the mortgage rate was 4.5%.
High energy and mortgage costs trickle down to every corner of American life. Even if inflation is tamed, at current price level, everything is too costly for the economy to function properly. We need to have deflation, starting with energy and housing, to avoid a recession.
With headwinds to the economy and massive overhang over the stock market, I’m not optimistic for the near-term U.S. economic outlook.
A short position in CME E-Mini S&P 500 futures is a way to express this bearish view. The December (ESZ2) contract may be a good one, considering both liquidity factor and time to allow major market-moving events to play out. At 3,788.00, each contract has a notional value of $189,400 ($50 times index value). CME requires an initial margin of $10,500. Futures contract is marked to market daily. For a short position, a decline of 1 index point will result in $50 gain in your account balance because of the $50 multiplier. Likewise, an increase of 1 index point means a $50 reduction in your account.
If you don’t want to deal with the daily profit and loss accounting, consider a Long Put Option on the same E-Mini S&P futures contract. For example, the out-of-the-money 3685-strike (100 points below market) is currently quoted at $9.00. To buy an option requires $450, again because of the contract multiplier of 50.
When is the good time to place the order? The next market rebound. Put premium generally gets cheaper following a price rise in the underlying futures.
Happy Trading.
Disclaimers
*Trade ideas cited above are for illustration only, as an integral part of a case study to demonstrate the fundamental concepts in risk management under the market scenarios being discussed. They shall not be construed as investment recommendations or advice. Nor are they used to promote any specific products, or services.
Federalreserve

BTC: Don't DCA YetMacro conditions couldn’t be any worse. Starting this month, the Fed unleashed its quantitative tightening (QT) plans, trimming the $9trillion balance sheet at an unprecedented scale (current run-off cap: $47.5bn/month initial; $95bn/month 3 month later; 2017 run-off: max $50bn/month). The last two quantitative tightening led to a sharp rise in yields in 2013 and a repo crisis in 2019 respectively. Unfortunately, this time around, the Fed has to deal with a much larger balance sheet and all-time high inflation rate since 1982. Without the ability to print real world supply of goods and services (factories, natural resources), the Fed has lever on the demand side, but lowering demand means hikes in unemployment (which the Fed is already targeting). With a 7% gap between short-term rate and inflation rate, can the Fed “just rise unemployment a little bit” without causing a recession? Extremely hard unless real world supply of goods and services picks up.
For us crypto traders and investors, the question is - isn’t bitcoin an inflation hedge, and if global market enters a recession, wouldn’t bitcoin be the risk-off asset of choice? My take on this is not in this cycle. Bitcoin has not experienced a proper traditional finance bear market yet and has performed poorly during past tapering and quantitative tightening environments. Different phases of quantitative easing, tapering, and quantitative tightening are marked on the chart above. After three rounds of quantitative easing from 2010, the start of tapering in 2014 marked the beginning of bitcoin’s 2-year bear market. In 2017, quantitative tightening started in October, and the 2018 crypto crash soon followed. In other words, bitcoin’s inflation hedge narrative hasn’t been officially tested or widely accepted. With arbitrage opportunities, scams, hack risks, and run-on-bank fear, the crypto market is no doubt in its early stage. While superior security and scarcity give bitcoin the potential to replace gold in a new era of currency, early-stage demand side volatility makes bitcoin subject to wild price swings. The current reality is we see rising correlation between bitcoin and the equity market year after year, and the volatility is further heightened by the derivative market. In the current cycle, bitcoin’s inflation hedge value is overpowered by its volatility, and it is hard for bitcoin to rally under gloomy global macro conditions before the market matures and stabilizes.
Do you agree? What’s your take on crypto under the current global macro? Support and comment below!

US30 Intra-Week Analysis June 21stLast week us30 created another new low coming down to retest 29600 which are pre-pandemic highs and key level for price. We ended the week within the 30200-28800 range and demand zone failing to breakout in either direction. This week we've already began breaking out above 30200 and coming up to test 30400 key level. Our overall bias is still bearish on us30 especially with the potential for a 75 BPS rate hike in July. Until those economic factors are priced in we can expect to see a push to 31k if we break above 30500 or even continued bearish momentum to 32600 if we break above 31k.

ETHUSD Daily TA Neutral BearishETH Daily neutral with a bearish bias. Recommended ratio: 35% ETH, 65% Cash. *Cryptos are enjoying a technical relief rally that is still ongoing even though Binance didn't buy $2b of Bitcoin this weekend, the bulls are saying bottom but I think it's a bit premature with JPow due to testify before Congress on Wednesday (06/22) and PMI due on Thursday (06/23).* Price is currently defending $1k and beginning to form a U-shaped bottom in attempt to reclaim support of the descending channel from October 2021 at ~$1300; because Price only briefly touched $889 and never formally tested $775 support, it may see a corrective bounce here before heading lower. Additionally, Price hasn't tested the uptrend line from February 2017 (currently at ~$360) since July 2020. Volume is Moderate and on track to favor sellers if it can close today's session in the red (making the spread fairly balanced over the past week, indicative of consolidation). Parabolic SAR flips bullish at $1231. RSI is currently trending sideways at 28 as it attempts to reclaim support of the uptrend line from 01/22/22 at 26.50. Stochastic remains bullish for a second consecutive session and is currently trending up at 30 as it is still technically testing 22.98 resistance. MACD is currently forming a trough and trending up slightly at -252 as it aims to break above -227 to cross over bullish; the next resistance is at -197.34. ADX is currently trending up slightly at 52 and is beginning to form a soft peak as Price is bouncing here; this is neutral at the moment but would be bullish if ADX began to trend down as Price continued up. If Price is able to continue up then it will likely test the lower trendline of the descending channel at ~$1300 as resistance. However, if Price breaks down here, it will likely test $775.83 support for the first time since breaking above it in January 2021. Mental Stop Loss: (two consecutive closes above) $1300.

BTC NEXT STATION 16770As we expeted in the Last Analyse BTC has reached 19
But according to the market cap decreasing and federal reserve Bank rate increasing
i will see bitcoin in 16k
Also weekly correction of 15k support line was not completed
It is not financial Advice ,be careful if what you choose to buy

Hedge for High Interest RatesHere is great high interest rate hedge. While I wanted to use USINTR to compare, it didn't look obvious for easy analysis, so I used USIRYY instead since both are greatly correlated. The Fed keeps talking like a dove but acting like a hawk: like promising soft landings from transitory inflation, yet suddenly choosing rare 75 bps increase, even though they previously implied 50 bps would be the most. So, I expect next few rate raisings will be at least that much, possibly a full point even during this summer. That would be great for this ETF going up, which is currently on sale, thanks to more direct & intense QT from the Federal Reserve.

Btc potential moveif btc close below 19k this weekend, i can sey the next week will be historical.
there are to supports waiting for the btc fist one is between 18k-16900 , and the second is between 13900 and 11800.
Not forgetting what is going on in the global economy, the Federal Reserve continues to raise interest rates, which will cause investors to sell their positions in riskier assets ( crypto , stocks) and lead to a significant drop in these markets.
These investors will prefer to put their money into bonds that the federal government will print at higher yields.
that is my personal opinion.

2022 - Not the Recession We Want, but the Recession We NeedIn response to the Federal Reserve increasing interest rates yet again, the markets - both in stocks and crypto (and housing soon to come) - have been dropping pretty hard lately. For crypto investors out there: this is the sound of mainstream money from the general public leaving the space - they came for the party, then left after the party was over. The craze that we saw in 20’-21’ was really the result of NFT projects targeting people - largely cooped up indoors due to the pandemic - with a hype-based marketing strategy that seemingly resonated very strongly.
Out of all the NFT projects that could have reached #1, it was the Bored Apes Yacht Club: it doesn’t take an art expert (although I do like to fancy myself as one at times) to see what BAYC’s success “means” - it’s obviously targeted at people who’s primary ethos is boredom…and exclusivity. In a way, BAYC is the perfect sign of the times - people bored of the lockdown, the rise of digital marketing and remote work, our reliance on artificial scarcity to determine “value”, and Web2 marketing/hype and investing practices all rolled into one. There’s a reason why even the Ethereum team (most visible Vitalik) renounced BAYC as something that ETH “wasn’t intended” to do. Adjective-Animal JPGs basically missed the point of why Web3 was created from the very beginning.
Now that the Feds are tightening up their money supply (finally, after having printed endless amounts of it during the last few years) the “casino” market is about to come to an end. But just because the market is in a downturn doesn’t automatically mean that everything will be bad…there are lots of opportunities still there; they just look different from what we’re used to seeing up until now. For some of us out there, we’ve been waiting for this moment for a very long time.
If you might have been thinking about changing or trying new things out in your life, now is probably the best time to do it because in a few months the world as we know it will probably get flipped on its head and most things will become unrecognizable anyway. During recessions people’s priorities tend to shift away from speculative assets and into savings; short-term investments into long-term; people shopping for interest rates on savings rather than loan accounts; and so on. Those who adapt will do well - but it will require a shift in mindset that may feel strange and unfamiliar. People say that “everyone” suffers during a recession but I tend to disagree - in any given market there are always winners and losers; money is game of how the idea of “value” compares itself to the price of goods around us. It is always relative to each other, in other words - and there are always ways to get ahead if you’re willing to look at the details close enough.
- The Market Itself is a Bubble
One thing to keep in mind that 80%+ of people don't own any stocks/crypto, so all the panic, hype, and emotional reactions you see in the media/social media is already a bubble of its own. Most people only see the prices of the things that they interact with every day - thing most people are seeing right now is that they see that inflation is cutting into their ability to survive day to day - and that something needs to be done. Until crypto products address these sorts of “bigger issues” of the public directly, it will always follow the general markets rather than setting the tone.
The reality is that most people in living in United States were already used to massive inflation - the costs of living was already on the rise since 12’ onward (especially in housing, education, and healthcare - typically the 3 biggest expenses for the average person out there) and people were already getting squeezed out every year anyway. In the upcoming months there will be a lot of people with lots of money complaining about how “hard” things are for them, but I don’t expect there will be any sympathy for them - in fact, they will probably be the target for the next ridicule cycle if anything, really.
What that means is that the economy was already hell for most people during the "good times" - inflation was already well out of control but we simply failed to acknowledge it. On a personal level, I lost more friends (especially artists) than I care to talk about: many were forced to move away from the places they loved because the costs of simply existing in certain areas became untenable. A lot of people I knew gave up on having kids, gave up on their dreams, went back living with their parents - worse case, some of them literally ended up on the streets simply because they were unable to pay their rent.
People who have known me long enough know that prior to getting into crypto I was heavily involved with housing politics through the YIMBY movement - though this downturn is hurting my portfolio too, it's hard for me to think that a market crash would be a bad thing long-term, because not only would it would lessen the pearl-clutching incentives/behaviors of NIMBYs, it should also bring down costs of everything as a whole. And that is good for everybody, not just the few who happen to be lucky enough to get their hands on a certain type of ERCs.
So while it may be unpleasant to see the numbers in your accounts go down, this is the correction that many have been waiting for - the correction that we need. Once the housing market stops going up, there’s less reason (and ability) for NIMBYs to defend their imaginary gains against the tides of supply and demand - and in the long run, the market should equalize itself to where it should be. What Web3 needs more of is people with a mindset of abundance rather than of scarcity - and this will become more important as the crypto ecosystem starts to mature.
Web3 is not only a movement of its own, but it’s also a repudiation of the bad habits of the Wall Street/Web2 model - which has, over time, become a ponzi scheme of its own. Low interest loans allowed startups, politicians, and scammers to “fundraise” their way out of trouble: No money to pay for things we need? No problem - just print more! Company not profitable? No problem - just raise your Series Z to keep it going just a little bit longer! Ponzi schemes do actually “work” on some level, after all - as long as the market keeps on going up.As we’ve seen with what happened with LUNA/3AC - which was entirely backed on the fantasy of Bitcoin going up forever and forever - there’s going to be a backlash against the stock market too, so that’s something to keep an eye out for. How did Bernie Madoff get away with what he did for over 20 years? The market was always going up. Now that the tide is pulling, we’ll get to see who was swimming naked underneath this whole time.
- It’s Time for the King (Bitcoin) to Serve its People
Bitcoin is obviously the first of its kind and currently the market leader in the crypto space as we speak - but for how long? While Ethereum is moving towards proof-of-stake as its primary economic engine (taking most of its tokens along with it), Bitcoin leaned hard into the proof-of-work + scarcity model in the last few years and never looked back. Given that the store-of-value idea is not unique to any coin - and that the only “value” Bitcoin currently provides is potential speculative gains (which are on its way out as staking rewards start to look more appealing during a recession) and a strange retro-nostalgia aesthetic for the pre-08’ eras (which will gradually fade over time), it’s hard to see it surviving for the long term. More broadly speaking, “it was there first” is exactly the type of NIMBY argument that the market will “correct” in the upcoming recession, taking down a multitude of asset classes that have been relying on that mentality up until this point. Ethereum is attempting to escape that fate through their “merge” (we’ll see if they’re successful in doing that this summer), but Bitcoin has basically signed the pact to go down with the ship. In a few months, it could potentially be the only proof-of-work system left on the charts, quite literally.
I’ve always found it odd that a lot of Bitcoin fans aren’t too shy about calling their coin of choice “King” - which is actually a fairly new phenomenon that came during the 16’-18’ run, not before. (The dev community was much purer back then.) This phrase clashes directly with their supposed support for decentralization and democratization of money - the cognitive dissonance there is massive, to say the least. (Since there is no on-chain governance in BTC systems a small group of miners usually end up controlling everything on the protocol level behind closed doors, btw.)
There’s something very disturbing about the glint you see in their eyes when they claim that Bitcoin holders (not anyone else, obviously) will become the most “powerful” people in the world in a few years - I don’t think anyone outside of that bubble really believes that - especially now. This is the year 2022 and we don’t really have the time to idolize or fantasize the absolute powers of monarchy, even in imaginary forms. Web3 will rely on the transparency of ledgers to establish partnerships of mutual benefit, enforced by precision and reliability of smart contracts - but this requires us to get better at collaboration, rather than moving unilaterally and monopolistically, as Web2 has typically done.
As is the case with modern monarchies - the royalty can either choose to step down or be taken down forcibly - one or the other will happen, either way. BTC has largely been left out of the development talks of Web3 systems as a whole, since they refused to fork out their systems to make compatibility improvements - it will eventually get left behind as the world continues to move without them. Luckily this will happen through the simple process of numbers going up and down - rather than having to deal with the fallout of it in the real-world itself.
- What’s Coming Next for Web3?
The typical pattern that the economy goes through during periods of recession is that they switch from a speculative to a savings mindset - when both the banks and the government spends all their money and have literally nothing left, what do they do? Raise interest rates to incentivize people to put money back in. As far as anyone can tell, the fundamentals of this relationship hasn’t changed and is not likely to have done so during this cycle either.
In crypto this means that there will be less demand for NFT lotteries and higher demand for coins that offer staking rewards as a benefit - undoubtedly there will be more and more people searching for the best rates out there as the Fed starts to raise its rates even further in order to keep inflation under control. Interest rates has been at 0% for so long that most people probably forgot that it was a thing - staking was a hard sell even during last year’s run since news of its developments were largely out-blasted by the NFT mania as a whole. But as we start transitioning into a different phase of the economy, people’s priorities are likely to shift.
Some coins that are well positioned to take advantage of this shift are Tezos, Algorand, Cardano, NANO, and many of the other coins that have been proof-of-stake from the very beginning. Ethereum and Dogecoin both have plans on switching over to proof-of-stake in the future (ETH supposedly in August, Dogecoin’s date is unknown), but the elephant in the room that nobody is talking about right now is the fact that Bitcoin doesn’t have the means (nor the plans to) transition into anything that is likely to be relevant in the near future.
Time will tell, but we’ll see what happens over the course of the next few months, next few years, since what happens is likely to be a crucial turning point for the industry as a whole. Now that mainstream money has left the space, both whales and HODLers are waiting for the right time to reorganize their portfolios and get back in. With fiat money out of the picture, we’re likely to see more independent movement between coins and clear winners and losers emerge within the ecosystem rather than always moving in parallel as it has up until now. What comes out in the aftermath of all of this will be a very different crypto landscape - possibly with the “flippening” happening during the midst of it as well.
As one last reminder, your portfolio going down is not necessarily a bad thing, if the goods that you pay for day-to-day gets, on average, cheaper. So I hope people don’t lose sight of the bigger picture and sees the opportunities and benefits that can come out of this transition as a whole. Money is about to get smarter: something that people have been demanding for a very long time. Well, if that’s what you’re looking for it’s coming right for us - hope people can recognize it when it’s here.

AUDUSD:MA to cap gains?!!AUDUSD
Intraday - We look to Sell at 0.7075 (stop at 0.7135)
We are trading at overbought extremes. The 200 day moving average should provide resistance at 0.7074. This is negative for sentiment and the downtrend has potential to return. We look to sell rallies.
Our profit targets will be 0.6900 and 0.6780
Resistance: 0.7130 / 0.7315 / 0.7500
Support: 0.6970 / 0.6780 / 0.6540
Please be advised that the information presented on TradingView is provided to Vantage (‘Vantage Global Limited’, ‘we’) by a third-party provider (‘Signal Centre’) . Please be reminded that you are solely responsible for the trading decisions on your account. There is a very high degree of risk involved in trading. Any information and/or content is intended entirely for research, educational and informational purposes only and does not constitute investment or consultation advice or investment strategy. The information is not tailored to the investment needs of any specific person and therefore does not involve a consideration of any of the investment objectives, financial situation or needs of any viewer that may receive it. Kindly also note that past performance is not a reliable indicator of future results. Actual results may differ materially from those anticipated in forward-looking or past performance statements. We assume no liability as to the accuracy or completeness of any of the information and/or content provided herein and the Company cannot be held responsible for any omission, mistake nor for any loss or damage including without limitation to any loss of profit which may arise from reliance on any information supplied by Signal Centre

Treasury yields and greenback retreat after Fed's 75 bps hikeEUR/USD 🔼
GBP/USD 🔼
AUD/USD 🔼
USD/CAD 🔽
XAU 🔼
WTI 🔽
The Federal Reserve has increased interest rates by 75 basis points, the highest since November 1994. As a result, both Treasury yields and the greenback have retreated, with the United States 10-Year Bond Yield closing at 3.395%, and followed by a low of 3.29%. Meanwhile, US retail sales underperformed with a 0.3% decrease against a 0.2% growth forecast, hinting at a recession that may come after the mega rate hike.
EUR/USD rose to 1.0443, then spiked from 1.0375 to 1.0475 with minor oscillation, investors expect tomorrow's (17 June) Eurozone CPI reading to maintain at 8.1%. GBP/USD has a closing price of 1.2178, currently trading at 1.2175 level. Also on tomorrow, the latest Bank of England Interest Rate had a prediction of bumping 25 basis points to 1.25%.
News on Australian Employment Change in May probably brought optimism among investors, since 60,600 people are joining the workforce, against the original forecast of 25,000. The Aussie greenback pair climbed to 0.7002 and just reached 0.7022. USD/CAD took a dive, went below 1.2900 and closed at 1.289.
A weakened dollar drove up gold futures, first closed at 1,819.6, then briefly went above 1,843, now trading flat at 1,834. Amongst fears of recession. US Crude Oil Inventories managed to restock 1.956 million barrels of crude oil, when most believed it would decline by 1.314 million barrels. Oil prices briefly returned to 115 a barrel, but soon recovered to 116.44.
More information on Mitrade website.

Pound jumps ahead of Fed, BOE meetingsThe British pound is in positive territory on Wednesday. This follows an abysmal 5-day slide which saw the pound fall as much as 600 points. In the North American session, GBP/USD is trading at 1.2060, up 0.53% on the day.
All eyes are on the Federal Reserve, with the FOMC rate decision later today. The Fed is clearly under pressure as inflation surges with no peak in sight - CPI accelerated to 8.6% in April, up from 8.3% in March. This was the highest inflation rate since 1981. The Fed's aggressive stance may shift into overdrive, with a 75-bp hike priced in by the markets at almost 100%. Just a few days ago, the most likely scenario was a 50-bps increase, but hawkish winds are blowing, and a 75-bp move will likely elicit a sharp response from the financial markets. Investors will also be closely monitoring the rate statement and Fed Chair Powell's press conference. I would not be surprised to see the US dollar cash in with strong gains following today's meeting.
The Fed finds itself in a tough spot as it struggles to combat inflationary pressures, which are now more than four times higher than the Fed's inflation target of 2 per cent. The price for the Fed's aggressive rate-hike cycle could well be a recession, but Fed policy makers clearly prefer a (hopefully) short recession rather than inflation expectations becoming unanchored. The big question is will the Fed manage to guide the US economy to a soft landing as it continues to aggressively raise rates.
After the Fed is done, attention will shift to the Bank of England, which holds its policy meeting on Thursday. The likely scenario is that the cautious BoE will raise rates by a modest 25 bps, but we could see a larger hike if the Fed is overly hawkish at its meeting. With unemployment in the UK at a low level of 3.7%, the BoE has room to be more aggressive with its monetary policy. As for the British pound, a 0.25% hike won't be of much help. If the BoE surprises with a larger rate increase, the pound would likely respond with gains.
GBP/USD faces resistance at 1.2108 and 1.2215
There is support at 1.1916. This is followed by 1.1772, a major support level.

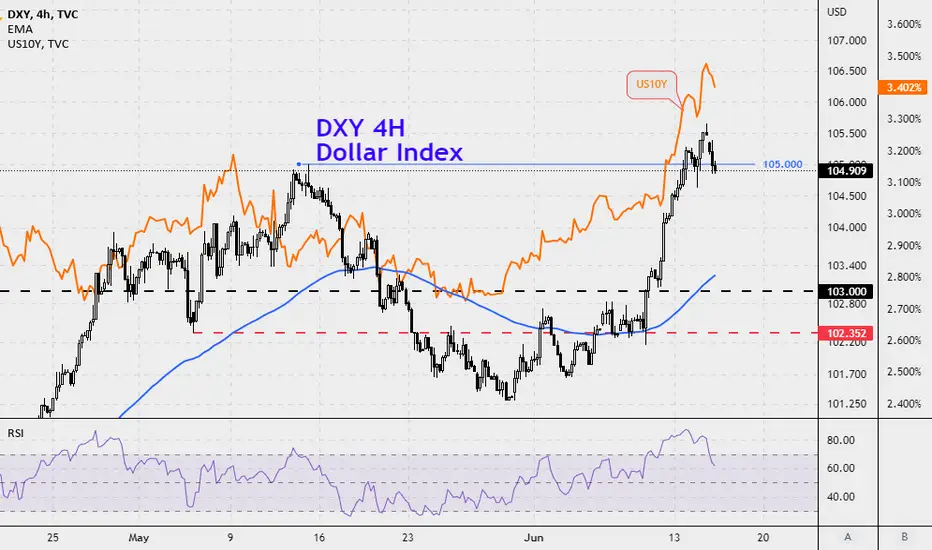
US dollar index DXY The US dollar index DXY compensates for its losses yesterday, before the bears start today's trading, and a battle with buyers is currently at the 105 mark, which is marred by anticipation before the FOMC meeting today.
The outlook tends to positive, supported by the possibility of raising interest rates by 75 basis points in an attempt to curb inflation
EURUSD before FED Today is due the most important type of news for the market - FED Interest Rate decision.
We're expecting a 0.5% hike and that is most likely going to happen.
What we need to find out is what follows after that.
We actually think that those rumors have already affected price by pushing it higher prior to the news.
It's very likely to see price dropping and leaving a wick below the previous low from 13th of May and then to begin climbing towards 1,05-1,06.
We will then expect a continuation of the downtrend.
This is the main scenario that we look at the moment.
We don't currently have any trades and we're only looking to enter after the news, once all setups are confirmed.

The Dollar maintains its momentum ahead of the FedEUR/USD🔼
GBP/USD🔼
AUD/USD🔼
USD/CAD🔽
XAU🔽
WTI🔼
As anxiety dominates financial markets ahead of the US Federal Reserve's decision, the US dollar maintained its strength on Tuesday and Wednesday's opening hours.
Market participants had long anticipated a 50 bps increase, but on Monday, market chatter suggested the central bank may opt for a 75 bps increase. In addition, US officials will give updated Economic Projections, which might result in a protracted aggressive attitude if the new scenario suggests stagflation.
Regarding Eurozone, ECB member Klaas Knot hinted at more rate rises in October and December while maintaining a 25 basis point increase in September.
The United Kingdom delivered mixed employment figures, as the unemployment rate increased from 3.7% in March to 3.8% in April. Still, the number of persons seeking unemployment benefits decreased by 19.7K in May.
The EUR/USD pair stays above 1.0400, while GBP/USD trades at 1.1980, its lowest level since March 2020. The AUD/USD pair continued its decline to 0.6850, while the USD/CAD pair trades at 1.2955, as the weak performance of stocks and falling gold and oil prices sapped demand for commodity-linked currencies.
Wall Street continued under selling pressure, although the Nasdaq Composite managed to notch a 0.10% gain.
Yields on US government bonds continued to rise, with the yield on the 10-year Treasury note reaching a 10-year high of 3.489%.
More information on Mitrade website.

New Zealand dollar sliding, GDP nextNZD/USD has extended its losses today. In the North American session, NZD/USD is trading at 0.6222, down 0.59% on the day.
The New Zealand dollar continues to fall, and fast. The currency has slumped 1.93% this week and is trading just above 0.6216, a 2-year low.
There is plenty of hand-wringing ahead of the FOMC meeting on Wednesday, as the financial markets nervously await the next rate increase. The meeting is live, with the Fed most likely to raise rates by 0.50% for a second straight meeting. However, there are voices calling for a massive 0.75% hike, notably, the chief economist at Goldman Sachs. It would be a shock if the Fed delivered a 0.75% increase, given the turbulent economic environment. The recent US inflation report shows inflation continues to accelerate, raising doubts that an aggressive Fed can guide the economy to a soft landing and the inversion of US Treasury yields is adding to these concerns. A 0.75% salvo from the Fed could lead to a sharp backlash from the markets, which the Fed will be keen to avoid.
The US dollar enjoyed a spectacular day on Monday against most major currencies, and the dollar index surged above resistance at 105. US 10-year yields rose as high as 3.38% earlier in the day, and the upward movement continues to support the US dollar. Risk-correlated currencies like the New Zealand dollar were pummelled, with NZD/USD falling by 1.49%.
New Zealand releases first-quarter GDP later today, with the markets bracing for a modest gain of 0.6% QoQ. This follows a 3.0% gain in Q4. The Reserve Bank of New Zealand will be keeping a close eye on the strength of economy, as the Bank tries to steer the economy to a soft landing while raising interest rates.
NZD/USD is testing support at 0.6244. Below, there is support at 0.6099
There is resistance at 0.6288 and 0.6413

FedEx and the Falling Wedge 📈FedEx NYSE:FDX 📦 gave the falling wedge look back in January 2022—after it failed to break-through trendline resistance.
Since then, it's been an easy stock to watch bounce around and consolidate into a more defined falling wedge, threatening to break trendline support throughout the month of April. After signaling an inverse head and shoulders coming into May, it was a reliable trade up to 225 resistance before failing victim to the three black crows —right back to trendline support on June 13. 📉
The catalyst was an announcement of a 53% raise of the quarterly dividend that sent a big gap up over 218 resistance/support through 225 to test the very top of the falling wedge trendline. Closing near the highs around 231 resistance will provide room for a breakout, however, it would be better to see a few days of consolidation above 225 before confirming the breakout—on volume—over 231.
Depending on what comes out from the Federal Reserve meeting on Wednesday, June 15 will either send this into full breakout mode or send this back toward 218 support.
Keep this one on the top of your radar.

Agilent looking for technology rallyMy models say the Fed cannot raise rates beyond 0.5 points tomorrow or they cannot be trusted in the future. We should see a quick rally to end this week and perhaps begin next week, before the reality of $6+ fuel prices set in again and we continue the bear market.
Based on historical movement, the trough could occur anywhere in the larger red box. The final targets are in the green boxes. The pending top should occur within the larger green box as has been the historical case. Half of all movement has ended in the smaller green box. In this instance, the signal indicated BUY on June 10, 2022 with a closing price of 121.62.
If this instance is successful, that means the stock should rise to at least 122.53 which is the bottom of the larger green box. Three-quarters of all successful signals have the stock rise 2.205% from the signal closing price. This percentage is the bottom of the smaller green box. Half of all successful signals have the stock rise 3.812% which is the end point of the black dotted arrow. One-quarter of all successful signals have the stock rise 6.56% from the signal closing price which is the top of the smaller green box. The maximum rise on record would see a move to the top of the larger green box. These are the same concepts for the levels in the red boxes as well.
The ends/vertical sides of the boxes are determined in a similar fashion. The peak of the rise can occur as soon as the next trading bar after signal close, while the max rise occurs within the limit of study at 50 trading bars after the signal. A 0.4% rise must occur over the next 50 trading bars in order to be considered a success. Three-quarters of successful movement occur after at least 18 trading bars; half occur within 28 trading bars, and one-quarter require at least 38 trading bars.
The black dotted arrow represents median historical movement. Medians are a good metric, but they are just one of many I use when forecasting future movement.
As always, the stock could decline the very next bar after the signal without looking back (therefore the red boxes would not come into play) or the stock may never decline (and the green boxes may never come into play).

Hard to ignore this many oversold signalsMy models say the Fed cannot raise rates beyond 0.5 points tomorrow or they cannot be trusted in the future. We should see a quick rally to end this week and perhaps begin next week, before the reality of $6+ fuel prices set in again and we continue the bear market.
Based on historical movement, the trough could occur anywhere in the larger red box. The final targets are in the green boxes. The pending top should occur within the larger green box as has been the historical case. Half of all movement has ended in the smaller green box. In this instance, the signal indicated BUY on June 10, 2022 with a closing price of 54.66.
If this instance is successful, that means the stock should rise to at least 54.97 which is the bottom of the larger green box. Three-quarters of all successful signals have the stock rise 2.28% from the signal closing price. This percentage is the bottom of the smaller green box. Half of all successful signals have the stock rise 4.5675% which is the end point of the black dotted arrow. One-quarter of all successful signals have the stock rise 8.4275% from the signal closing price which is the top of the smaller green box. The maximum rise on record would see a move to the top of the larger green box. These are the same concepts for the levels in the red boxes as well.
The ends/vertical sides of the boxes are determined in a similar fashion. The peak of the rise can occur as soon as the next trading bar after signal close, while the max rise occurs within the limit of study at 50 trading bars after the signal. A 0.4% rise must occur over the next 50 trading bars in order to be considered a success. Three-quarters of successful movement occur after at least 10.0 trading bars; half occur within 27.0 trading bars, and one-quarter require at least 45.0 trading bars.
The black dotted arrow represents median historical movement. Medians are a good metric, but they are just one of many I use when forecasting future movement.
As always, the stock could decline the very next bar after the signal without looking back (therefore the red boxes would not come into play) or the stock may never decline (and the green boxes may never come into play).

Fed rate hike fears trigger US stock sell-off EUR/USD ⬇️
GBP/USD ⬇️
AUD/USD ⬇️
USD/CAD ⬆️
XAU ⬇️
WTI ➡️
Since inflation does not seem to have peaked just yet, investors expect a mega rate hike of 75 basis points from the Federal Reserve on Thursday, which could bring the US economy to a recession. As a result, major US indices like S&P 500, Dow Jones and Nasdaq 100 have all declined. Meanwhile, the U.S. 10-year Treasury yield kept breaking the record high since 2008, currently at 3.385%.
Major currencies remained bearish, the Euro and Aussie dropped to near month-low, EUR/USD closed at 1.0408 and AUD/USD at 0.6923. With its GDP data underperforming in all variations, GBP/USD went further to a near 3-month low at 1.2134.
Later today (14 June), the UK Office for National Statistics will provide labor market related data such as claimant count change and unemployment rate. Regarding the interest rate decision in the UK, forecasts have projected a 25 basis point increase from the Bank of England.
The USD/CAD pair rose and stabilized at 1.290 level, before closing at 1.2897 - a near month-high. A series of US retail sales data will be released tomorrow, the market anticipated an accelerated growth in core retail goods, and general sales to slow down due to soaring oil prices.
Crude oil mostly traded flat yesterday to a closing price of 120.93, but today saw a rebound from below 118 to over 121 a barrel. Gold futures were at 1,831.8, edging towards a near month-low of 1,820.
More market information on Mitrade website.

Aussie sinks as risk sentiment slidesThe week ended with a disappointing US inflation report. Headline inflation in May rose to 8.6% YoY, up from 8.3% in April. Core inflation eased to 6.0%, down from 6.2%, but that was little comfort for the markets, which are showing signs of panic over entrenched inflation. The result was that risk appetite fell, sending the US dollar surging against the major currencies.
With no sign of an inflation peak, it's clear that the Federal Reserve will have to keep its foot pressed to the floor when it comes to upcoming rate hikes. This makes it likely that the Fed will deliver 50-bp hikes in June, July and September. Just a couple of weeks ago the Fed signalled it would take a break in September, but that now seems a luxury it can't afford, given that inflation hasn't eased.
There have been calls for the Fed to deliver a massive 75-bps salvo at Wednesday's meeting, but such a shock move seems unlikely, especially in the current turbulent economic environment. If Fed Chair Powell is looking to send a hawkish message to the markets, he could hint at the meeting press conference that a 75-bp increase is on the table if inflation doesn't ease. Such a warning would likely boost the US dollar.
There are some key releases out of Australia this week, kicking off with NAB Business Confidence on Tuesday. The indicator slowed to 10 points in May, down from 16 in April. If the downtrend continues, the Australian dollar could continue to lose ground. This will be followed by Westpac Consumer Sentiment on Wednesday and the May employment report on Thursday.
AUD/USD is testing support at 0.6973, followed by support at 0.6902
There is resistance at 0.7181 and 0.7110

Bitcoin worst crash everWe crashed through support and now we crashed even below the crash. If this is not the bottom we are going into a depression, never have we retested the previous cycle top high as a low in a bear market and we are damn near there. This entire market crash was planned and executed by the fed raising the DXY again after it already topped out twice. If they keep it up they are going to collapse the world economy and I don’t think they want that to happen, but if they short the collapse they get richer so what do they care it’s good for them. My opinion if you didn’t sell over a year ago this is definitley where you hodl and be patient the people that sold last night and today are the idiots who let us fall off support do not be like them and use this as a buying opportunity because like I said if we go lower then this the entire economy is going to be in a depression we literally can’t go any lower without crashing the entire economy they are playing with fire and it’s on purpose don’t be fooled this is mo accident or free market configuring this 18 month straight crash

btc broke the trend line that started from 13 mar 20201-stop-limit in 24
2-stop-limit in 20
if the economy goes down and inflation goes up, there is a possibility of war and lower figures.
if the situation improves, we will see higher numbers from one of these points according to my previous analysis, and if it does not improve, we will go lower.
good luck

RED ALERT for BTCBTC testing multi-year Bull Run support. Just in time for the Fed to deliver the kill blow.
Prediction: FED has data now to not only continue with QT but intensify the incremental rate hikes.
This could put BTC into the first real bear market in its existence this week.
Not trading or financial advice... just commenting on chart patterns and how they are aligning with macro events.
