SHORTING EUR/USDSHORTING EU!
Brief Technical Analysis:
- Bearish Flag forming on the H8/Daily TF
- Nice impulse to the downside breaking past 1.13000
- Retest of the round psychological number 1.13000
- 61.8 Fib level lines up with previous stated confluences
- 3rd touch of trendline on H1 timeframe
Brief Fundamental Analysis on the currency pair:
- ECB aren't looking to change monetary policy anytime soon
- Energy crisis in Europe growing concern
- Concerns over new Covid strain 'Omicron'
- The FED are looking to increase their tapering pace, raise interest rates as soon as early 2022
- US Dollar seen as a safe 'haven' for investors (risk-off market = bullish for the Dollar and bearish for the Euro)
Federalreserve

TOTAL CRYTOCURRENCY MARKET VIEWSThe TOTAL CRYPTO MARKET CAP is found on a pretty strong support, where we have $2.153T and $1.965T as Monthly supports, and $1.963T as weekly support. The recent dump took it all the way down to the Monthly and weekly support of $1.96T, where we got a bounce pretty quick. There is a possibility that we could slowly test the $1.96T again in the few next days. A Monthly close above the $2.153T is crucial so that the bullish momentum can continue into beginning of next year 2022. But if we close a weekly/monthly below $1.96T, we will probably see the bullish momentum being delayed for a couple more months. Bear in mind that the FED decision about tapering still has to come out in the next few days, and that also can impact the markets negatively for a while, but yet to be seen.
What I am seeing now, it is a accumulation phase for a few days/weeks between $2.4T and $1.9T, which can be a good opportunity to buy for the long term.
My sentiment: MONTHLY -> BULLISH . WEEKLY -> BULLISH . DAILY -> BEARISH
Red lines = Monthly Supp. Resist.
Blue lines = Weekly Supp. Resist.

$AAPL is nearing a climatic top, brings major risk to the marketAAPL stock is currently vertical, see way too many traders asking "should I sell my AAPL calls" or "its going to $200." - "its going to 3T market cap" reminds me of the last time it was around 2T mc and tanked. Funds buying large amounts of weekly calls always leads retail into a trap, they do this because in the interim they are planning to offload shares. Market makers are forced to hedge by buying up shares, when supply runs out and that option flow isnt there to support price through a gamma squeeze- the stock falls sharply. Retail is left holding the bag, the headlines/talking heads on cnbc sucker them in every time. Be patient, a big trade is coming. (Might be aligning with fed meeting on Wednesday.)

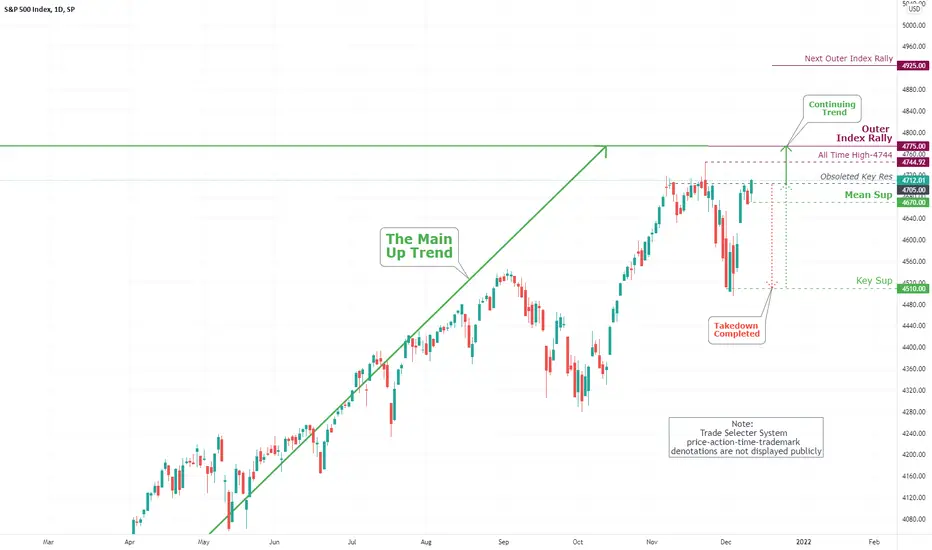
S&P 500 Daily Chart Analysis For December 11, 2021 Technical Analysis and Outlook
The Main Trend is currently reignited - with obsoletion of Key Res 4705; the Spooz is on its way to Outer Index Rally 4775 with the incentive of takeout all-time high 4744. The Mean Sup 4670 go-between buying opportunity.
The Bond Marekt Awaits Inflation DataBonds have continued their slow decline trough support at 130'07 and are hovering just above 130'00. We are starting to see support form in the middle of the vacuum zone between these two levels, confirmed by two green triangles forming on the KRI. Both Kovach momentum indicators have dropped precipitously, which might indicate that we are staring to become oversold and that 130'00 is a floor for now. If we see a relief rally, watch 130'07 or 130'19 for a target. If we continue to decline and break 130'00 then 129'26 is the next target. ZN is likely not to make any significant moves until CPI data comes out this morning.

Is Gold Failing at $1,800?Gold traders have been watching the important $1,800 level for years. Now the yellow metal may be at risk of decisively breaking it.
$1,800 was initially important as a peak in late 2011 after XAUUSD failed to hold $1,900. It was then retested in February and October of 2012 before gold entered a long slide toward $1,000.
Prices spiked to new highs above $2,000 in August 2020 in the wake of coronavirus and the Fed’s aggressive stimulus. But they have trended lower since and made a series of lower highs. The most recent lower high of $1,877 occurred in mid-November.
Another potential signal is the MACD oscillator on this weekly chart. Notice how it turned negative before other dips, like in September 2020 and April 2018. If it starts to fall with prices remaining under $1,800, that could be especially discouraging to the bulls.
Next, you have a difficult macro backdrop with the Fed tapering asset purchases before potential rate hikes in 2022. Bullion also faces competitors as a store of value given the rise of cryptocurrencies.
In conclusion, consider these comparisons versus October 2012: Gold is down about 1 percent. The Consumer Price Index is up 20 percent. Bitcoin is up 525,000 percent.
TradeStation is a pioneer in the trading industry, providing access to stocks, options, futures and cryptocurrencies. See our Overview for more.
Important Information
TradingView is not affiliated with TradeStation Securities Inc. or its affiliates. TradeStation Securities, Inc., TradeStation Crypto, Inc., and TradeStation Technologies, Inc. are each wholly owned subsidiaries of TradeStation Group, Inc., all operating, and providing products and services, under the TradeStation brand and trademark. When applying for, or purchasing, accounts, subscriptions, products and services, it is important that you know which company you will be dealing with. Please click here for further important information explaining what this means.
This content is for informational and educational purposes only. This is not a recommendation regarding any investment or investment strategy. Any opinions expressed herein are those of the author and do not represent the views or opinions of TradeStation or any of its affiliates.
Investing involves risks. Past performance, whether actual or indicated by historical tests of strategies, is no guarantee of future performance or success. There is a possibility that you may sustain a loss equal to or greater than your entire investment regardless of which asset class you trade (equities, options, futures, or digital assets); therefore, you should not invest or risk money that you cannot afford to lose. Before trading any asset class, first read the relevant risk disclosure statements on the Important Documents page, found here: www.tradestation.com .

Monday market updateA look into market dynamics Forex, Stock, DXY, commentary on how I believe this situation of new lockdowns will play out

ERSDL analyseun Federal reserve token
daily time frame
break the resistance line and pullback = ready to pump
risk reward ratio >5 Woooooooow

Pound lower, retail sales reboundThe British pound is in negative territory in the Friday session. GBP/USD is currently trading at 1.3450, down 0.35% on the day.
UK retail sales for October surprised the markets, as the gain of 0.8% m/m was the first gain in five months. Clearly good news, but the improvement could well be due to early Christmas shopping rather than a change in the mindset of consumers, who have been slow to spend since the end of the lockdown in the summer. Consumer confidence has been weak as caution is the mantra in what has been a difficult year. On an annual basis, retail sales fell by -1.6%, which follows a read of -1.1% in September.
Inflation continues to accelerate as the "transient" narrative seems out of sync with what is happening on the ground. The UK consumer price index hit 4.2% y/y in October, above the consensus of 3.9%. The data will add to the pressure on the BoE to raise interest rates at the December policy meeting. The bank held rates at the November meeting, which shocked the markets, as Governor Andrew Bailey had sent strong hints that the bank would raise rates in order to contain inflation. The BoE is projecting inflation to go as high as 5% in early 2022 before falling lower in 2023. After being burned by the BoE, investors will be mindful about projecting a December rate hike, but it's clear to everyone that the bank will need to raise rates shortly - if not in December, then early in the New Year.
With no tier-1 events out of the US today, the markets are focusing on President Biden's choice for Chair of the Federal Reserve, which should be announced on the weekend. Jerome Powell was considered a strong favourite until recently, but Fed member Laura Brainard could be a surprise choice. Brainard is considered more dovish than Powell and would be expected to raise rates more slowly. If Brainard wins, we could see an immediate reaction from the markets and the US dollar could lose ground.
GBP/USD has support at 1.3310. Below, there is support at 1.3206
There is resistance at 1.3562 and 1.3710

USD/JPY LongOur fundamental bias is tilted to the upside for this pair as the FED is expected to hike rates earlier due to inflation fears in the US economy. The JPY is expected to be pressured due to the BOJ assuring the market that they are not planning to raise rates anytime soon. We structurally expect the pair to complete a WXY in a higher timeframe.

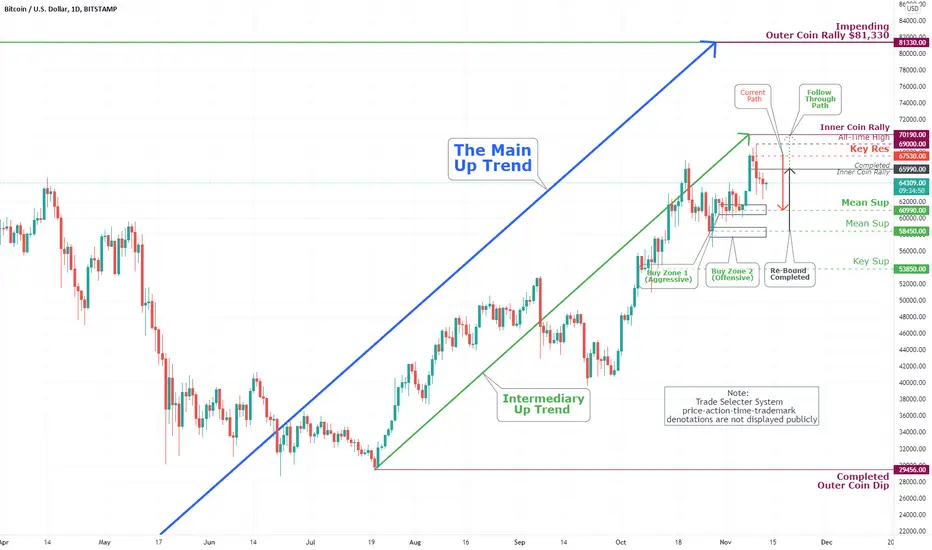
Bitcoin (BTC/USD) Daily Chart Analysis For November 13, 2021Technical Analysis and Outlook:
Bitcoin has completed our Inner Coin Rally 65,990, as we have newly developed Key Res 67,530 target to be revisited following takedown to Mean Sup 60,990, along with the Inner Coin Rally 70,190, and an all-time high of 69,000 marks.
TYX 30 Year Bond YieldWith Fed Powell having his big speech last week, I wanted to take a look at the TYX which is the 30 year treasury bond yield. Although he noted that they won't necessarily hike interest rates in the short term, he did say that he would consider doing so Q2 and above depending on job growth and GDP growth. There was also a clear warning that the Fed would pullback on some of the bond purchasing two times in November and December going into 2022. The TYX normally responds to this in a bullish manner. With the CPI reports being the highest since 1990, consumers are taking hits with having to spend more money for the same products. In the most recent months, this hasn't really mattered to the average consumer. However, if the CPI reports continue to come in higher than forecasted, I'm sure that those same consumers would start pulling back their expenditures. Now taking a look at the chart, my focus is on the Daily TF where there seems to be a bullish flag forming and or an Eve and Eve double bottom that could be in the midst of forming if consolidation persists within the next 3 months. The Mac D indicator seems as if it needs to retrace the previous high and it has already surpassed the 38% retracement level and am looking for a bullish move out of the flag to reach the 61.80% retracement. If this happens and we cross above the 200 ema (already happening on the 15 min) we could be back in the 2's at some point in the near future.
What do you think?
Like, follow, agree, disagree!
Not advice! Just an Idea!


Bitcoin Short Setup! ABC elliot wave correctionFull short elliot waves setup headed to 44000 to 48000 USD is finally here!. Some many bullish comments you heard: "november 80k"...."December 120k target cause stock to flow model"... too much FOMO I presume. We strongly believe on an end cycle have been reached this time and Bitcoin needs to correct 20% - 35% at least to keep an ascendend steps like it was in the past. Some few reasons to considery it:
1- FED Tappering it's here.
2- Inflation rate on historical highs.
3- Evergrande default and some few chinese institutions with high loans and no liquidity.
4- Bitcoin market makers are watching peoples FOMO.
5- Bitcoin Bearish Rising wedge
Elliot waves and chart features:
1- Logarithm chart
2- Wave A: 55500 - 58000
Wave B: 60000 - 63000
Wave C: 44000 - 48000

The Road To Normalcy Begins (06 November 2021)Fed starts tapering!
The long-awaited taper meeting has finally arrived! The Federal Reserve announced during their monetary policy meeting on Thursday that it will begin slowing down its net asset purchases by $15 billion per month which comprises of $10 billion Treasury bonds and $5 billion agency mortgage-backed securities. The first round of tapering will begin later this month and the second round will take place at the beginning of December.
Moving forward, the monthly pace of quantitative easing (QE) tapering will be similar to these two months and may be adjusted depending on the economic outlook. Regardless of the pace, the Fed is expecting QE to end by mid-2022.
The following illustration shows that under the same tapering pace, QE will end in June 2022.
Nov 2021: $70b Treasury Bonds + $35b Agency MBS
Dec 2021: $60b Treasury Bonds + $30b Agency MBS
Jan 2022: $50b Treasury Bonds + $25b Agency MBS
Feb 2022: $40b Treasury Bonds + $20b Agency MBS
Mar 2022: $30b Treasury Bonds + $15b Agency MBS
Apr 2022: $20b Treasury Bonds + $10b Agency MBS
May 2022: $10b Treasury Bonds + $5b Agency MBS
Jun 2022: End of QE
A small step back on “transitory”
With the recent comment made by Fed Chairman Powell that supply bottlenecks will take longer to ease, thus expecting prices to remain high for a longer period of time, the Fed has taken a small step back from its view on inflation being transitory. The previous confidence that the elevated inflation “largely reflecting transitory factors” has now been revised to “largely reflecting factors that are expected to be transitory”.
During the press conference, Powell also clarified the definition of “transitory” that the central bank adopts after highlighting that the word has different understanding to different people. For the Fed, “if something is transitory it will not leave behind permanently – or very persistently higher – inflation”.
With the ongoing supply chain disruptions, the central bank Chief is expecting inflation to continue its rise into 2022 before easing back down during mid-2022.
Maximum employment still quite a distance away
Although tapering of the massive $120 billion per month QE programme has begun, Powell warned that the Fed’s decision to do so does not imply a rate hike is underway. The central bank held its interest rate unchanged at the targeted range of 0-0.25% and would like to see the labour market achieve maximum employment before considering a hike. As of the October’s jobs report, the U.S. job market is still some 5 million jobs away from the pre-pandemic level. The Fed is likely going to consider a rate hike only when the jobs lost during the pandemic have been fully recovered. Even so, the central bank may wait a little longer to be certain that jobs growth is indeed consistent before committing.

Pound's woes continueThe British pound has extended its losses in the Friday session. GBP/USD is currently trading at 1.3445, down 0.41% on the day.
It's been a miserable week for the British pound, which is down 1.76% this week. The driver behind the pound's slide was the BoE meeting, as policy makers caught the markets off guard when they opted to maintain the cash rate at 0.10%. Governor Andrew Bailey had strongly hinted that that bank would raise rates at this week's meeting, but in the end, the MPC voted 7-2 to stay put, with Bailey among the majority. Bailey noted that the decision had been a "close call", but the markets reacted sharply, with the pound plunging 2.2% since the BoE's surprise non-move.
The BoE has said it will raise rates in the "coming months", but is clearly under pressure to make a move soon, and it could be faced with a credibility issue if it chooses to sit on the sidelines at the December meeting. The fact that the BoE is still running a QE scheme while talking about raising rates is also a potential source of confusion for the markets, as the two programmes are inconsistent with each other. In contradistinction, the Fed has no plans to raise rates before it winds up its bond purchase program.
Attention now shifts to the US, with the release of nonfarm payrolls later today. The consensus stands at around 450 thousand jobs added, and a reading above the 500 thousand level will reignite talk of an accelerated taper programme and possibly the Fed bringing forward guidance on a rate hike. That would likely give the US dollar a boost. Conversely, a print below 350 thousand will dampen rate expectations and likely weigh on the greenback.
GBP/USD continues to break support levels as it falls lower. The pair is testing support at 1.3471. Below, there is monthly support at 1.3253
There is resistance at 1.3570 and 1.3632

Has The USD Avoided The Dreaded Taper Tantrum?With its back up against a wall, the US Federal Reserve has pledged to begin tapering its asset purchase program. Beginning later this month, the Federal Reserve will reduce the number of US Treasury Securities it purchases each month by US $10 billion and the number of Mortgage-Backed Securities by US $5 billion.
How did the USD react to the Federal Reserve announcement?
By all accounts, a dreaded ‘taper tantrum’ has been avoided in the wake of the announcement. At least in relation to the forex market. Federal Reserve chairman Jerome Powell has been extremely careful to prime investors for this moment. For one, all hawkish commentary from the chairman has been mediated with dovish caveats. Admittedly, less senior Federal Reserve officials have done much of the leg work in hinting and out-right suggesting the need for a reduction in its purchases. Either way, the conversation surrounding tapering has been sustained for months, giving investors time to mull over the implications.
As of writing, the USD index, the DXY has crossed back over the 94.00 mark and comfortable sits 94.33, up 0.53% since the Federal Reserve’s tapering announcement.
Will the Federal Reserve continue to taper?
The Federal Reserve will still be purchasing $105 billion worth of securities, with further reductions dependent on continuing favourable economic outlook. The Federal Reserve has indicated it is considering reducing spending, month over month, moving forward. However, if economic conditions deteriorate, the spending reductions could be nullified or reversed. The Federal Reserve will be keeping an eye on inflation and the number of jobs added to the economy each month.
Inflation remains at a decade high
A significant consideration of the Federal Reserve when determining its reduction in spending is the US inflation rate. While it is at a 13-year high, the Federal Reserve maintains that most of the inflation experienced heretofore is temporary.
Octobers inflation number is released next Wednesday. Trading Economics is forecasting a 0.1% increase in US inflation.
Up next: Non-Farm Payroll
Another significant consideration of the Federal Reserve when determining its tapering is the Non-Farm Payroll (NFP). The NFP indicates how many non-farm jobs were added to the economy in a given month. The data for the October non-farm payroll will be released tonight to great anticipation. Trading Economics is forecasting 400K jobs, while the market consensus is a little more optimistic and is forecasting 450K jobs.
The NFP has disappointed for the past two months, with actual job figures falling far short of the numbers predicted. Even so, the Federal Reserve has seen fit to begin tapering as job growth seemingly slows. Treasury Security Janet Yellen noted the US economy is still short 5 million jobs compared to pre-pandemic times, which will take the US years to recover at the current rate of job growth.

Euro dips to 3-week low as Fed trimsThe euro is down considerably in Thursday trade. Currently, EUR/USD is trading at 1.1550, down 0.53%. Earlier in the day, the euro fell to 1.1528, its lowest level since October 13th.
There were no surprises from the Federal Reserve meeting, as policy makers trimmed the QE programme by 15 billion dollars/month. The move was nonetheless highly significant, as it marks the first tightening in policy since QE was introduced as a response to the economic downturn in early 2020 due to the Covid pandemic. Although the move was communicated to the markets in advance, it was unclear as to how much the Fed would trim, and an amount other than 15 billion dollars could have shaken up the US dollar.
The Fed's move was aptly described as a 'dovish taper', in that the Fed continues to maintain a dovish stance as far as future rate hikes and inflation. Fed Chair Powell said after the meeting that the bank would remain patient and wait until the job market was stronger before raising rates, emphasising that the Fed would encourage job growth through low rates. As for inflation, Powell stuck to his well-worn script that the current bout of high inflation is "expected to be transitory" and will ease lower. Powell appears to be odds with the markets, which are far more hawkish and have priced in several rate hikes for 2022. Inflation has been running at 4% over the past five months (double the Fed's target) and it's becoming a stretch to argue that this is a transitory trend, with no sign that inflation will cool anytime soon.
What is interesting is that other major central banks are also preaching patience and arguing that high inflation is transitory. Earlier today, the BoE surprised the markets by maintaining rates; the BoE had signalled that it would raise rates in order to contain inflation. However, the BoE echoed the Fed when it stated today that the factors causing high inflation were transient and that it expected inflation to ease in several months. The ECB is also singing from the same hymn sheet - the bank has projected that inflation will be "subdued" in the medium term, and earlier in the week, ECB President Christine Lagarde said that the bank had no plans to raise rates in 2022.
There are resistance lines at 1.1658 and 1.1754
1.1501 is providing support. This line has held since July, but was under pressure earlier in the day. Below, there is support at 1.1440

It is the FED day The markets are likely to choose a directional price path after the announcement and press conference that will wrap up around 3 PM Eastern.
While the market is pricing in hiking, it’s not actually pricing in tightening. Or to put it another way, it’s not pricing in the kind of move that would meaningfully slow down growth or inflation.
Aspen Trading S/R levels are showing resistance @ 4,628.25 and we should wait for the market direction after FED announcement. Overall, SPX500 looks really good for a bullish move to the upside.
Please like, share and follow if you agree with the analysis.
Note - Aspen Trading S/R levels are invite only. They can be accessed through my profile information.
Disclaimer: This analysis is for information purpose only and does not constitute any investment advice.

Dow Jones...nothing special just aiming for a modest 40K xD EW Count ....FED doesn't see any inflation therefore why not bring us a new QE program and shoot us right up into hyperinflation I would ask? Gotta pump up those portfolios of the FED members before leaving the burning house...

INTEREST RATE DECISION IMPACT II. PARTI think we are nearing the end and just like the Federal Reserve help to put the bottom in in March of 2020 I think they are going mark the top in at the end the this year making (2021).
How the mechanisms work in short.
At this point in a long-term economic cycles you seen the financilization of everything near the end of the dominance of economies that only global reserve currency becomes one trade.
Business
Land
Stores of valu
All move in tandem against the currency at the sole discretion of the Central Bank
We've seen in last two years unprecedented money supply in the intervention in our economy by the Central Bank that results have been record high asset prices and record-breaking inflation.
Federal Reserve faces unpopular decision holding back on it easy money policy. Its comes in two forms either raising interest rates or selling assets.
The FED currently doing which is buying acsetss injecting new money what they will do in near future is selling assets thus they will extract money from the economy .
They stated very clearly the economy is not yet strong enough to raise interest rates.
Thus the first thing that they plan on doing is reducing assets purchases and then after that point they will start selling and raising interest rate at some point.
Timeline for this when will this tapering will happen and when will cause a crash as result of tightening would definitely not happen until at least tigtening begins so its pretty much rules out this year
because they've stated that they're gonna let us know when it's going to happen .
The earliest that begin to reducing asset purchases is closer to the end of this year but it does take a little bit of time for the effect of monetary policy to be felt in economy. The effect does not will be inmediant, but for you at time need to positioneted your assets accordingly.
We have time , which is great but if we step earlie we gonna leave money on the table.
FED TIMELINE
According to the Federal Reserve with light to have their total asset purchase per month down 0$ purchases by the end of 2022 if not a little bit earlier. Current120 billion dollars ( min)
In the next part I will let you know why they need hike rates, and how its connected with Joe Biden agenda.
Now the most important things to interpret the coming message from Jeremy Powell on Wednesday.
Please look after if you dont know M2 money supply

Will Jerome Powell Bury Gold Miners?The VanEck Gold Miners ETF has had a countertrend rally this month, rebounding from a 17-month low. But now could be the time sellers return.
The first pattern on today’s chart is the $33.25 price zone. GDX bounced at this level in November and July. It marked the high in early September and seems to be resistance again this week.
Next, stochastic has been in an overbought condition. This reading also marked tops in May, August and September.
Third, consider upcoming events like the Federal Reserve meeting and non-farm payrolls next week. Those could potentially boost interest rates and the U.S. dollar, which may be negative for precious metals.
Finally GDX is forming an inside week, a potential sign of its recent bounce slowing. This pattern also occurred at tops in August 2020 and May 2021. (See below.)
TradeStation is a pioneer in the trading industry, providing access to stocks, options, futures and cryptocurrencies. See our Overview for more.
