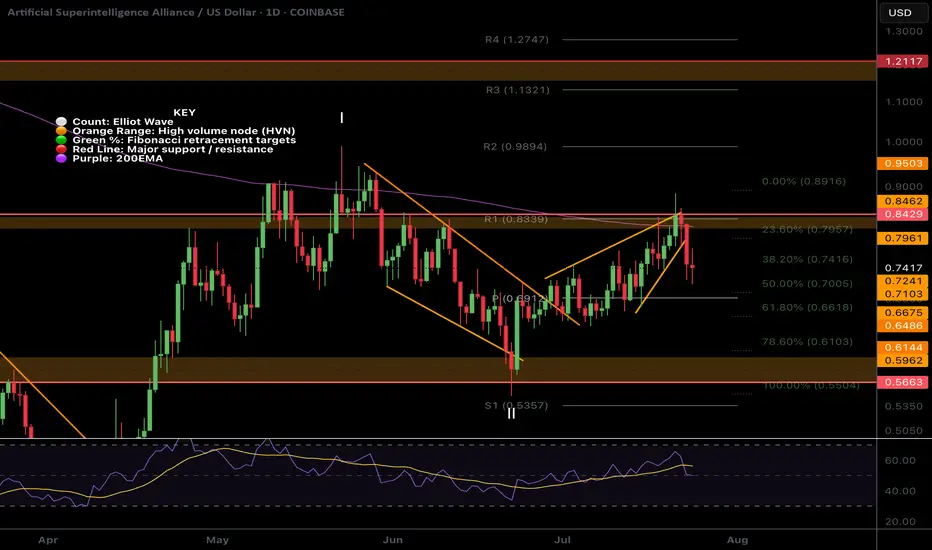
$FET local ending Diagonal and wave 2 near completion?NYSE:FET was rejected for the 4th time at the daily 200EMA! Each time the probability of a breakout increases.
I have adjusted the High Volume Nodes for accuracy.
Locally Fetch appears to have completed a motif wave up with an ending diagonal for wave 5. Wave 2 is expected to find support at the daily pivot and .618 Fibonacci retracement before attempting a breakout of the daily 200EMA once more.
A move below wave II will invalidate this analysis.
Safe trading
FET
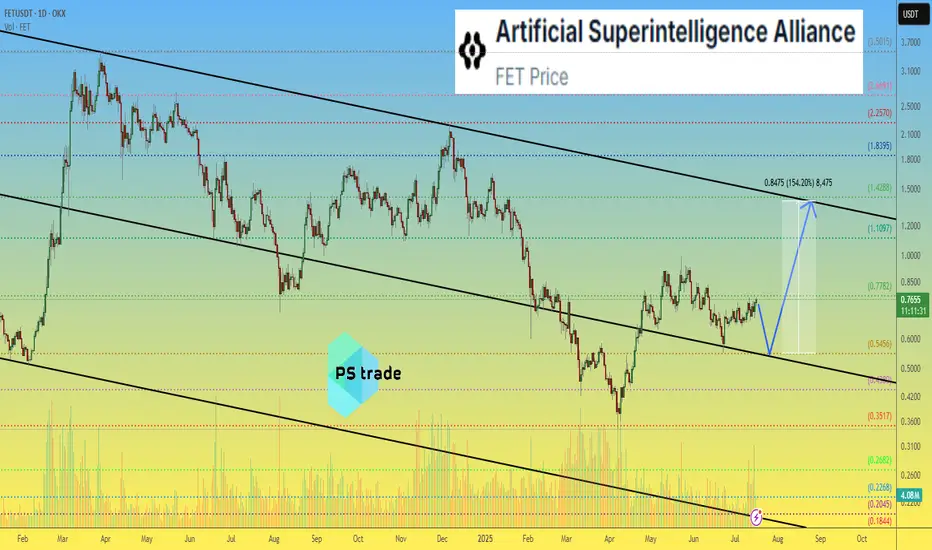
Artificial Superintelligence Alliance (FET) Enters Bullish PhaseThere is always really high volume on this chart. FETUSDT trading is very active and this is always a good signal regardless of the overall picture. It means there is interest in this trading pair. Some pairs you can see have absolutely no volume and you know only bots are trading it. When volume is high, you know there are some people buying and selling behind the scenes and when the market goes on a trend, it tends to produce wild moves. So high volume is always good.
The trend is the uptrend next. We already saw a major downtrend starting March 2024. After a low in August 2024, the classic dead-cat-bounce led to a lower high in December and then the final bottom, just two months ago. This is the correction end and bottom and from this bottom we grow. Market conditions are changing.
The bearish phase is over and it lasted more than a year. One year and one month. We are now entering a new phase and it will be a bullish cycle. How long will it last? Can the bullish cycle last just 3 months while the bearish cycle lasted 13 months? These are good eye opening questions. It shows that we might be setting ourselves up for an entire year of growth.
Actually, can be 4 months, 6 months, 8 months, 12 months or more... It doesn't matter, we are going up. Artificial Superintelligence Alliance —FET.
Namaste.

FET Secondary trend 19 07 2025Logarithm. Time frame 1 week for clarity.
Main trend is an ascending channel.
Secondary trend is a descending channel
Local trend is a Ross hook, at the median resistance. Reversal zone.
By the way, the trading idea from 2022 FET/BTC is still relevant. Pay attention to where the price is.
FET/BTC Main trend. Pump zone cycles . 2022 06

$NEAR Local Still looks corrective..Though the CBOE:NEAR weekly looks good the same pattern on NEAR that I have highlighted here was also found on NYSE:FET and EURONEXT:RNDR local charts that has held these coins back from moving compared to others and appears corrective in nature and they all end at the daily 200EMA on bearish divergence.
Just something to look out for. A rejection in alts now could see fresh lows
Safe trading

FET - Perfect trade for beginner- FET is breaking out from the flag pattern and we have clear and confirmed breakout
- most of the like flag pattern breakout succeeds, this gives a high confidence trade
Entry Price: 0.775 (current price)
Stop Loss: 0.5307
TP1: 0.9072
TP2: 1.1495
TP3: 1.3791
TP4: 1.7927
TP5: 2.1468
Max Leverage 5x
Don't forget to keep stoploss
Cheers
GreenCrypto

Artificial Superintelligence Alliance - FET price analysis📈 It looks like the price of the combined and updated #FET is trying to consolidate at the top of the channel.
All that remains is to wait for confirmation, i.e., for the OKX:FETUSDT price to stay above $0.55 in the coming days/weeks.
🤖 And then the #ArtificialSuperintelligenceAlliance token (the name is more complicated than the stop word from the movie “Eurotrip” — "hello olds" :) can be purchased for an investment portfolio with a growth potential of at least +150%.
_____________________
Did you like our analysis? Leave a comment, like, and follow to get more
$FET Does Zooming out look better?NYSE:FET has been underperforming lately and the local chart looks trash so I wanted to zoom out to give us all some context on the larger picture which hasn't really changed.
Price appears to have completed wave II at the High Volume Node (HVN) support and 0.5- 0.618 'Golden Pocket' Fibonacci retracement and wave 3 is underway but finding local resistance.
Pivots are warped due to the strength of the move last year so wouldn't count them as reliable so focusing on support and resistance. The megaphone pattern is clear and the next area of resistance when FET starts moving is the $1.2
Weekly RSI is decreasing and is attempting to cross bearishly. If Bitcoin has a significant pullback I would expect new lows for FET at this rate. I have a neutral stance at this point.
Analysis is invalidated below $0.546
Safe trading

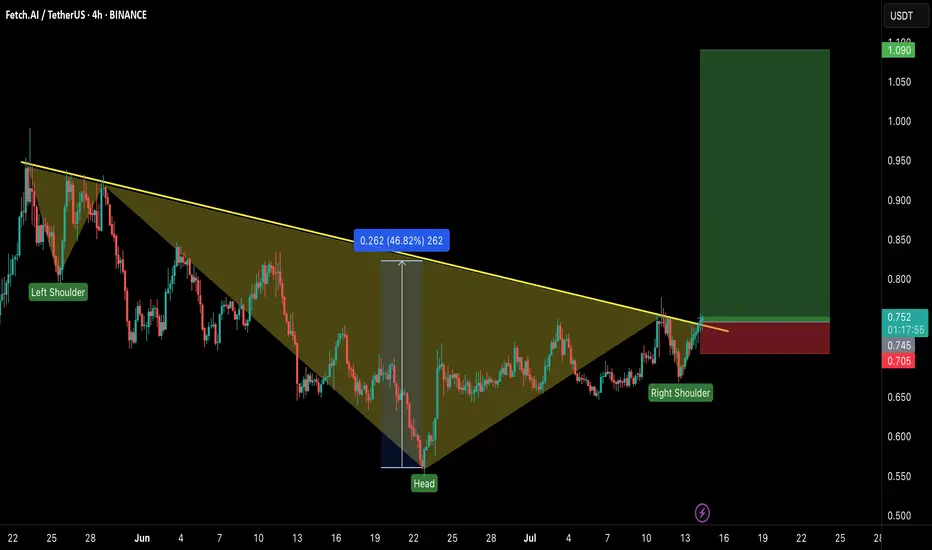
FET/USDT – Head & Shoulders Breakout!Hey Traders — if you're into high-conviction setups with real momentum, this one’s for you.
ONDO is trading inside a falling wedge on the daily chart — a classic bullish structure that often leads to explosive breakouts. 📈
FET just broke out of a classic inverse head & shoulders pattern — a strong bullish reversal structure! The breakout looks clean with a confirmed close above the neckline and volume starting to pick up.
💼 Entry: CMP ($0.75)
🎯 Targets: $0.85 / $0.95 / $1.09
🛑 Stop-loss: $0.705
📈 Risk-Reward: Favorable
🧠 Why it matters:
Clean breakout above resistance
Strong trend reversal structure
Potential for 40%+ move ahead.
💬 Are you in this breakout play or watching from the sidelines? Let’s talk below!
👉 Smash that LIKE and FOLLOW for more real-time setups!
FET – HTF Setup Primed for ExpansionFET is looking strong here from a high time frame perspective — currently sitting around $0.739, well into the discount zone of the macro trend channel.
We’ve got:
✅ Price holding monthly demand
✅ A clear swing higher low forming on the weekly and 3W
✅ Already seen the first expansion leg out of demand
✅ Now potentially loading the next move higher
Zooming out, price is still trading below the midline of the long-term uptrend channel — and a move back to the upper boundary puts targets in the $6 region, aligned with a new higher high.
📈 HTF Structure
Midline rejection flipped support
Demand tested and respected
HL printed after clean retest
370% upside just to retest the prior HH at $3.50
HTF trend structure still fully intact
This setup is also supported by the broader HTF bullish bias across BTC, ETH, and majors, which adds confluence to a potential larger expansion phase for alts — especially strong narratives like AI.
🎯 Targets
🎯 $3.50 = prior high
🎯 $6.00+ = upper channel target / next HTF extension zone
From current levels, risk/reward looks very clean.
1W:
3W:
3M:

$FET Ready for the next move up?NYSE:FET looks ready for the next move up with a similar analysis to many other alts I have shared.
It is breaking out of descending resistance after testing the .618 Fibonacci retracement and High Volume Node (HVN) as support. Price broke above the daily pivot and is now swinging below, a recovery above the local swing high will be a bullish signal to go long with a wave 3 target of the R3 daily pivot and major resistance HVN at $1.13.
Analysis is invalidated below $0.54
Safe trading

#FET/USDT Preparing for a Major Rally ?#FET
The price is moving within a descending channel on the 1-hour frame and is expected to break and continue upward.
We have a trend to stabilize above the 100 moving average once again.
We have a downtrend on the RSI indicator that supports the upward break.
We have a support area at the lower boundary of the channel at 0.655, acting as strong support from which the price can rebound.
We have a major support area in green that pushed the price upward at 0.650.
Entry price: 0.665
First target: 0.688
Second target: 0.716
Third target: 0.750
To manage risk, don't forget stop loss and capital management.
When you reach the first target, save some profits and then change the stop order to an entry order.
For inquiries, please comment.
Thank you.

FET/USDT Breakout Imminent? Preparing for a Major Rally!
🧠 Key Pattern: Descending Trendline Breakout
On the daily chart (1D), FET/USDT (Fetch.AI) has been consolidating under a strong descending trendline since its late 2024 highs. Currently, price action is coiling tightly just below this resistance, signaling a potential explosive breakout.
The price is trading near $0.72, right below the trendline — is this the calm before a major move?
🔍 Technical Analysis Overview
📉 Previous Downtrend Structure:
After peaking above $2, FET underwent a prolonged correction phase marked by lower highs and lower lows.
Sellers dominated for months, but the momentum is now shifting.
📈 Current Setup:
FET is forming a series of higher lows since March — an early sign of bullish reversal.
Volume is showing slight increases, which often precedes breakout attempts.
✅ Bullish Scenario (Breakout Rally)
If the price breaks and closes above the descending trendline (~$0.75–$0.78):
1. Initial Resistance: $0.818 → minor overhead supply zone.
2. Confirmation Level: $0.904 → breakout validation zone.
3. Major Upside Targets:
$1.225 → psychological resistance & previous consolidation level.
$1.599 & $1.809 → Fibonacci extension targets from prior impulse.
$2.147 – $2.195 → potential retest of the previous high.
📌 Upside Potential: Over +150%, if breakout is confirmed with strong volume and sustained momentum.
❌ Bearish Scenario (Rejection & Pullback)
If the price gets rejected from the trendline:
Possible pullback to $0.65, the recent higher low support.
Breakdown below this could extend the move toward $0.55 or even $0.47.
Major support: $0.345 → long-term demand zone.
📉 A failed breakout (fakeout) is possible if volume does not support the move.
📊 Trading Strategy Suggestions:
Breakout Entry: Above $0.78 with stop-loss below $0.70.
Retest Entry: Wait for a pullback to confirm support at the trendline after breakout.
Volume Confirmation is Critical — avoid chasing without strong bullish candles.
🧠 Narrative Bonus:
Fetch.AI remains one of the top AI-related projects in the crypto space. As the AI narrative resurfaces, a technical breakout could align with renewed fundamental attention — creating the perfect storm for a rally.
📌 Conclusion:
FET/USDT is positioned at a highly critical technical and psychological level. A confirmed breakout could initiate a large bullish wave, while rejection could drag the price lower. Manage your risk wisely and watch for volume cues.
#FETUSDT #FetchAI #BreakoutSetup #CryptoTrading #AltcoinRally #TechnicalAnalysis #DescendingTrendline #CryptoSignals #AIcoins

#FET/USDT#FET
The price is moving within a descending channel on the 1-hour frame, adhering well to it, and is heading towards a strong breakout and retest.
We are seeing a rebound from the lower boundary of the descending channel. This support is at 0.634.
We have a downtrend on the RSI indicator that is about to be broken and retested, which supports the upward trend.
We are looking for stability above the 100 moving average.
Entry price: 0.661
First target: 0.684
Second target: 0.720
Third target: 0.754

FET Wave 2 Complete?NYSE:FET (Fetch.ai) appears to have completed a wave 2 pullback and looks set for the next move up towards $1.1
Price swung below the bottom of the wedge, tested the S1 daily pivot and 61.8 Fibonacci golden pocket. It quickly recovered with a bullish engulfing daily candle negating the 3 previous days bearish price action.
A close above the top wedge line and daily pivot will be the signal to go long again.
Analysis is invalidated below $0.54 and that will bring up a downside target of $0.34 which is the ascending macro support from June 2023.
Safe trading

FetchAI New All-Time High —656% Profits Potential MappedSupport here is well defined, it is a long-term situation. Resistance in late 2023 and early 2024; resistance in late April 2025; support in early May and mid-June. This is the red line on the chart.
In early 2024 there was a small rounded bottom pattern below this long-term support line. After resistance was conquered a major bullish wave appeared, more than 400%.
In early to mid-2025 a big rounded bottom pattern appeared below this long-term support line. Below support it is resistance; it has been conquered as resistance and now FETUSDT trades above. This opens the doors for massive growth, really massive.
This chart setup is calling for a new all-time high. You can find several targets mapped on the chart.
» 221% is an easy target, easy profits; high certainty-high probability. This is around $2.30.
» $3.77 is a shy new all-time but I believe this is also high probability. This target gives 426% profits potential.
» The standard 2025 all-time high projection sits around $5.42. From current price, this gives a total of 656%. If we take the same target and use the April bottom as the startup point, we get 1,471%. This would be the total growth of a bullish wave that peaks at $5.42 in late 2025, but there can be more.
Prepare for the best, hope for the best.
The best is yet to come.
Namaste.

FETUSD is an excellent buy, targeting at least $3.75Artificial Superintelligence Alliance (FETUSD) or otherwise known as FETCH.AI has been trading within a multi-year Channel Up and right now is on its latest Bullish Leg and quite possibly the last for this Cycle.
Given that all similar Bullish Legs that started with 1W MACD Bullish Crosses that low, grew by at least +1012%, we expect a minimum Target for this Cycle at $3.75. If it follows the more aggressive +2041% rise of 2023/ 2024, we can even see $7.00 but that is the more optimistic scenario.
-------------------------------------------------------------------------------
** Please LIKE 👍, FOLLOW ✅, SHARE 🙌 and COMMENT ✍ if you enjoy this idea! Also share your ideas and charts in the comments section below! This is best way to keep it relevant, support us, keep the content here free and allow the idea to reach as many people as possible. **
-------------------------------------------------------------------------------
💸💸💸💸💸💸
👇 👇 👇 👇 👇 👇

FET Correction Bottom Confirmed —Buy OpportunityThe next All-Time High for FETUSDT in late 2025 or early 2026 can reach between $5.42 or $8.56, giving us more than 1,600% profits potential from the current price. This is taking $8.56 as the next All-Time High. Let's get that part out of the way because I want to show you the end of the current correction. I am using the linear scale so it won't let me show you higher targets on the chart.
There was a resistance level in April 2022 as the bear market developed. This resistance was confirmed again in February 2023. It took 270 days, or 9 months, before this resistance level was conquered (broken). As soon as it broke, it was tested as support (Feb. 2024) and then a major rise. This major rise completed a long-term bullish cycle and after a bullish cycle a correction always develops.
How far down can the correction reach?
How low can prices go?
The correction started in March 2024 and is active until this present day. Obviously, the strongest resistance price range in the history of FETUSDT will need to be tested again but as support.
Now, FETUSDT bottomed last week and this bottom happened at the same level where the April 2022 and February 2023 resistance was found. As the action approached this level, volume started to go up. The next week, this week, we have a bullish candle and this is very likely the end of the correction; the bottom is in.
I just wanted to let you know that this level will hold because it was a strong resistance in the past. A resistance level once conquered turns into support.
As prices are now, it is the best possible time to enter; buy, go LONG.
This is a friendly reminder. I am wishing you tons of success and huge profits in this bull market that is just about to develop. It will be a bull market that will change the world. The world is already changing, but this bull market will close the deal. By the time it is over, Cryptocurrency will have taken over the world.
New money. The rich nouveau.
Namaste.

TradeCityPro | FET: Bullish Weakness Near Key Support Zone👋 Welcome to TradeCity Pro!
In this analysis, I’ll be reviewing the FET coin — one of the popular projects in the AI space.
✔️ This project’s token currently holds a market cap of $1.75 billion and ranks 48th on CoinMarketCap.
⏳ 4-Hour Timeframe
On the 4-hour chart, we can see an uptrend in place. However, in its latest leg up to 0.923, the trend has weakened significantly and lost momentum.
💥 After getting rejected at 0.923, the price saw a deep correction down to 0.718 and failed to form a higher low — a clear sign of weakness in the bullish trend.
🔍 The 0.718 level is a crucial support, and breaking below it could trigger a long-term short position targeting 0.639.
✨ A confirmation for this short setup would be an RSI drop into the oversold zone along with increased selling volume. For now, sell volume is low and offers no confirmation yet.
🔔 On the long side, if the 0.764 level is broken, we can consider that 0.718 has held as support, allowing for a potential long entry.
🧩 In my view, even if this trigger activates and the price moves higher, it’s likely to form a lower high or retest the 0.923 level without breaking it. A breakout beyond 0.923 seems unlikely for now.
📈 For the long setup, RSI confirmation would come with a break above 42.05. As market volume is still declining, we’ll need to wait for increased buy volume to strengthen the bullish case.
📝 Final Thoughts
This analysis reflects our opinions and is not financial advice.
Share your thoughts in the comments, and don’t forget to share this analysis with your friends! ❤️

Fet (Daily) Elliot Wave ii underway after ending diagonalFetch appears to have completed a motif wave (1) with an ending diagonal after finding a bottom at the major support high volume node (HVN) macro wave 4.
Wave 2 has not retraced as deep as other alt coins showing strength in the move up. The downside target is just above the wave (1) swing high, the 0.618 Fibonacci Retracement.
Wave 3 should be a powerful move up taking price into all time high.
Failure to hold this support could see price heading back to fresh lows and testing the $0.35 HVN once more.
Safe trading

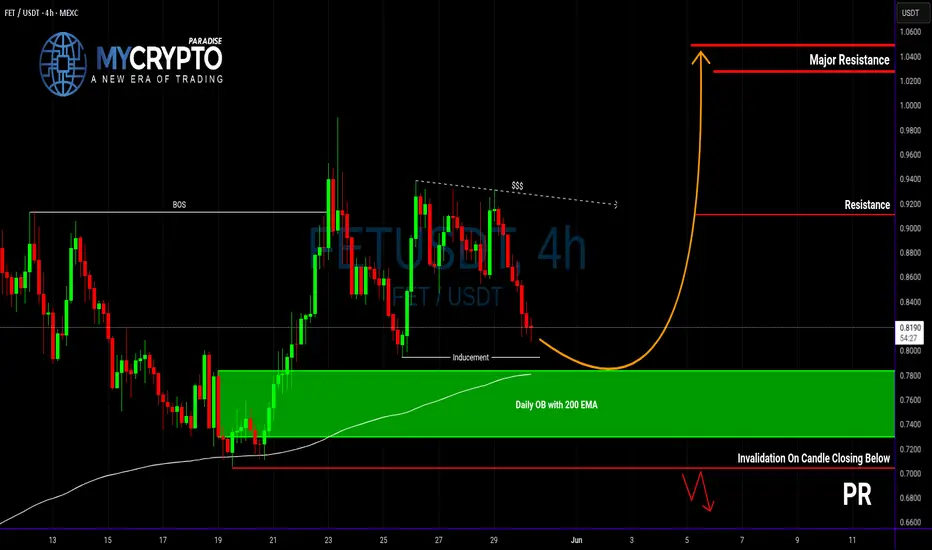
FET at a Make-or-Break Level... Will It Bounce or Break Down?Yello Paradisers, are you watching FET closely right now? If not, you might miss a textbook high-risk, high-reward setup that could play out very soon—just like we’ve been anticipating in our previous updates.
💎FETUSDT is currently respecting a bullish market structure, and price action is aligning for a potential inducement grab.
💎If this inducement occurs, and we start to see bullish confirmation signals from the Daily order block, backed by the 4H 200 EMA, then the probability of a strong bounce increases significantly. From a risk-reward perspective, this zone is shaping up to offer a solid long entry with clean invalidation.
💎But here’s the other side of the coin: if the price breaks down through the order block and closes a candle below our invalidation level, the bullish bias will be completely invalidated. In that case, patience becomes the strategy, and we’ll be waiting for more convincing and clearer price action to realign with a new setup.
🎖Strive for consistency, not quick profits. Treat the market as a businessman, not as a gambler.
MyCryptoParadise
iFeel the success🌴
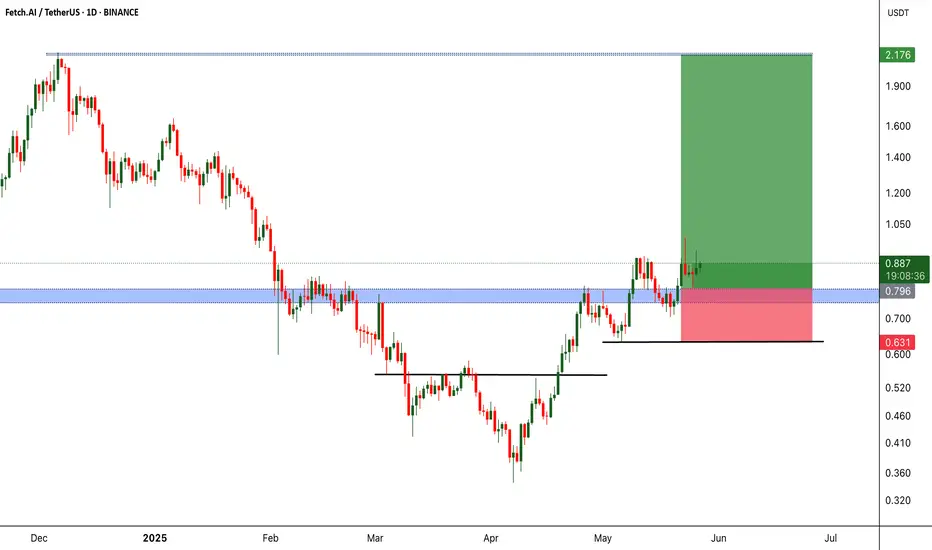
FETUSDT Major Resistance Cracked, Eyes on Sky!BINANCE:FETUSDT has recently broken out from a significant resistance level that previously acted as a strong barrier. After this breakout, the price action displayed a textbook retest of the former resistance—now turned support which held firm, confirming the bullish move.
This successful retracement signals strength in the current uptrend and opens the door for potential continuation towards higher highs. The market structure is showing signs of higher lows and increasing momentum, which could fuel a strong rally in the near term.
While the setup looks promising, it’s essential to emphasize risk management. Always use a stop-loss to protect your capital and manage your position sizing according to your trading plan. The crypto market can be volatile, and smart risk control separates long-term winners from short-term chasers.
All eyes are now on NYSE:FET for its next move. If momentum continues, we could witness a significant upward leg. Stay sharp and let the trend be your guide!
BINANCE:FETUSDT Currently trading at $0.88
Buy level : Above $0.8
Stop loss : Below $0.63
Target 1: $1.1
Target 2: $1.4
Target 3: $2.1
Max leverage 3x
Always keep stop loss
Follow Our Tradingview Account for More Technical Analysis Updates, | Like, Share and Comment Your thoughts
The key is whether it can find support near 0.846 and rise
Hello, traders.
If you "Follow", you can always get new information quickly.
Have a nice day today.
-------------------------------------
(FETUSDT 1D chart)
The M-Signal indicator on the 1M chart is abnormal, so the key is whether it can hold the price.
If the price is maintained above the M-Signal indicator on the 1M chart, it is highly likely that the upward trend will continue in the medium to long term.
Accordingly, we should check whether it can be supported and rise around 0.846.
If it fails to rise, the support range is expected to be around 0.424-0.534.
-
When the rise begins,
1st: 1.194
2nd: 1.556
Responses are required depending on whether there is support around the 1st and 2nd above.
The 1.194 point corresponds to the support and resistance range in the candle arrangement.
-
Thank you for reading to the end.
I hope you have a successful transaction.
--------------------------------------------------
- This is an explanation of the big picture.
(3-year bull market, 1-year bear market pattern)
I will explain more details when the bear market starts.
------------------------------------------------------

$FETUSDTHere's a clearer and more polished version of your statement:
My projection for FET is that it will rise to around $1.569 before facing any significant correction. After this correction, I expect the price to resume its upward rally.
Not a financial advice. Trade at your own risk!
