FET

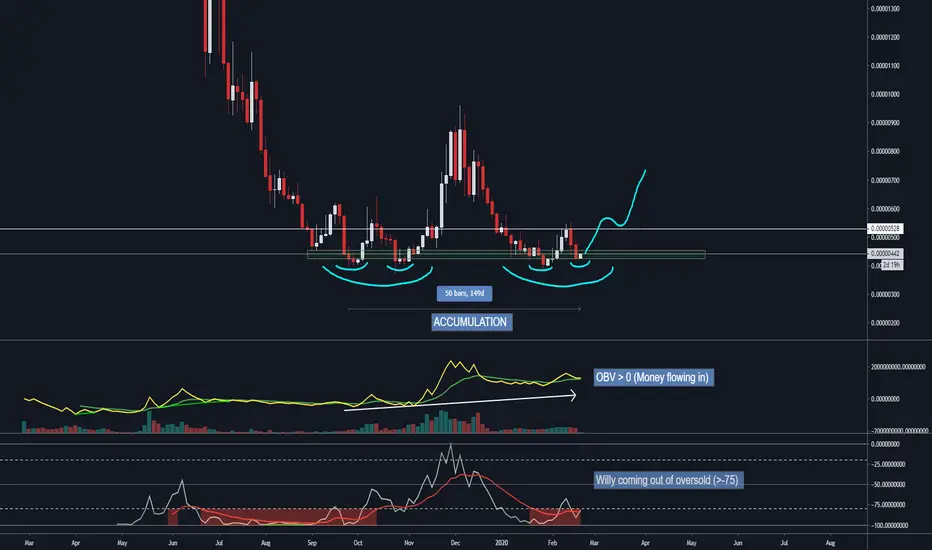
FET/BTC - Final stages of accumulationWhen we look back at any chart and think to ourselves "Gee, I wish I was buying down there..." we often assume that we'll capitalise on any future opportunities "next time" with zero hesitation. Unfortunately, this isn't the case because instinctively we want to buy when we're "sure" something will go up. By the time we're sure, you can bet everyone else is too! Your bids then function as nice liquidity for the astute accumulators to dump in to. Better luck next time.
To me, FET looks like it's in the final stages of accumulation. Or... in the "I wish I bought" zone prior to explosive price movement. This offers a nice risk/reward for a long(er) term swing trade.
My reasoning:
Structure: Weekly W. In fact, we're putting in double bottoms within double bottoms.
Location: Self explanatory, purchasing within the green box is a solid entry.
Healthy OBV and Willy coming out of oversold.
Hit the LIKE button if you find my analysis valuable and want to support me. Follow to make sure you don't miss any future trade ideas.

FET/BTC BINANCE4H candles
as far as price is in the uptrend parallel channel
we have bullish movement
nice volume
MACD turning bullish

Fetch.AI [FET] : Upto 100% Profits Opportunity.#Accumulation_Recommendation
Pair : #FET / #BTC
Accumulation Area : 440 sats - 480 sats
Distribution Targets :
Short Term :
🎯 Target 1 : 536 sats
🎯 Target 2 : 609 sats
🎯 Target 3 : 677 sats
Mid / Long Term Targets
🎯 Target 4 : 745 sats
🎯 Target 5 : 841 sats
🎯 Target 6 : 964 sats+
Stop Loss : 389 sats
Invest: 3%
Risk/Reward: 15% / 100%

FET / BTC | Entry for ProfitsFET showing strong accumulation nature;) may breakout the resistance within few days and make 16-20% profits. Looking for entry on local retracement. SL below blue zone.
FETCH USD new wave up looks likelyFET has been in a down trend since its launch. The price is currently sitting below the moving average on the longer time frame charts (this is the 4 day chart)
However the price action is going sideways and slowly rising and has started to approach the EMA (Length 20)
Potential for at least 60% gains (resistance at the slower moving average (Length 50).
Trend lines on chart show support and resistance levels. We are close to crossing over major resistance channel and it could indicate a reversal in which case longer term targets could be as high as 700%.
RSI and Stoch RSI also show momentum is starting to swell upwards
Set stop loss and trade wisely, trade is marked on the chart with the long position.

FET/USDT, BEARISH BAT LEG UP, 150% POTENTIALThe structure on the btc pairing keeps breaking down due to BTC's recent volatility but the USDT pairing has been steadily rising and the bearish bat formation staying intact.
I AM NOT A FINANCIAL ADVISER, DO YOUR OWN RESEARCH!

FET/BTC(UPDATE), BULLISH SHARKBtc pump broke down the last structure dropping it in btc value, this is what I am seeing now.
I AM NOT A FINANCIAL ADVISER, DO YOUR OWN RESEARCH!


LONG - FET - Trading OpportunityExpecting BINANCE:FETBTC to soon make a break above the MA200, as an uptrend seems to have started with multiple bullish crosses on certain MAs.
Along with being one of the few alt coins that hasn't seen much of a pump yet this alt season.
Entry: 0.00000448
Target 1: 0.00000492
Target 2: 0.00000519
Target 3: 0.00000569
SL: 0.00000427
CryptoCue is not providing investment advice and is not taking subscribers’ personal circumstances into consideration when discussing investments. Investment involves a high degree of risk and should be considered only by persons who can afford to sustain a loss of their entire position.
CryptoCue is not registered, licensed or authorized to provide investment advice and is simply providing an opinion, which is given without any liability or reliance whatsoever. The information contained here is not an offer or solicitation or recommendation or advice to buy, hold, or sell any security. CryptoCue makes no representation as to the completeness, accuracy or timeliness of the material provided and all information and opinions provided by CryptoCue are subject to change without notice and provided on a non-reliance basis and without acceptance of any liability or responsibility whatsoever or howsoever arising. You hereby irrevocably and unconditionally waive, release and discharge: (a) any and all accrued rights and/or benefits you may have against CryptoCue in respect of any opinion expressed or information conveyed by CryptoCue at any time; (b) any and all Claims you may have against CryptoCue arising out of any opinion expressed or information conveyed by CryptoCue at any time; (c) CryptoCue from all and any claims (whether actual or contingent and whether as an employee, office holder or in any other capacity whatsoever) including, without limitation, Claims you may have against CryptoCue arising out of any opinion expressed or information conveyed by CryptoCue at any time. ("Claims" shall include any action, proceeding, claim, demand, judgment or judgment sum of whatsoever nature or howsoever arising.) You hereby agree to indemnify and hold harmless CryptoCue in respect of any and all Losses paid, discharged, sustained or incurred by CryptoCue in the event of bringing any Claim against CryptoCue. (“Losses” shall include any and all liabilities, costs, expenses, damages, fines, impositions or losses (including but not limited to any direct, indirect or consequential losses, loss of profit, loss of earnings , loss of reputation and all interest, penalties and legal costs (calculated on a full indemnity basis) and all other reasonable professional costs and expenses and any associated value-added tax) of whatsoever nature and/or judgment sums (including interest thereon).

$FET, R/S Flip to reclaim ATL BTC support..$FET
R/S Flip to reclaim ATL BTC support..
Would expect some bounce/continuation to ~460 sats from here..
#FET


LONG - FET - Trading OpportunityNice 1D bullish divergence, and as the market is now having a break from BTC uptrend maybe this gets some upside as well.
Entry: 0.00000407
Target 1: 0.00000451
Target 2: 0.00000484
Target 2: 0.0000522
SL: 0.00000389
CryptoCue is not providing investment advice and is not taking subscribers’ personal circumstances into consideration when discussing investments. Investment involves a high degree of risk and should be considered only by persons who can afford to sustain a loss of their entire position.
CryptoCue is not registered, licensed or authorized to provide investment advice and is simply providing an opinion, which is given without any liability or reliance whatsoever. The information contained here is not an offer or solicitation or recommendation or advice to buy, hold, or sell any security. CryptoCue makes no representation as to the completeness, accuracy or timeliness of the material provided and all information and opinions provided by CryptoCue are subject to change without notice and provided on a non-reliance basis and without acceptance of any liability or responsibility whatsoever or howsoever arising. You hereby irrevocably and unconditionally waive, release and discharge: (a) any and all accrued rights and/or benefits you may have against CryptoCue in respect of any opinion expressed or information conveyed by CryptoCue at any time; (b) any and all Claims you may have against CryptoCue arising out of any opinion expressed or information conveyed by CryptoCue at any time; (c) CryptoCue from all and any claims (whether actual or contingent and whether as an employee, office holder or in any other capacity whatsoever) including, without limitation, Claims you may have against CryptoCue arising out of any opinion expressed or information conveyed by CryptoCue at any time. ("Claims" shall include any action, proceeding, claim, demand, judgment or judgment sum of whatsoever nature or howsoever arising.) You hereby agree to indemnify and hold harmless CryptoCue in respect of any and all Losses paid, discharged, sustained or incurred by CryptoCue in the event of bringing any Claim against CryptoCue. (“Losses” shall include any and all liabilities, costs, expenses, damages, fines, impositions or losses (including but not limited to any direct, indirect or consequential losses, loss of profit, loss of earnings , loss of reputation and all interest, penalties and legal costs (calculated on a full indemnity basis) and all other reasonable professional costs and expenses and any associated value-added tax) of whatsoever nature and/or judgment sums (including interest thereon).

FET/BTC (smaller TFs), 23% potential from CPI shared my idea on the bright looking monthly chart, this is a shorter term view for me. It has its 3 bottom trend-line touches typical of a falling wedge and if current low hold, it should be making its leg up for the harmonic. I AM NOT A FINANCIAL ADVISER, DO YOUR OWN RESEARCH!

FET/BTC, BULLISH SHARK (MONTHLY TF), POTENTIAL 80%+I will have to watch here, if we don't close a complete candle below the harmonic,it should be a great move up, if it doesn't hold the bullish shark can extend to 1.13 fib which would be a decent sized dip.
I AM NOT A FINANCIAL ADVISER, DO YOUR OWN RESEARCH!

$FET, UCTS Buy signal on the 12H as it crosses over ~460 sats$FET
UCTS Buy signal on the 12H as it crosses over ~460 sats resistance level..
Both MACD & OBV bullish divergences..
Volume looks low for now..
Aim for an entry at potential support (R/S Flip?) for a better risk management..
#FET

Fetch.AI About To Move, Looks Like Very Soon...We looked at FETBTC in the past and our charts/trades came out very successful... I just looked at Fetch.AI recently on Jan-13, this chart is getting ready to move.
The chart changed compared to the one I published recently but the setup is the same. We have a higher low and a retrace that is reaching its end.
The first move will be strong, we will see around 20-40% in one or two candles and then we let it develop, but I believe there will be bouts of strong growth followed by long periods of retrace/correction before another strong/sudden move, it is all done to catch people off guard.
Anyways, this one looks pretty bullish to me and might move soon... Keep an eye out. Thanks for your support.
Namaste.

LONG - FET- Trading OpportunityFalling wedge confirmed by a bullish divergence on the 1d chart.
Entry: 0.00000445
Target 1: 0.00000492
Target 2: 0.00000538
Target 3: 0.00000587
SL: 0.00000417
CryptoCue is not providing investment advice and is not taking subscribers’ personal circumstances into consideration when discussing investments. Investment involves a high degree of risk and should be considered only by persons who can afford to sustain a loss of their entire position.
CryptoCue is not registered, licensed or authorized to provide investment advice and is simply providing an opinion, which is given without any liability or reliance whatsoever. The information contained here is not an offer or solicitation or recommendation or advice to buy, hold, or sell any security. CryptoCue makes no representation as to the completeness, accuracy or timeliness of the material provided and all information and opinions provided by CryptoCue are subject to change without notice and provided on a non-reliance basis and without acceptance of any liability or responsibility whatsoever or howsoever arising. You hereby irrevocably and unconditionally waive, release and discharge: (a) any and all accrued rights and/or benefits you may have against CryptoCue in respect of any opinion expressed or information conveyed by CryptoCue at any time; (b) any and all Claims you may have against CryptoCue arising out of any opinion expressed or information conveyed by CryptoCue at any time; (c) CryptoCue from all and any claims (whether actual or contingent and whether as an employee, office holder or in any other capacity whatsoever) including, without limitation, Claims you may have against CryptoCue arising out of any opinion expressed or information conveyed by CryptoCue at any time. ("Claims" shall include any action, proceeding, claim, demand, judgment or judgment sum of whatsoever nature or howsoever arising.) You hereby agree to indemnify and hold harmless CryptoCue in respect of any and all Losses paid, discharged, sustained or incurred by CryptoCue in the event of bringing any Claim against CryptoCue. (“Losses” shall include any and all liabilities, costs, expenses, damages, fines, impositions or losses (including but not limited to any direct, indirect or consequential losses, loss of profit, loss of earnings , loss of reputation and all interest, penalties and legal costs (calculated on a full indemnity basis) and all other reasonable professional costs and expenses and any associated value-added tax) of whatsoever nature and/or judgement sums (including interest thereon).


$FET, Retesting ~460 sats support...$FET
Retesting ~460 sats support as it broke from descending trendline on the 1D
Looking for a bounce signals from this level, as UCTS is starting to turn green on LTF
Volume is low for now but starting to rise
If happens, massive room with 1st target at ~600sats (30%)
#FET

$FET - Breaking Falling Wedge$FET breaking the falling wedge
Volume is increasing
Bottom triangle is in retest

Fetch.AI Breaks Falling Wedge | Bullish View Mapped + TargetsFetch.AI (FETBTC) just broke out of a falling wedge and is now trading above EMA10... We are looking at the bullish scenario here.
Prices for FETBTC peaked in early December, a strong correction followed and after a higher low the 0.786 Fib. retracement support for the last bullish wave has been conquered.
Now let's take a look a the MACD:
Here we have a bullish cross and the histogram now going green.
The RSI is also trending up:
Conditions for change
The above signals look pretty good but there isn't enough volume... Charts are always changing and all scenarios remain possible at all times. If prices for FETBTC go lower and close below 0.00000430, the above bullish scenario becomes invalid and a new analysis is needed. Going below the above level would turn this chart bearish.
Thanks a lot for reading.
Remember to hit LIKE for more articles, trades, and to show your support.
Namaste.
