Update on previous post, $FET looks great!Fet has broken out and retested the trend support. Nice bounce, retesting resistance. The chart also shows massive buy volume pushing the price above $1 before being brought down. There are some clearly massive buyers here. Keep a very close eye on $FET its time may be here shortly. Zoom out on the USDT along with the BTC pairs, it looks great.
Don't miss these prices. Clear use cases and lots of space to grow!
FETBTC

$FET will follow $CELR $MATIC $ONE
it's don't matter first or second way - we all know that in this bull run $FET price will reach at least 1.75$ first, and 10$ after
JUST HODL

fetch.ai $fet idea, symmetrical triangle looking for volume.Fet seems to be bouncing in this support and resistance channel. Holding trendline well looking for a bounce. If it breaks the trend and retests there should be no reason it doesn't fly. Scoop the dip. 1st Target around $1

FET at the apex of the triangle! Keep an eye on this one!Here's a quick Look at FET 8 hr chart. As we can see, the price has been forming a bigger symmetrical triangle and we could see a bigger break to the upside soon - the triangle ends in few days!
The best entry would be, when the price breaks above the symmetrical triangle with good amount of volume .
-------------------------------------------
The idea is: Buy the breakout from the symmetrical triangle and take profits at the levels shown in the chart.
Targets:
1. 0.82$
2. 0.885$
3. 0.97$
4. 1.03$
-------------------------------------------
What are triangles when it comes to trading?
Key points:
"1. In technical analysis , a triangle is a continuation pattern on a chart that forms a triangle-like shape.
2. Triangles are similar to wedges and pennants and can be either a continuation pattern, if validated, or a powerful reversal pattern, in the event of failure.
3. There are three potential triangle variations that can develop as price action carves out a holding pattern, namely ascending, descending, and symmetrical triangles."
-------------------------------------------
If you like the content, then make sure to comment and like the post :D
Follow me for daily profitable trading setups
BTC dictates the market. If BTC falls, then Alts will fall as well. Trade safe!

FETUSDT Technical Analysis⏳ Spot
💎 FETUSDT has formed a symmetrical triangle. The price has got rejected by the resistance line. After the break and retest it is expected that the price goes higher
🌐 Tradingview
🏁 Short & Medium Term
💵 Invest Only 5% of your Portfolio
🎳 Entry at Market or at 0.7600 - 0.7200
☕️ TP1 0.8500
🍺 TP2 0.8800
🍻 TP3 0.9500
🍾 TP4
🍷 TP5
🍸 TP6
🍹 TP7
🎁 TP8
🚫 SL 0.6500
Good Luck 🎲
Check the Links in Description and If you LIKE this analysis, Please support our page and Ideas by hitting the LIKE 👍 button. ❤️ Your Support is really appreciated! ❤️
Traders, if you have your own opinion about it, please write your own in the comment box. We will be glad for this.
Feel free to request any pair/instrument analysis or ask any questions in the comment section below.
We will have more FREE forecasts in TradingView soon
Have a profitable day 😊👍🏻

Falling Wedge is in Control of FET/BTC #FET $FET Here you can clearly see we are in a Falling Wedge - but this will break Bullish because it's part of a Bullish continuation in an uptrend on our FET daily chart . We are very near the end of this wedge structure and will be breaking upwards from it . Notice there is very low volume now near the end of this wedge - that is actually confirmation of our wedge . A big volume burst should happen on breakout - and it's very possible there will be retest of that line after breakout . But then we should continue back up at least to the previous recent highs - and beyond . By the end of October this should be going up again.
Of course our previous triangle structure got invalidated - that happens sometimes - but this Wedge seems valid and I believe this will play .

FET looks like testing broke resistanceYOUR LIKE OR COMMENT IS MY FUEL FOR NEXT ANALYSIS :) IF U HAVE ANY QUESTION REACH ME HERE
This is not a financial advice. Always do your own research and always put stoploss in your trade (SL) :) If you want more detailed info how to study and read charts or just need help with some coin, just write to me here a comment, i will try to answer to everybody... i can help you :) all for free, don't worry, BE HAPPY!

FET/USDT 4HOURS UPDATE Welcome to this quick fet/usdt analysis.
I have tried my best to bring the best possible outcome me in this chart.
Reason of trade :- FET/USDT Broke out of the triangle and retesting.Expecting 30% to 40% soon.
Entry:-cmp or more in dip
Traget:-
T1:- 0.8803
T2:- 0.9478
T3:- 1.0195
T4:- 1.1202
Stoploss:- 0.7167
Remember:-This is not a piece of financial advice. All investment made by me is under my own risk and I am held responsible for my own profit and losses. So, do your own research before investing in this trade.
Happy trading.
Sorry for my English it is not my native languages.
Do hit the like button if you like it and share your charts in the comments section.
Thank you...

Symmetric Triangle Appears FET/BTC #FET $FET #FetchAIHere we see our FET 12 hour chart and boy we see quite a pullback ! We're now under 1400 . But if you see those black lines on my chart it does look as if we are forming a symmetric triangle shape . Now a chart pattern like that can break upwards or downwards - and by approximately the same amount as those purple lines show (which is the length of the rise near the start of the pattern . ) I expect a break upwards towards the 2900 / 3000 area since a break down out of this pattern would take us to 200 sats area ! And I definitely don't see that coming ! So I say this breaks Bullish . Again many charts look similar with the pullbacks and the MAs but big pullbacks also mean big rises will come . This has possibly been a shakeout situation but there's always big swings in a Bullrun year and I've been expecting some crazy moves so I'm good ! Now a symmetric triangle pattern shouldn't actually play out to the very tip or end of that black triangle . It should choose a direction and break away before we get to the end of the pattern ( I expect a break upwards . ) Also some people might see this as more of a pennant but I disagree since there is not technically a flagpole here and you can't have a pennant without a flagpole . So I say it's a symmetric triangle . Also you can see that pink and blue band we're in ? That's a regression trend channel . And we've definitely wicked to the bottom pink part of it ( as well as hitting a TD Sequential 9 in red on our daily chart . ) So I really expect a turnaround and I expect it soon . This weekend could be interesting but by next week I think this will be on it's way up again .


Trade idea for FETHere's a quick Look at FET 4 hr chart. As we can see, the price has been rejected 3 times from the trendline and the best entry would be, when the price breaks above the trendline with good amount of volume. Definitely one to keep an eye on.
October is believed to be bullish according to S2F model and historically!
-------------------------------------------
The idea is: Buy the breakout from the trendline and take profits at the levels shown in the chart.
Targets:
- Profits can be taken in the resistance zone .
1. 0.875$
2. 0.945$
3. 10.3$
-------------------------------------------
If you like the content, then make sure to comment and like the post :D
Follow me for daily profitable trading setups
BTC dictates the market. If BTC falls, then Alts will fall as well. Trade safe!

fet/btc next move fet/btc bull flag and cup and handle formation available. target price range 2500-2600 satoshi. rsi and macd at the reception point for upward movement.
is not investment advice.

FET is on a mega bull mission to the moonFETUSD has currently hit some key resistance and isn't the most beautiful chart out there, but FET has kept going up and up slowly. It has kept going back to retest all key breakout levels and then go back up again. Fetchai's market cap is currently at 590M USD, and it's inflation since launch seems to have been quite large (800%). FET was the first Binance IEO and it launched right at the bottom of the 2018 bear market. The initial ROI was very good for the investors, but then kept dumping relentlessly...
Below I have several charts, and I will start with FETBTC as it is the most important one. What we see is an extreme capitulation, where FET fell >98% in USD and BTC terms. It's key capitulation happened in March 2020 were it dumped way harder than many other coins. Only coin with a very similar chart and a very similar dump on that day was Fantom, which you probably already know how well it has performed recently.
So FTM has done very well, but so has CELR which was the second Binance IEO, as well as POLY which was added on Coinbase the same day FET did and it had a huge spike a few weeks after its addition. So overall FET has shown a lot of strength, especially compared to the majority of the market. It's fundamentals are strong with the Metallex airdrop and the relatively new 2.0 mainnet launch playing a role in its massive bullishness.
So what's next? In my opinion over time FETBTC will get above 8000 sats, but in the short term the first key resistance is about 4500-5000 sats and I believe the final top over the next few months will be in the 8000-12000 zone. Short term there are many variables like what is Bitcoin going to do and how bad things could get on a macro level (regulations, stocks dumping etc).

$FET, Nice 2D bar pushing 30% from the lows $FET
Nice 2D bar pushing 30% from the lows
Still I would like to see stronger volume/continuation as signal of true recovery (instead of DC bounce)
UCTS remaining bullish on the 2D so my bot on 3commas will keep the position for now (~120% since July end)
#FET

FETCH FET / BTC idea to watchIn this case price formed triangle shape, which can be bearish, and considering placement of this shape I think chances for breakdown are higher.
This shape is also found in Wyckoff Distribution models.
Looking for targets near 1500 sat
USD target can be found on pic below:
Best regards
Artem Shevelev

Higher Breakout FET/BTC #FET #FetchAI $FETHere we see our FET daily chart from Bitfinex and you can clearly see this pullback is a Bullflag ! Shown in-between those black lines . The purple lines show the length of the flagpole on our last rise up that took us to 2500 area . That flagpole was at least 1200 sats high and when we break out of this Bullflag we will be going up by at least that much upwards . So if we break out near 2200 sats, give or take - we should then be targeting 3200 to 3400 area , and possibly higher ( I won't be surprised if we wick to 3700 area . ) But 3200 is a strong weekly resistance , and 3400 is the .236 fib of our full fibs on the Binance chart so I expect to hit resistance there . At any rate this looks great and will continue to do well the rest of 2021 , at least .

$FET - Wonder where this is headed...Here's a simple Fetch.ai chart. Just lines. Anyone wanna guess where its headed?
I'm certainly not shorting it right here....

Extremely Bullish on Fetch AILeave indicators, just see the chart.
Fetch has habit of flipping major resistance into major support for next leg up
I am long on this despite this flash dump
Flex Your Muscles FET/BTC #FET $FET #FetchAIWow ! Look at that huge candle up on $FET ! I had predicted 1920 as a target area before and we hit that target last night ! As you can see we are now inside that light purple line of our colorful Gann Fan indicator . Below us the bottom of that line ( 3/1 on the Gann) is basically at 1550 sats which was our previous resistance . In other words we may have just flipped our resistance into a support ! I suspect that is the case but it's always possible to retrace below there at some point but for now all looks good . Above us the top of that line ( 2/1 on the Gann ) is around 2150 - we may hit there and then cool off a bit but notice that target symbol on my chart ? That's also showing you the 1.618 fib which is at 2398 . So we may see that target soon as well , Above that you see a green checkmark which is also near our strong weekly resistance area near 3200 - and that won't be easy to break through . I suspect we get there by Halloween but may retrace hard before we break up from there ( no doubt Bitcoin will be going for higher highs too ! ) Anyway I still think FET is playing within a Gann Fan and will see 5400 sats in December . Right now FET is flexing it's muscles !

FETBTC Sağlam bir direnç bölgesi aşıldı.Haftalık mumu 0.00001550 üzerinde kapatırsa 0.00002725 ilk satış yerim olur.

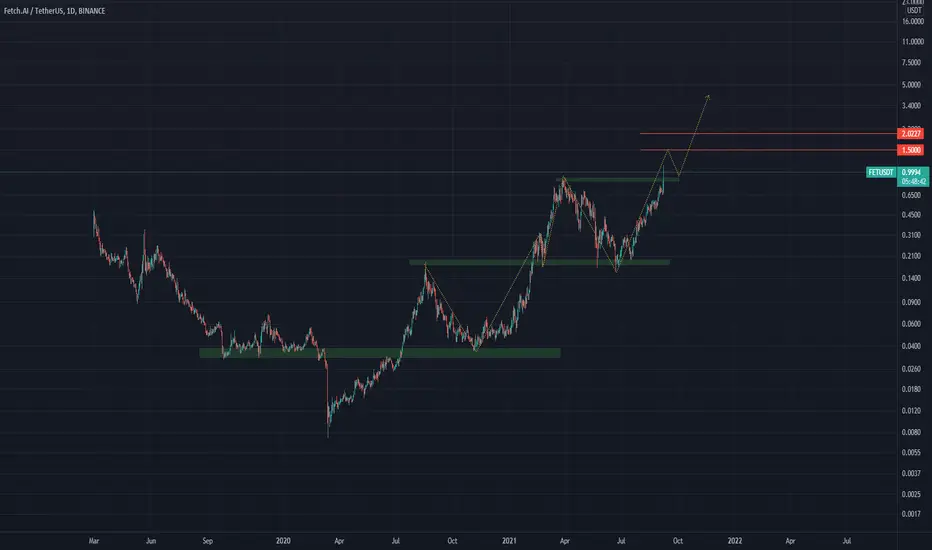
Fetch.AI FETUSDT - Bullish rectangle consolidation- Fetch.ai - FET - Rank #122.
- On the chart can see a bullish rectangle consolidation.
- Which is currently breaking out!
- FET Is prepared for another pump very soon!
- For expected duration of the trade, probability, stop loss, profit target, entry price and risk to reward ratio (RRR) - please check my signature below ↓
- If you want to see more of these ideas, hit "Like" & "Follow"!

Fetch.AI FETUSDT - New All time high soon! + Elliott Wave- Fetch.ai - FET - Rank #122.
- As per my Elliott Wave count, we are currently in the 5th wave, which can be huge!
- Also, we have an Ascending parallel channel with total 7 touches.
- FET Is prepared for another pump very soon!
- For expected duration of the trade, probability, stop loss, profit target, entry price and risk to reward ratio ( RRR ) - please check my signature below ↓
- If you want to see more of these ideas, hit "Like" & "Follow"!

