#FET/USDT#FET
The price is moving in a descending channel on the 4-hour frame upwards and is expected to continue
We have a trend to stabilize above the moving average 100 again
We have a bearish trend on the RSI indicator that supports the rise by breaking it upwards
We have a support area at the lower limit of the channel at a price of 1.28:
Entry price 1.40
First target 1.54
Second target 1.68
Third target 1.83
Fetch

FET the leader of AIFET / USDT
FET is the leader of AI coins … since the start of this bullish wave the ai coins were sleeping until yesterday we saw strong surge in their price
This movement made me take a look again at FET
Currently breaking out of major downtrend
In past when price was making a major breakout like this either it continues to fly hard or consolidate for few weeks then fly
The previous ATH (march high is main target) after that from 5-9$ is possible as second target

FETUSDT - promising chart with ,2 conditionsWeekly chart looks promising for longterm
Actually fet already at the bottom
As is clear, the previous rise Two important conditions are met to achieve more than 1400% in bullish rally (Fibonacci target 1.618)
Breaking the 0.618 Fibonacci level
and the falling wedge pattern on the weekly frame.
The same thing is happening now!
, as you can see It only needs a weekly close above the triangle pattern, 0.618 with a huge green candle, and its target is 600%. (1.618 Fibonacci)
Do not forget that FET is a currency with a strong project and the leading currency in the field of AI
Price now at the real bottom
Best regards Ceciliones 🎯

FETUSDT.P It's simple, but it's the best demand zone we have. It wouldn't be foolish to try our luck from here.
Fet has all the AI hype needed to rally in the new market cycle.
My Previous Ideas
DOGEUSDT.P | 4 Reward for 1 Risk much more if you hold it.
RENDERUSDT.P | HTF Accuracy
ETHUSDT.P | Accurate Buyer Zone Identification | High Risk Reward if you hold it.
BNBUSDT.P | Accurate Buyer Zone Identification | High Risk Reward if you hold it.
Bitcoin Dominance | Great Characteristic Detection and Accurate Analysis

Why FET/USD looks like ETH/BTC ??noticed this this morning maybe there is a very simple explication, feel free to share it,
I'm not a pro charter so I'll not be able to put the pic of ETH/BTC directly on the chart but here is it
timeframes are different but there remains proportionals
it's a pattern that consists in :
- a vertical move (early 2024 for FET, early 2016 for ETH)
- a distribution that bring us to a higher low from before that vertical move (Low for FET was 6 august 2024, for ETH/BTC early September 2019)
- a move up that create a inverse H&S, that distribution is the left leg
- another distribution from that previous move that finished this month for both pairs, yesterday was THE low for ETH/BTC if my whole idea is working, it was a local low for FET/USD but this one touched the channel where FET is evolving + it's a 0.5 fib retracement from previous move up
TP 15???¿

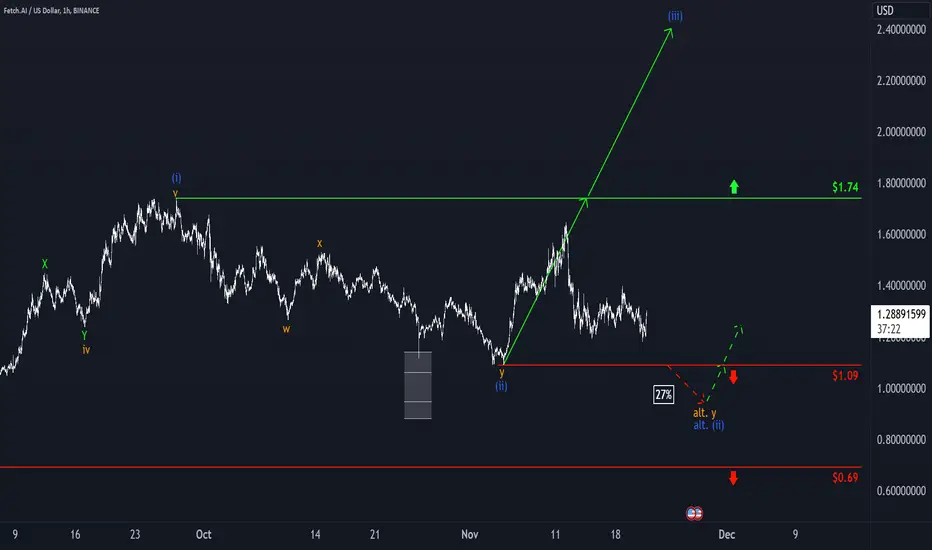
Fetch: Bearish PressureFET experienced significant bearish momentum over the past seven days. We interpret this movement primarily as part of the substructure of blue wave (iii). Consequently, we expect the coin to recover and climb above the resistance level at $1.74. However, if it falls below the support level at $1.09 (27% probability), we will have to anticipate a deeper low of blue wave alt.(ii).
FET | ALTCOINS | TOP ALT for coming ALTSEASONFETCH was one of my TOP altcoins for 2024, and has seen some more increases since my lst update. (Find the previous update here :)
THIS is the initial introduction to FETCH in January, when I identified this as a good buy for 2024:
I'm optimistic for the remainder of 2024; FETCH and other alts will see great increases as soon as BTC takes a breather and trades sideways for a few days.
_______________________
BINANCE:FETUSDT

$FETUSDT Heating Up for a Major Breakout!BINANCE:FETUSDT recently experienced an unsuccessful breakout from an inverse head and shoulders pattern, followed by a consolidation phase. Now, it’s forming a bullish channel and showing signs of strength, indicating that a significant upward move may be on the horizon.
As always, remember to use a stop loss and invest only a small portion of your capital to manage risk effectively.
BINANCE:FETUSDT Currently trading at $1.29
Buy level: Above $1.27
Stop loss: Below $1.05
TP1: $1.5
TP2: $1.75
TP3: $2.5
TP4: $3.5
Max Leverage 3x
Follow Our Tradingview Account for More Technical Analysis Updates, | Like, Share and Comment Your thoughts

Fetch: Low set!We now view Fetch in the same-colored wave 3, which should lead it above the $1.73 resistance. With the Target Zone deactivated, investors could move stop-losses closer to the entry price. Stops could protect against our alternative scenario (33% likely), which implies a lower low of green wave alt.2.

Fetch AI AnalysisFetch AI is doing a pretty good inverted head and shoulders pattern. As a big investor of FET I feel like we're going to hit $1.53 as long as we're not below $1.37.

FET (will hold the retest area?)FET / USDT
Price is in interesting area which is the retest zone after breakout of 6 months downtrend!
For short term rally price must hold above current zone
Time for bulls to show themselves here or else the price will drop to HTF support again

Fetch: Home StretchFET has sold off as planned over the last seven days, reinforcing our primary assumption that the final subwave of wave 2 in green is currently unfolding. To catch the low of this movement, we’ve added a green Target Zone onto the chart; it ranges from $1.14 to $0.8810. Investors could enter long positions there, with stops placed about 1% below the lower edge or at the support level of $0.80. Once the low is confirmed, we anticipate a rise above the resistance at $1.73. However, if this level is breached earlier (38% probability), we will already place the coin in the green wave alt. 3.

FET 1.724 Long The coin enters the bullish zoneFET 1.724 Long The coin enters the bullish zone
The coin enters the bullish zone needs to break through 200ma
Entry pattern breakout
First target 1.862
Second target 2.059
Third target 2.224
Coin is volatile leverage 10-20x max!
Stop short

FETCH AI - Bullish Pattern : Inverse H&SThere's a few reasons to be bullish on FETCH right now:
👉 Bullish pattern in the daily timeframe; inverse Head and Shoulders
👉 Daily TF price is trading ABOVE 200 day moving averages - bullish technical indicator
👉 Support zone retested and held
👉 Great pick for TOP AI Coins 2024
I'd be watching the Fibonacci zones as potential targets for the next impulse wave up, given BTC will likely lead us there.
___________________________
BINANCE:FETUSDT

FET ready to sky rocket ?Hi everyone
I see FET is ready to sky rocket and make a new All Time High, this is my analysis for a Long term trade.
Note : Please follow your strategy, this is just my idea and i will gladly see your ideas in this post.
Don't forget to put STOP LOSS for your position, remember STOP LOSS is the key of consistency trading for long term.

Fetch.AI Symmetrical Triangle SetupFET has formed a symmetrical triangle on higher time frames, indicating that a breakout is coming and which will help us understand whether bears or bulls will dominate in the near future.
The price is reacting to the weekly SMMA and due to the confluence with some previous supports, the $0.80 level is very strong and can support the price, the RSI is also in the oversold region.
If the price breaks the triangle to the upside with confirmation, I will open a long trade, I think this is the most likely scenario, with the first target at $1.48.
However, be prepared for both scenarios, because if the price breaks the triangle downwards, it is because the downtrend is still strong and it will be a bearish setup.

#FET/USDT#FET
The price is moving in a descending channel on the 4-hour frame and is about to break upwards
We have a trend to stabilize above the moving average 100
We have an upward trend on the RSI indicator that supports the rise by breaking it upwards
We have a major support area in green at a price of 0.800 from which the price rebounded and respected it greatly
Entry price 0.820
First target 0.887
Second target 0.976
Third target 1.09

Fetch A.I. nearing the top trendline of its falling wedgeNot sure how long it will take it to break upward from this wedge so the measured move line and breakout target is currently placed in an arbitrary location that will obviously need adjusted to wherever it legitimately breaks up from. Not exactly sure how this chart will be effected by the merger of fetch, singularity nd the other ai chain merge. Wil have to wait and see. Will update this chart whenever we get a legitimate breakout. *not financial advice*

Fetch AI Gartley PatternFetch AI (or ASI, depending on Binance's ticker update) has been in a consistent downtrend from its peak at $3.48. It appears in a bottoming range, forming a classic Gartley pattern.
Key Levels to Watch:
Immediate Test Levels: The price will likely test the $1.00 - $1.18 range soon.
Accumulation Range: Any pullback to the accumulation zone between $0.70 - $0.94 would present a strong buying opportunity.
Targets Upon Breakout:
Target 1: $1.76
Target 2: $2.41
Target 3: $3.10
Risk Management:
Stop Loss: Set at $0.50 to manage downside risk.
A close above the downtrend line will confirm the breakout, potentially driving the price towards the T1 and T2 targets. Keep an eye on any pullbacks into the accumulation range, as these could provide optimal entry points for a potential upside move.

FET inside the descending channel The price of FET is moving in a descending channel and has recently bounced from the channel support and support zone (Green) at $0.784 - $0.830.
If the price break above from the descending channel middle line and $1.159 level.
If the price did not holds the support zone (Green) and the descending channel support we might see the price to the next support zone (Blue) at $0.453 - $0.525.

FET to $200? Lets get to $5 firstnot much data to go off for $FET yet.
The chart shows a potential to $5 with fibonacci rules.
If AI is going to be the main thing this year and a bull run returns, exponential growth could shoot to $200 - load up now at $0.20 or lower.

#Fet 1D chartNYSE:FET 1D chart;
The $1,199 level is a strong resistance and it seems to be using it as a balance level.
If there is another possible pullback, it may hit the lower trend line.
It is moving towards a narrowing between the trends and it would not be a surprise if it makes an upward move after the squeeze.
We can consider OB levels as possible resistance zones. Therefore, it may make retracements from here.

Fetch.ai: Keep It Up!FET has risen significantly since our last update, which confirms our primary assumption that the turquoise-colored wave 2 has already been completed. With the same-colored wave 3, the coin should now climb above the resistance at $3.47 and thus toward a new all-time high.
