Fetch

#FET/BTC Broke out! 95% Potential Profit Trade setup.FET BTC just broke out of the 21D MA and also the local trendline resistance.It bounced exactly from the bottom.
Expecting it to break the black trendline resistance and eventually go for a potential 95% rally.
ENTRY: 265 to 274
If somehow we get to see a dip we will buy back more putting a Stop Loss around 243.
TAREGTS:
324
356
411
439
490
512
SL : 243
If you like this setup please hit the like button and share your views in the comment section.
#PEACE

FETUSDT Resistance break | bullish hammer candlefetusdt made really good close above the resistance zone
wait for price to breakout above the trendline
buy the retest of the support

FET Bullish reversal soonFetch ai is a solid project, probably one of the best one from the FA viewpoint. I would not sleep on it. Looking bullish to me.
First two short term targets : $0.076/$0.087
Mettalex launching Jan 2021
Atomix rewards in the next staking round
Mainnet March 2021

Bullish FET/BTC In the past i predicted a breakout from the resistance and it went ahead to do over 400% There is nothing much to say, but looking at the Stoch RSI it looks bullish, if history will repeat itself. We all home BTC does not have a major drop which would drastically affect all alts

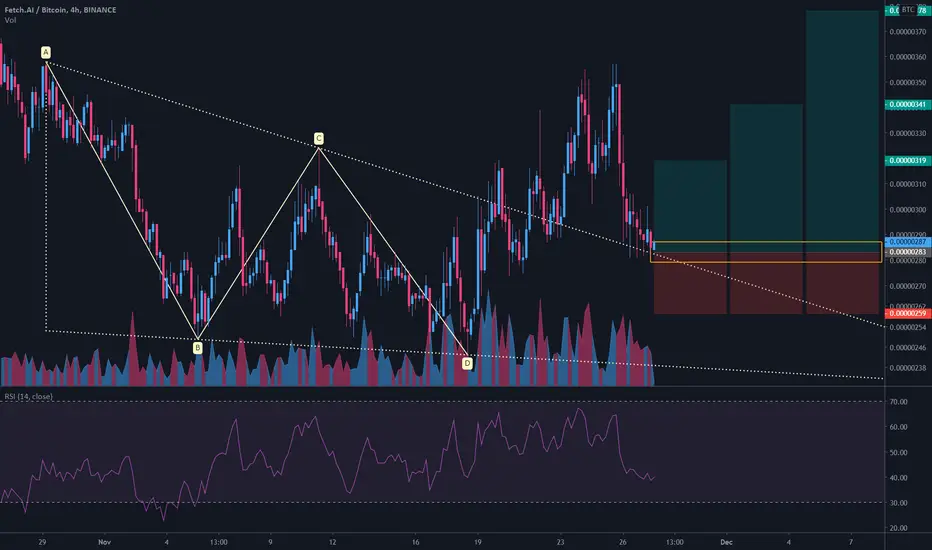
FET/BTC 4h (Binance Spot)Descending triangle breakout & pullbackFetch is looking ready for next move up, again.
Current Price= 0.00000287
Buy Entry= 0.00000287 - 0.00000279
Take Profit= 0.00000319 | 0.00000341 | 0.00000378
Stop Loss= 0.0000259
Risk/Reward= 1:1.5 | 1:2.42 | 1:3.96
Expected Profit= +12.72% | +20.49% | +33.57%
Possible Loss= -8.48%
Fib. Retracement= 0.5 | 0.786 | 1.272
Margin Leverage= 1x
Estimated Gain-time= 240h
FETCH.AI buying opportunity for mid term +90% profitFET providing buy setup, after breakout from wedge it can increase to the 0.092 or higher. Looking to buy in consolidation period.
SL below support


FET.USDT (Y20.P4.E1).Breakout tradeHi,
Another potential breakout trade in the making.
Bit more difficult with the wicks on the top and hence more risk the the CELR setup.
However having said that, FET did well on the macro level.
Something to think about.
Cheers,
S.SAri
Macro view:

FET/BTC (Retest Previous Key Support)💎Technical Analysis Summary💎
BINANCE: FETBTC
-After the recent small run-up, Fetch.AI is back at previous key support
-The big question we have is, will this support hold again?
-Tough to answer this one right now so we need to be careful
-My advice is to wait for a few days until it forms a base of support
-And zome in on 4H timeframe to look for early buy entry
A big Thanks for donating 💰 via Tradingview coins this week to seba26-77 🙏🎉
``````````````````````````````````````````````
Trading Involves High Risk ⚠️
Not Financial Advice 💸
Please Exercise Risk Management 💱
``````````````````````````````````````````````
If You Like My Daily Published Ideas 👍
A little Help By Supporting My Channel 📺
Through Leaving A Thumbs Up, Comment & Follow 💬
Happy Trading! ➡️ Thank You! 😊
``````````````````````````````````````````````

Here I buy Fetch.Ai and FET will go upHere I buy Fetch.Ai
and Fetch.ai will go up.
The price is testing the major resistance, so now I load my bags and the bullish breakout will start.
And Fetch.Ai will go up.
See you up there

FET/BTC 2h (Binance) Symmetrical triangle break-outFetch is looking for some continuation uptrend here!
Current Price= 0.00000848
Buy Entry= 0.00000853 - 0.00000831
Take Profit= 0.00000898 | 0.00000967 | 0.00001015
Stop Loss= 0.00000786
Risk/Reward= 1:1 | 1:2.23 | 1:3.09
Expected Profit= +6.65% | +14.85% | +20.55%
Possible Loss= -6.65%
Fib. Retracement= 0.786 | 1.272 | 1.618
Margin Leverage= 1x
Estimated Gain-time= 240h

$Fet #FETCH.AI possible scenarions aheadWe may see a retest of ema 50 support shortly with possible entry's ahead of us.
Testing the 950 resistance again and breaking it is inevitable.
#BULLISH
Trade safe.

FETBTCWe announced at 576 sats and we took some profits by more than 50%. It is an update for the long term and we can expect two scenarios for this coin..!!


Cleanest chart iv ever seen Ready to moonFinally its safe to say the March 13 drop was bitcoin and fetch.ai bottom. After a year of accumulation and downtrend we are ready.
Chart shows we are already on uptrend.
Lines on the chart shows resistance and once it breaks it will turn into support.
Colored boxes are heavy resistance which might be an area of accumulation.
Heavy accumulation is = Great reward.
Fetch.ai listed on coinbase custody which probably be listed on coinbase pro
Based on BAND and Kyber network after listed on the custody they mooned in which they greatly accumulated as well.

Fetch demand zone Hello, traders.
For Fetch, we had an excellent entry point into the demand zone for this asset, but this train has already passed.
But if anyone is bought in this asset should think about booking some profits considering that we are in an overbought zone in a lot of indicators. A correction would be healthy for the asset
Push the like button and follow us on TradingView.

FET/BTC (Testing Key Resistance)FET/BTC
-the upside push is definitely high but approaching strong key resistance area at 540 sat
-I do not recommend to buy the area current price level
-wait for a pullback at key areas or a consolidation above the resistance zone
-do not catch the price because the risk-reward ratio is no longer in your favor
-plus there is no logical cut point to place a stop loss on a strong single candlestick

Fetch.AI Same Chart (Easy 290%+ Mapped)The same chart still remains valid for Fetch.AI (FETBTC).
Here we have a broken down-trendline as well as increasing volume with bullish indicators.
Prices for FETBTC are now challenging EMA50 and getting ready to jump on a break of this level.
If EMA50 can't be conquered, we will see additional consolidation before the jump.
We are bullish on Fetch.AI (FETBTC).
Remember to hit LIKE!
Namaste.
