Mirroring alts - FET weekly update August 10 - 16thFetch.ai (FET) is advancing within a multi-degree Elliott Wave alignment that mirrors the structures seen across many other altcoins. At the Cycle degree, price is in Wave 1; at the Primary degree, a completed 1–2 structure suggests that Wave 3 is now underway; at the Intermediate degree, the same 1–2 formation implies another Wave 3; at the Minor degree, price is currently in Wave 1; and at the Minute degree, price is in the late stages of Wave 3, which is likely to end inside the highlighted Fair Value Gap (FVG).
Once this smaller Wave 3 completes, a short-lived Wave 4 pullback is expected, followed by Wave 5 to finish Minor Wave 1. A deeper retracement into the 0.5–0.764 Fibonacci zone would then be possible as part of Minor Wave 2 before the next sustained advance. The structure remains bullish as long as key support levels hold.
From a sentiment and liquidity standpoint, funding rates are positive, indicating a bias toward long positions. The liquidity heatmap shows only limited liquidity above current price, while there is more liquidity resting below — a configuration that could allow for a quick liquidity sweep before continuation.
This chart pattern is notably similar to many other altcoin structures right now, reflecting the high degree of correlation within the crypto market. If Bitcoin confirms its own bullish wave count, these aligned setups could trigger synchronized breakouts. Conversely, a BTC rejection could weigh on all correlated altcoins, including FET.
In the broader macroeconomic context, the CME FedWatch Tool indicates a 88,9% probability of a Federal Reserve rate cut at the September FOMC meeting. Markets often front-run such decisions, and this could act as a catalyst for impulsive Wave 3 rallies across crypto. However, heavily skewed bullish sentiment increases the risk of a “sell-the-news” event if traders over-leverage ahead of the announcement. Institutional accumulation likely occurred earlier in the cycle, leaving retail traders to drive the next legs higher.
As long as structural support remains intact and the anticipated Wave 4–5 sequence plays out, FET appears well-positioned for continuation — in alignment with the bullish setups currently visible across much of the altcoin market.
Fetchai

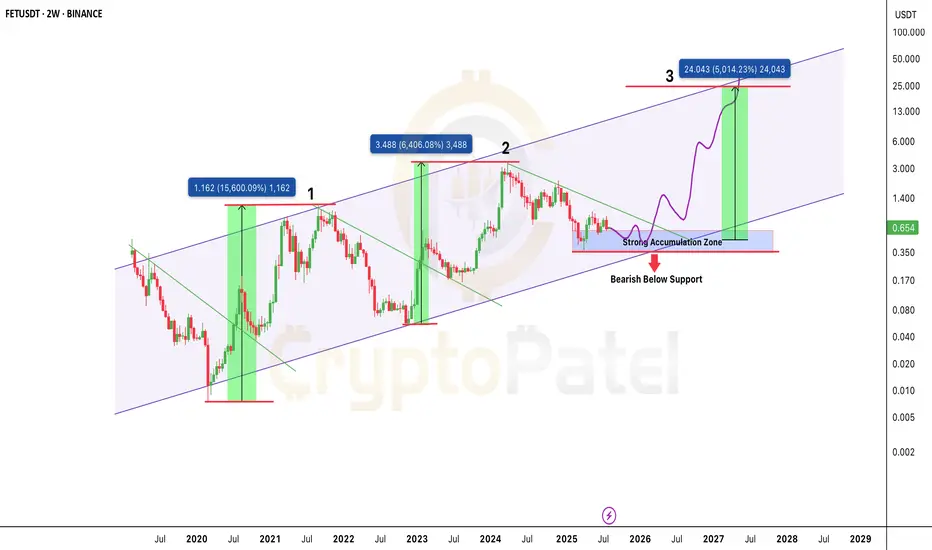
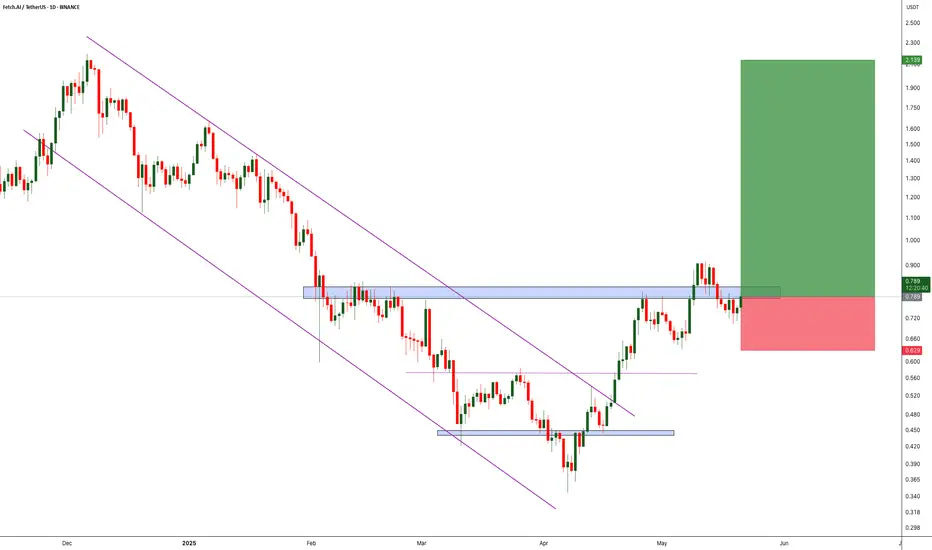
$FET is back in the zone that sparked 15,000%+ rallies?NYSE:FET is back in the zone that sparked 15,000%+ rallies. Same setup. 50x incoming?
FET continues to respect its multi-year ascending channel structure, active since 2020.
Price Action History:
🔹 Wave 1 (2020–2021): +15,600% rally from channel support to resistance
🔹 Wave 2 (2022–2024): +6,400% move following a similar breakout pattern.
🔹 Current Cycle (2025): Price is consolidating in the same accumulation range of $0.35–$0.65.
Key Demand Zone: $0.35–$0.65
Upside Target: ~$24.00 (5,000%+ potential)
🔻 Breakdown Level: Below $0.35 = Structure invalidation
Structure Insight:
Each macro move begins with:
🔹 Accumulation at channel support
🔹 Break of falling trendline
🔹 Aggressive expansion toward the upper boundary
The projected Wave 3 follows this same path if demand zone holds. The structure remains bullish as long as price stays above $0.35.
FET is trading at a high probability accumulation level within a valid macro trend. If history repeats, this could be the next major leg up.
✅ Favor long accumulation strategies
❌ Exit plan needed below $0.35
NFa & DYOR
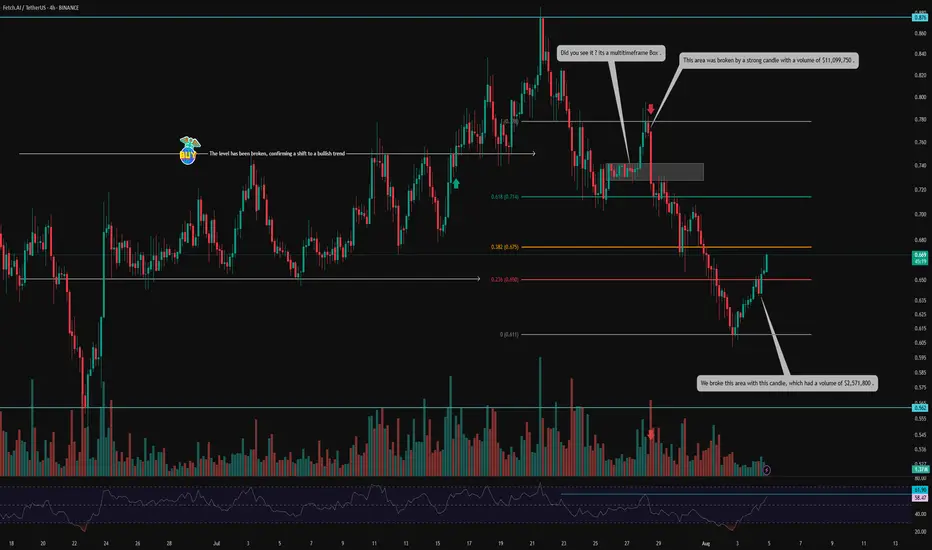
FET on Fire: Volume-Backed V-Pattern Breakout in 4H Structure💀 Hey , how's it going ? Come over here — Satoshi got something for you !
⏰ We’re analyzing FET on the 4-hour timeframe .
👀 After breaking out of its range around $0.75, FET experienced a solid upward move , reaching $0.876 . However , it was rejected from that level and faced heavy selling pressure , eventually forming a consolidation box on the multi-timeframe .
The break of this box, accompanied by rising volume and a total market structure break , led to a move toward the $0.778 resistance , where the price dropped again — this time with significant sell volume .
🎮 The Fibonacci levels in this chart are drawn based on volume-based market activity — specifically from the candle where the sell-off began to the candle where selling pressure ended and a reversal candle formed .
It may sound a bit technical , but the 0.236 Fib level acted as a key V-pattern resistance , which was beautifully broken with a strong $2,571,800 volume, and the candle closed above it .
Following that , traders showed reactions to this level , and the liquidity absorption can be seen in the form of wicks .
🔑 The next important zone is the 0.382 Fibonacci level at $0.675, where we see two possible scenarios :
Reaction and pullback , followed by a breakout .
Breakout first , then a pullback .
You can also place a buy stop at this level — just make sure to use a wider stop-loss .
⚙️ The structure is looking relatively good . The 61.9 RSI region could cause some noise in lower timeframes , but the key area is RSI 70 , which is the entrance to the Overbought zone .
🔼 Volume has been decent , especially considering today is Saturday and a weekend session . This adds more confirmation to the breakout of the V-pattern and the potential end of the correction .
🖥 Summary :
FET is one of those coins with strong recovery potential , operating in the AI sector . It tends to respect classic price action patterns , and with well-drawn Fibonacci levels , volume confirmation , and RSI moving into Overbought , it often activates buy-stop positions cleanly .
💡 Disclaimer :!!! .
FET/USDT Testing Fibonacci – Bounce Incoming or Breakdown Ahead?📊 Technical Analysis Overview:
FET/USDT is currently testing a strong demand zone aligned with the Fibonacci Retracement 0.5 – 0.618 levels, specifically between $0.648 and $0.584. This “golden pocket” area is historically significant and often acts as a pivot zone for price reversals.
🔍 Chart Pattern:
The price formed a series of higher highs and higher lows from March to June, indicating a bullish structure.
Since July, momentum has weakened, and the price has corrected back into the key support zone that previously acted as a base for a rally.
---
📈 Bullish Scenario:
If price holds above $0.584 and forms a reversal candlestick (e.g., bullish engulfing or hammer), a strong rebound is likely.
Key upside targets:
$0.818 (minor resistance)
$0.904 (psychological level)
Potential breakout toward $1.225 if bullish volume returns.
📉 Bearish Scenario:
A decisive breakdown below $0.584 with high volume could trigger further downside toward:
$0.42 – $0.345 (next major support zone)
This move could confirm a bearish continuation pattern such as a descending triangle if resistance continues to hold.
---
🎯 Strategic Outlook:
The current zone is a make-or-break level, and the market is at a decision point. Traders should wait for a clear confirmation through price action and volume before committing to directional trades.
#FETUSDT #CryptoAnalysis #FibonacciSupport #AltcoinSetup #FetchAI #TechnicalOutlook #BullishOrBearish #SupportZone #GoldenPocket
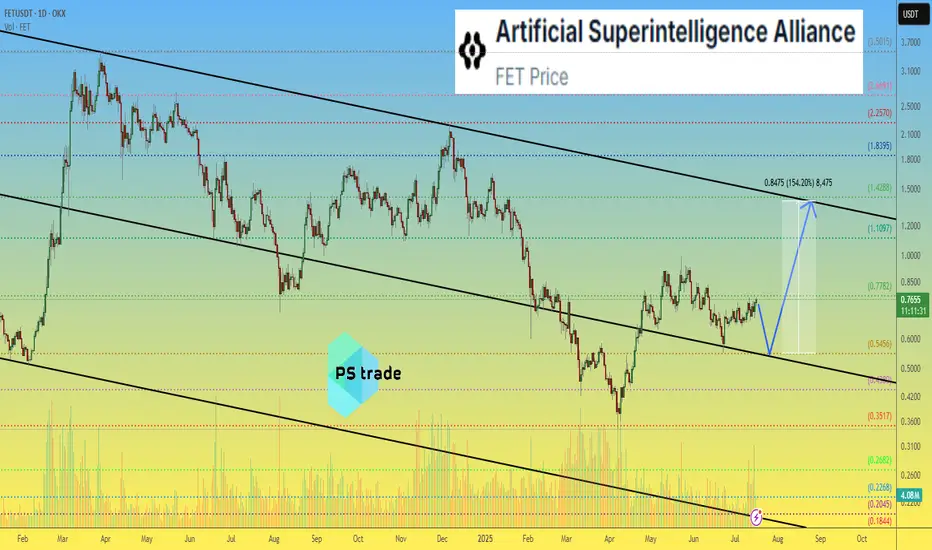
Artificial Superintelligence Alliance - FET price analysis📈 It looks like the price of the combined and updated #FET is trying to consolidate at the top of the channel.
All that remains is to wait for confirmation, i.e., for the OKX:FETUSDT price to stay above $0.55 in the coming days/weeks.
🤖 And then the #ArtificialSuperintelligenceAlliance token (the name is more complicated than the stop word from the movie “Eurotrip” — "hello olds" :) can be purchased for an investment portfolio with a growth potential of at least +150%.
_____________________
Did you like our analysis? Leave a comment, like, and follow to get more
#FET/USDT Preparing for a Major Rally ?#FET
The price is moving within a descending channel on the 1-hour frame and is expected to break and continue upward.
We have a trend to stabilize above the 100 moving average once again.
We have a downtrend on the RSI indicator that supports the upward break.
We have a support area at the lower boundary of the channel at 0.655, acting as strong support from which the price can rebound.
We have a major support area in green that pushed the price upward at 0.650.
Entry price: 0.665
First target: 0.688
Second target: 0.716
Third target: 0.750
To manage risk, don't forget stop loss and capital management.
When you reach the first target, save some profits and then change the stop order to an entry order.
For inquiries, please comment.
Thank you.

#FET/USDT#FET
The price is moving within a descending channel on the 1-hour frame, adhering well to it, and is heading towards a strong breakout and retest.
We are seeing a rebound from the lower boundary of the descending channel. This support is at 0.634.
We have a downtrend on the RSI indicator that is about to be broken and retested, which supports the upward trend.
We are looking for stability above the 100 moving average.
Entry price: 0.661
First target: 0.684
Second target: 0.720
Third target: 0.754

FetchAI New All-Time High —656% Profits Potential MappedSupport here is well defined, it is a long-term situation. Resistance in late 2023 and early 2024; resistance in late April 2025; support in early May and mid-June. This is the red line on the chart.
In early 2024 there was a small rounded bottom pattern below this long-term support line. After resistance was conquered a major bullish wave appeared, more than 400%.
In early to mid-2025 a big rounded bottom pattern appeared below this long-term support line. Below support it is resistance; it has been conquered as resistance and now FETUSDT trades above. This opens the doors for massive growth, really massive.
This chart setup is calling for a new all-time high. You can find several targets mapped on the chart.
» 221% is an easy target, easy profits; high certainty-high probability. This is around $2.30.
» $3.77 is a shy new all-time but I believe this is also high probability. This target gives 426% profits potential.
» The standard 2025 all-time high projection sits around $5.42. From current price, this gives a total of 656%. If we take the same target and use the April bottom as the startup point, we get 1,471%. This would be the total growth of a bullish wave that peaks at $5.42 in late 2025, but there can be more.
Prepare for the best, hope for the best.
The best is yet to come.
Namaste.

FETUSD is an excellent buy, targeting at least $3.75Artificial Superintelligence Alliance (FETUSD) or otherwise known as FETCH.AI has been trading within a multi-year Channel Up and right now is on its latest Bullish Leg and quite possibly the last for this Cycle.
Given that all similar Bullish Legs that started with 1W MACD Bullish Crosses that low, grew by at least +1012%, we expect a minimum Target for this Cycle at $3.75. If it follows the more aggressive +2041% rise of 2023/ 2024, we can even see $7.00 but that is the more optimistic scenario.
-------------------------------------------------------------------------------
** Please LIKE 👍, FOLLOW ✅, SHARE 🙌 and COMMENT ✍ if you enjoy this idea! Also share your ideas and charts in the comments section below! This is best way to keep it relevant, support us, keep the content here free and allow the idea to reach as many people as possible. **
-------------------------------------------------------------------------------
💸💸💸💸💸💸
👇 👇 👇 👇 👇 👇

Fet (Daily) Elliot Wave ii underway after ending diagonalFetch appears to have completed a motif wave (1) with an ending diagonal after finding a bottom at the major support high volume node (HVN) macro wave 4.
Wave 2 has not retraced as deep as other alt coins showing strength in the move up. The downside target is just above the wave (1) swing high, the 0.618 Fibonacci Retracement.
Wave 3 should be a powerful move up taking price into all time high.
Failure to hold this support could see price heading back to fresh lows and testing the $0.35 HVN once more.
Safe trading

$FET is about to re-enter my buy green zone. Quick update on this coin:
The consolidation appears to have found its bottom, and the bullish divergence has played out as expected.
We’re currently seeing a slight cooldown on the daily timeframe, which is healthy after the recent move.
If NYSE:FET enters my green buy zone, it could offer a strong long entry opportunity.
As always, make sure to DYOR, especially during these uncertain times for altcoins.
#FET #CryptoUpdate #Altcoins #TechnicalAnalysis #BullishDivergence #CryptoTrading #BuyZone #CryptoMarket

#FET/USDT#FET
The price is moving within a descending channel on the 1-hour frame, adhering well to it, and is heading for a strong breakout and retest.
We are seeing a bounce from the lower boundary of the descending channel, which is support at 0.814.
We have a downtrend on the RSI indicator that is about to be broken and retested, supporting the upward trend.
We are looking for stability above the 100 moving average.
Entry price: 0.823
First target: 0.866
Second target: 0.912
Third target: 0.957

FET ROADMAPTo me the view is pretty clear.
* The purpose of my graphic drawings is purely educational.
* What i write here is not an investment advice. Please do your own research before investing in any asset.
* Never take my personal opinions as investment advice, you may lose your money.

Eyes on FET – The Calm Before the Bullish Storm?BINANCE:FETUSDT previously broke out of a clean descending channel, flipping the trend and shifting into a bullish structure. Since the breakout, the price has been forming consistent higher highs and higher lows — a clear sign of growing momentum. Right now, it’s testing a local resistance zone. A strong breakout above this level could trigger a significant move to the upside, potentially setting the stage for a new bullish leg. Keep an eye on volume confirmation and price action at the resistance.
As always, manage your risk carefully — smart stop loss placement is key in volatile markets. Let the trend be your friend, but don’t forget your seatbelt!
BINANCE:FETUSDT Currently trading at $0.8
Buy level : Above $0.8
Stop loss : Below $0.63
Target : $2.1
Max leverage 3x
Always keep stop loss
Follow Our Tradingview Account for More Technical Analysis Updates, | Like, Share and Comment Your thoughts
#FET/USDT#FET
The price is moving within a descending channel on the 1-hour frame, adhering well to it, and is heading for a strong breakout and retest.
We are experiencing a rebound from the lower boundary of the descending channel, which is support at 0.696.
We are experiencing a downtrend on the RSI indicator, which is about to break and retest, supporting the upward trend.
We are looking for stability above the 100 Moving Average.
Entry price: 0.721
First target: 0.779
Second target: 0.817
Third target: 0.863

#FET/USDT#FET
The price is moving within a descending channel on the 1-hour frame, adhering well to it, and is heading towards a strong breakout and retest.
We are experiencing a rebound from the lower boundary of the descending channel, which is support at 0.695.
We are experiencing a downtrend on the RSI indicator that is about to be broken and retested, which supports the upward trend.
We are heading towards stability above the 100 moving average.
Entry price: 0.730
First target: 0.765
Second target: 0.810
Third target: 0.850

#FET/USDT#FET
The price is moving within a descending channel on the 1-hour frame, adhering well to it, and is heading for a strong breakout and retest.
We are experiencing a rebound from the lower boundary of the descending channel, which is support at 620.
We are experiencing a downtrend on the RSI indicator, which is about to break and retest, supporting the upward trend.
We are looking for stability above the 100 moving average.
Entry price: 0.625
First target: 0.659
Second target: 0.647
Third target: 0.659

After an 80% Drop, Is FET Finally Ready to Reverse?Exactly one year ago, FET reached its all-time high of $3.5, but since then, it has experienced a steep decline of over 80%.
However, the coin has recently found strong technical support around the $0.45 zone, which, in my view, signals a potential rebound on the horizon.
Currently, FET is trading near $0.52, and from a psychological standpoint, being around a key round number and its Binance listing price, we could see a bounce from these levels.
With this in mind, I anticipate a trend reversal, with an initial target of $1 in the near future. Additionally, $0.80 stands as a significant resistance level and could serve as an interim target before further upside movement.
From a risk-reward perspective, this setup offers an attractive 1:5 ratio

Fetch AI is bullishBINANCE:FETUSDT is bullish as it broke the consolidation triangle
Entry 1.66
Target 2.34
Stop 1.00

Fetch.AI (Fetch.AI/USDT) Bullish Setup Analysis 4HFetch.AI is showing strong bullish momentum with a breakout above key resistance levels.

FET Building familar structureFET 8H chart--Same structure building as last time
BULLISH SCENARIO: from this range we continue up to the next "high traffic" area ($1.20-1.50). This would be a 50% move or so, def an area to take profit. If $1.20-1.50 gets flipped and holds, price should move up into the trendline.
BEARISH SCENARIO: Price rejects here and moves down to stophunt the FEB low around .60. This is where we should see a nice reaction to the upside.
Thanks for reading!

FET | ALTCOINS | Fetch.AI - GREAT Re-Accumulation ZoneFET was one of my top altcoins for 2024, and it did not disappoint after a 500%+ increase early last year.
FET has since been trading in a major corrective cycle, with near-term bounces (also called mid-cycles or mini-cycles).
A great re-accumulation zone is approaching, and it's possible that FET may trade range before making another push for the upside.
Make sure you don't miss yesterday's update on another great alt, ARKM:
______________
BINANCE:FETUSDT

#FET/USDT
#FET
The price is moving in a descending channel on the 1-hour frame and is adhering to it well and is heading to break it strongly upwards
We have a bounce from the lower limit of the descending channel, this support is at a price of 1.00
We have a downtrend on the RSI indicator that is about to be broken, which supports the rise
We have a trend to stabilize above the moving average 100
Entry price 1.05
First target 110
Second target 1.16
Third target 1.22
