FET is about to explodeHello, everyone!
BINANCE:FETUSDT can go against the market. While Bitcoin, Ethereum and other top crypto assets have already flashed the insane short signal, FET is going to finishe the Elliott wave cycle.
It looks like this asset is forming the triangle correction in wave 4. We can conclude that it's actually the wave 4 because maximum Awesome oscillator value shows the wave 3 top.
Moreover the price has broken the trendline resistance. That's why we can conclude that wave 4 has been ended and we are waiting for the explosion in wave 5.
________________________________________________________________________________________________
If you like my trade ideas, please smash the boost button to stimulate me make more quality analytics!
Fetchai

FETUSDTNot financial aDvice. Trade base on your own decissions.
This Account is for free, Just trade on your own discretion.
Come and check me out for more Free IDeas..

Trade setup for FET The idea is: Buy when the price breaks above 0.461$ and take profits at the levels shown in the chart.
Targets:
1. 0.48$
2. 0.51$
3. 0.56$
4. 0.6$
-------------------------------------------
What's a Fair Value Gap (FVG) ?:
A fair value gap is the difference between a financial instrument's theoretical value and market value, such as a derivative or security. It can indicate a misprizing opportunity for traders to profit by buying or selling at the misprized level. In other words, there is a gap in the price in which some open orders still need to be filled. The price will return to fill the orders.
-------------------------------------------
What are triangles when it comes to trading?
Key points:
"1. In technical analysis, a triangle is a continuation pattern on a chart that forms a triangle-like shape.
2. Triangles are similar to wedges and pennants and can be either a continuation pattern if validated or a powerful reversal pattern in the event of failure.
3. three potential triangle variations can develop as price action carves out a holding pattern, namely ascending, descending, and symmetrical triangles."
-------------------------------------------
If you like the content, then make sure to comment and like the post :D
Follow me for daily profitable trading setups.
BTC dictates the market. If BTC falls, then Alts will drop as well. Trade safe!

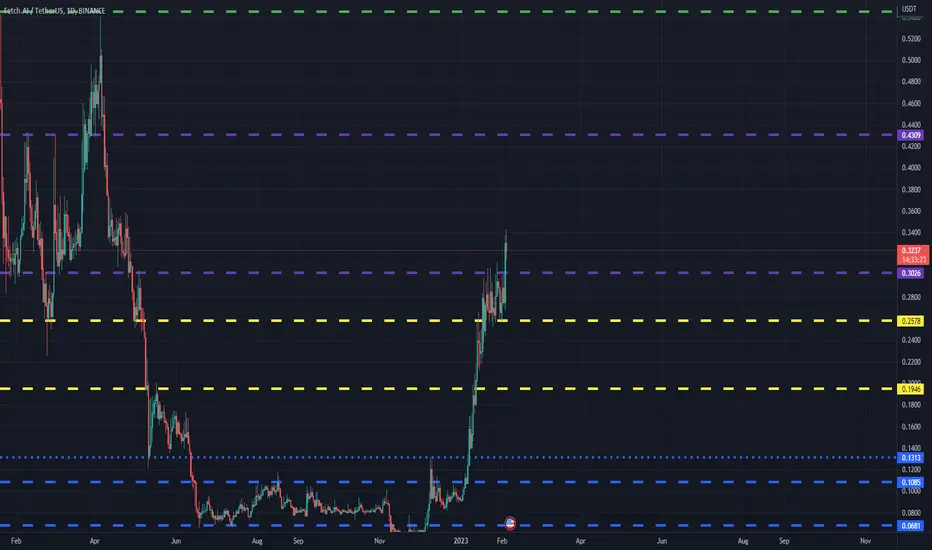
FET reached critical down trend linePrice has reached a long term down trend line with barely non-stop price action in the last weeks. Price is not expected to break the trend line without previously revisiting the 0,2 - 0,165 USDT zone.
If it managed to break the trend line, expect a retest to 0,2 USDT and a further attack to the 0,49-0,62 USD area.

FET/USDTFET/USDT is showing bull flag in multiple (Hourly) timeframes once it breaks the flag and retest it den its a buy.
stop-loss = 15% below the average buying price
take profits are mentioned in the chart itself. DYOR.
NOTE - AI TREND IS STRONG AT THE MOMENT & FETCH.AI IS AN ARTIFICIAL INTELLIGENCE PROJECT.
Always DO YOUR OWN RESEARCH before taking any trade or before investing your hard earned money.
Suggestion/Tip – It is always better to take profit, whether all the zones are bought or not.
Suggestion/Tip 2 - When price is moving on right way
"it is always recommended to move stop-loss to profit side".
If you like the idea and benefited from it please like , share & comment to keep us motivated.

FETUSDT Hit monthly and weekly resistance confluenceI think it is time the price likely stall here and any further upward movement is rejected here and sent back downward to the next support region.
I would not deny a possibility of the price tracing back to the weekly (also monthly) support area.

Fetch.ai (FET) formed bullish Shark for upto 46.50% pumpHi dear friends, hope you are well and welcome to the new trade setup of Fetch.ai (FET) with US Dollar pair.
Previously we caught more than 46% pump as below:
Now on a 4-hr time frame, FET has formed a bullish Shark move for another price reversal move.
Note: Above idea is for educational purpose only. It is advised to diversify and strictly follow the stop loss, and don't get stuck with trade

FETUSDT SHORT POSITION FET has been outperforming BTC these past couple of weeks. If we do see the AI narrative take over in 2023, then we will see this as one of the best performing ALTS in 2023. We currently tapped a resistance around - 0.4900 if we do break this level then I see 0.60 cents and 0.70 as our next big resistance levels.
Not Financial Advice.
Just My opinion. Goodluck.

FETCHAI (Y23.P1.Video1) what is the price storyHi Traders,
This one is difficult to forecast without making major assumptions.
I give it an attempt and also I cover the approach for an entry on the 2 or 4 hrly chart at the end.
It might give you an idea where to take profit.
All the best,
S.SAri

BICO STAGES TAKING PROFIT 1 AND 2BICO long from here. Bico is going or 10x. Get rich !! NFA NFA
one of the best altcoin set up!!

FET|USD Soars 326% in 30 Days: A Rapid Rise ReflectionsFetch.ai is a decentralized platform that provides AI-powered solutions for various industries, including finance, transportation, and energy. It uses blockchain technology to allow for secure and efficient exchanges of data and value, enabling the creation of autonomous economic agents.
Fetch.ai offers a range of products, including a decentralized marketplace for data exchange, a digital twin platform for modeling real-world systems, and a suite of AI tools for businesses and developers. The platform enables efficient, secure, and decentralized transactions between individuals and organizations, allowing for a more efficient and fair exchange of value.
Fetch.ai's vision is to create a decentralized, self-organizing, and autonomous digital economy, where data, value, and tasks are managed and executed by autonomous agents, allowing for more efficient and effective transactions. By leveraging the power of AI and blockchain technology, Fetch.ai aims to revolutionize traditional industries and create new opportunities for businesses and individuals.
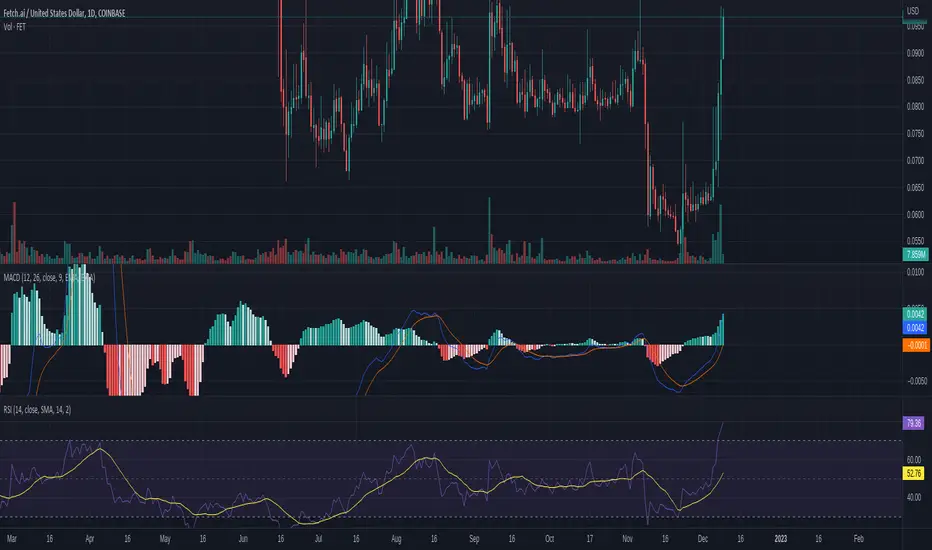
A 1-day chart analysis of Fetch.ai (FET) can provide valuable insights for short-term holders of the cryptocurrency. By examining the price trends, volatility, and volume of Fetch.ai over the past day, it is possible to make predictions about the short-term performance of the asset.
For instance, a sudden surge in the price of Fetch.ai, accompanied by high trading volume, can indicate a sudden increase in demand for the asset, which can be a good opportunity for short-term traders to take advantage of the price increase and sell at a profit. On the other hand, if the chart shows a lot of volatility and price swings, it could signal a lack of market stability, which may be a concern for short-term holders.
Additionally, a 1-day chart analysis can also provide insights into the impact of any major events or news on the price of Fetch.ai. For example, if there was a significant spike in price following the announcement of a new partnership or product launch, this may indicate that the market is optimistic about the potential of the project and that short-term holders may benefit from this positive sentiment.
Overall, a 1-day chart analysis can provide valuable information for short-term Fetch.ai holders to make informed decisions about their investments. By monitoring trends and staying informed about market conditions, they can make more informed decisions about buying and selling Fetch.ai.

FETUSDT(Fetch.ai) Daily tf Range Updated till 4-02-23FETUSDT(Fetch.ai) Daily timeframe range. from local low it already retraced 530%+. thats actually some insane gains.retraced right back to its old range. it do have a decent retail interest. dont fotget AI is a new trend.
FET Fetch.ai Coin Price PredictionAs you can see on FET Fetch.ai Coin 4h Price chart price broke the key resistance level at around $0.30 and if price comes down to this level again there would be a nice buying opportunity.

FETCH.ai CRYPTO:FETUSD
FETUSD
I think after FET was listed on BINANCE Perpetual Futures ,
FETCH.ai start printing Wickoff Distribution Schema , maybe CZ want to buy more & dump more .. Couse i think all AI coins&stock will be next bubble in our life :) I am preparing for cumulate some of this , but who know ? I really dont know nothing ,this is not advice do your own research :D ... couse my ideas are 60% wrong ... I am only conspirate...

Nice targets! (bullish mid term)Here are main levels, studying main resistances for mid-term and checking also de Fib retracement. My personal target: 0.5 mid term. Let's see!

FET/USDT. BitVero Crypto Academy.
Disclamer:
We are not financial advisors. The content that we share on this website are for educational purposes and are our own personal opinions.

FET Towards $0.3400Looking at the daily chart of FET/USDT, the FET price was swinging from $0.08231 to $0.1683 within the past 30 days after going to its lowest of the month at $0.08231. Bouncing back from the support level, FET seem to aim towards to the previous order block at $0.31. If FET is able to break out of the order block and rises higher, we can expect FET to reach $0.3400.
Meanwhile, our long-term FET price prediction for 2023 is bullish if it cannot break the support level. We can expect FET to reach $0.5 this year.


✴️ Fetch.AI | BULLS ConfirmedI initially shared this pair 8-December... All targets have been hit and beyond (See below)...
It went beyond all the mapped targets but there can be more.
We see three waves.
The fourth should be a corrective wave and then the fifth another high.
Remember the saying... What one does, the rest follows.
Expect the entire cryptocurrency/altcoins market to follow.
FetchAI (FETUSDT) bullishness confirms the bullish wave we've been predicting for the past month.
It is now only a matter of time before EVERYTHING speeds up UP!. 👆
Thanks for the trust and support.
Namaste.

Watched FetchAI this week - 3 things all fetusdt HODLer loveWatched FetchAI this week
There are 3 things all fetusdt HODLer will love to see
1. a bullish divergence in the weekly RSI
2. price might close above volume profile $0,081 in a few hours
3. we see increase in volume after long decrease
Let me know your thoughts in the comments🤗
⬇️⬇️⬇️
Likes and Follow for updates appreciated🤗
Disclaimer:
Not financial advice
Do your own research before investing
The content shared is for educational purposes only and is my personal opinion

$FET to $.22-$.24?Fet looks like it's about to make a big run. It's been in accumulation for 6 month and looks like it's about to break out. Once it can break the bottom resistance at $.09, I think there could be a quick move to $.13 and if that breaks, there's a lot of room for price to move upwards.
I ultimately think the move will take us somewhere to the $.22-.24 range before topping.
Let's see. Long from under $.09.

FETch.AI-USDTGreetings,
Coin goes like many altcoins on the same program, a break of consolidation and further development of the upward movement.
A very similar pattern could be seen on these coins:
ETH
ETC
QTUM
DCR
Depending on the capitalization and the coin pamping at different percentages, some of the process is still underway and you can search for similar trade sets on your own.
This coin has a low capitalization and is in the 300th place in the CMC, with a listing on all the top exchanges. Therefore, the targets can be expected to be more optimistic than those of the top 30 coins.
At the moment an attempt to break the local resistance around 1100, with increased vertical volume. Volume growth over the last 24 hours x1.6 CMC data.
Potential entry points on a pullback or a breakdown of this zone, as well highlighted zones for stops, depending on your risk profile.
12H
Also, if someone is interested in pair to BTC
Attached more ideas below, or see in my profile.
If you liked this stuff then like this and subscribe so you won't miss anything.
Always use STOP, and do not use a leverage higher than x3.
A trader must always have tomorrow.
