FET: +50% tradeHello everybody,
FET broke the main resistance, as you can see from the chart the width of this range is high, so low risk and a lot of rewards, if all goes according to plan it will definitely be a great trade in the short term.
target: $ 0.139
stop: close below $ 0.89
Fetchai

Didn't hit rock bottom yetImagine if we get/are in a recession, this coin might go all the way down again to it's lows. Might be a good one then to buy the dip, but i feel like more pain is still to come

Locked and Loaded FET/BTC #FET $FET #FETBTCThere appears to be an Inverted Head and Shoulders on our FET BTC chart ! That's good . That's a bullish structure . You can see the structure has been building since we bottomed out near 640 sats not that long ago . It shouldn't be long now until we complete the right shoulder which we are already halfway through . And then this should go up ! First target area would probably be near the top of the Ichimoku cloud around 12xx sats or so. Where the green arrow is .
After that we have to consolidate on top of the cloud and will need to break through our previous resistance of 1550 but then we should definitely see more upside ! FET looks great for this year ! A gem .
PS - you can see we've clearly closed above that previous Falling Wedge we were in so that's also Bullish .

FET/USDT#FET/USDT ANALYSIS
###################################################################################################################################################+
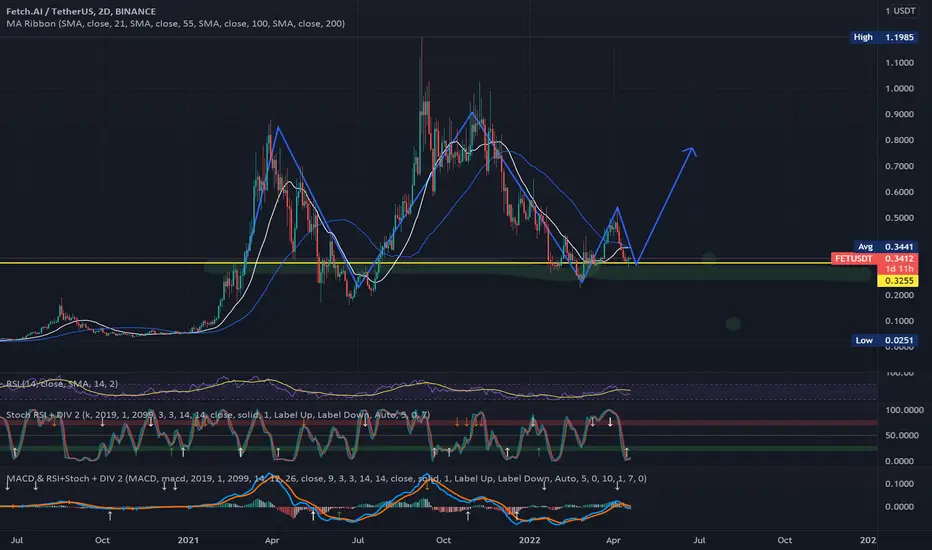
It is holding above horizontal and trendline support. MACD crossover is loosing bearish momentum. As it is currently creating a higher low, so a good volume will confirm a bullish move from here and a sustain breakdown of the support would confirm bearish move. FET has real great project. you can buy it under 0.35
BUY ORDER < 0.344
SELL ORDER >= 0.37-0.70
Targets:
T1: 0.37
T2: 0.42
T3:0.47
T4: the moon
If u agree & like my trading still give me some like and follow me boss! love all of u !!!
HAPPPY TRADING!!!
FET on Binance - Breakout+Retest & preparing to move toward 1$Fetch Ai (FET) On Binance Daily Chart
Successeful Breakout + Retest Done.. Patience is Key.
Aggressive entry now at 0.327
Stoploss after a Daily Close Below 0.25
Safe entry after a Daily Close above 0.43
TP1 0.60
TP2 0.75
TP3 0.99
TP4 2.00
DYOR.

Fetch.AI FETUSDT - Breaking out! + Channel + Head and Shoulders- FET looks very strong on the daily time frame!
- We have a breakout (Head and shoulders + Descending channel).
- Profit target slightly below all time high level

FET - Wait For The Trigger!Hello TradingView Family / Fellow Traders. This is Richard, as known as theSignalyst.
FET is overall bullish trading inside the brown rising broadening wedge pattern.
FET is now approaching the lower brown trendline and green support so we will be looking for buy setups.
on DAILY: The sellers seem to be exhausted, as the last swing couldn’t push lower, instead resulting in a higher lower. This gives us an early alert that a potential shift in momentum might occur soon!
Moreover, FET formed a valid wedge pattern in red and inverse head and shoulders pattern.
But it doesn’t mean that the bulls took over yet.
Trigger => For the bulls to take control, before we buy, we need a candle close above the gray neckline.
Meanwhile, until the buy is activated, FET can still trade lower inside the green support before trading higher.
Good luck!
All Strategies Are Good; If Managed Properly!
~Rich

FetchAI Getting Stronger, Massive Growth Ahead!FetchAI Getting Stronger, Massive Growth Ahead!
FETBTC is now looking really nice and today we have a break above EMA50.
I am not going deep into analysis since I did this in the past few months...
The intention now is to remind you that the Altcoins will ALL grow strong.
The targets are marked yellow on the chart.
Namaste.

Fetch.ai (FET) formed bullish Gartley for upto 22% pumpHi dear friends, hope you are well and welcome to the new trade setup of Fetch.ai (FET) with BTC pair.
Previously we had a nice trade of FET:
On a daily time frame FET has formed bullish Gartley pattern.
Note: Above idea is for educational purpose only. It is advised to diversify and strictly follow the stop loss, and don't get stuck with trade

🆓Fetch.ai (FET) Mar-15 #FET $FET
The buying power of FET is weakening so in the next few days it may fall to the $0.28 zone to retest this zone.
📈RED PLAN
♻️Condition : If 1-Day closes ABOVE 0.28$ zone
🔴Buy : 0.28
🔴Sell : 0.36 - 0.44
📉BLUE PLAN
♻️Condition : If 1-Day closes BELOW 0.28$ zone
🔵Sell : 0.28
🔵Buy : 0.22 - 0.16
❓Details
🚫Stoploss for Long : 10%
🚫Stoploss for Short : 5%
📈Red Arrow : Main Direction as RED PLAN
📉Blue Arrow : Back-Up Direction as BLUE PLAN
🟩Green zone : Support zone as BUY section
🟥Red zone : Resistance zone as SELL section

Fetch.ai ($FET) DTF New FIB$FET consolidating on the lowest FIB means market participants are building a strong foundation to launch from. As long as $BTC does its job, $FET will likely regain ATH easily

How to swingtradeIn essence trading is using people emotions to your advantage. When something is oversold you buy, when overbought you sell. Because this is a very volatile coin i think trading the rsi works very good.

Bear market scenarioThis is my bear market scenario when bitcoin makes new lows into the 20k range. Unless sentiment really improves i don't see this make new all time highs. Especially since it already gone 100x since the all lows. But long term i'm bullish, this is a really good project.

MY MINIMALIST CHART ANALYSIS FOR FETCH.AI$FET
01.24.22
0909H +8 SINGAPORE
Disclaimer:
The findings of the following analysis are the sole opinions of the publisher of this idea and should not be taken as a piece of investment advice.
This will be a good season for ENTRIES. The market has found strong support at a very bargain price for cryptos.
We will be focusing on BITCOIN and ETHEREUM as our TOP CRYPTOS. As for ALTS, ADA, POLKADOT, MANA, SAND, CURVE, MATIC, and a few others.
Basically, the outcome of BITCOIN, the ALTS tends to follow. So I am limiting my published ideas to a few, quality over quantity.
ALERT:
Looking now for an ENTRY to a short to midterm LONG SWING trade.
Based on VITAL SIGNS ( RSI, STOCH, VOL., MA VOL.) Looks healthy:
1. RSI is at 38.
2. STOCHASTICS is at LOW.
3. Volume still needs a spike of SUPPLY for BUYERS to TAKE, but I am afraid a lot of HODL at this point.
4. Looking at key support at 0.344 zones.
5. We can then expect strong support at the .275-.300, right at the bottom of the MAJOR BLUE BOX, MINOR YELLOW BOX, and the ENTRY AREA OF VALUE MARKER.
Hoping that the market does not break any MAJOR or MINOR BOTTOM of our BOXES. Again, if it does, it will be a BUYERS MARKET and good for us all RETAILERS.
Looking back months ago when the MINIMALIST BOX ANALYSIS was made.
The Market had amazingly moved along the TOPS and BOTTOMS of our BOXES, signifying TURNING POINTS of PRICE ACTION, and verified by major FIB levels.
Hoping that this MINIMALIST BOX CHART ANALYSIS will efficiently help you with your DYOR as we climb a NEW SWING CYCLE.
INSTRUCTIONS:
HOW TO USE THIS MINIMALIST CHART a.k.a (Bento Box)
"FOLLOW THE WHITE RABBIT!"
Just Follow the TOPS and BOTTOMS of the BOXES as a GUIDE where the MARKET will take you.
PUBLISHED IDEA is created on a MONTHLY, WEEKLY & DAILY Analysis of a MARKET'S CHARACTER.
It is designed for SWING TRADES at the LOWEST or START of a SWING CYCLE.
Q/A : What are the BOXES for? It is a ROAD MAP for TARGET ZONES IDENTIFICATION.
The LARGE BOXES (Tops and Bottoms) are MAJOR turning points that will occur sometime in the future. While the SMALL BOXES (Tops and Bottoms) are MINOR turning points.
These can be entries to a BUY/ SELL POSITION, EXIT/PARTIAL EXIT/TOP-UP AREAS, as well as Support and resistance levels
Also includes MAXIMUM TARGET EXIT AREA OF VALUE - CONSERVATIVE (If price action conditions are right at that given moment.)
If it cannot break a TOP or BOTTOM of a BOX, It signifies a reversal.
At times I will include a WAY BEYOND PARABOLIC PRICE TARGET, depending on The Character of the Market (CRYPTOS ONLY).
DYOR for your Volume, Chart Patterns, Candlestick Math, FIB COILS, Price Action, FIB LEVELS, Market Dynamics, especially institutional and retailer trading psychology .
Stay away from FOMO and FUD.
NOTE: That PRICE TARGETS for ENTRY and EXITS are DYNAMIC and can CHANGE from time to time.
My Published Ideas are not 100% Accurate. There are many factors at a given time that can change the forecast.
It is all based if the right conditions are met. Generally, it will follow the MINIMALIST BOXES.
Wishing you all The Best Trades and Thank you all for your Appreciation and Support of my work.
Much thanks to my 3 great mentors. They are so much of a blessing that I also wish to share my knowledge of what I was taught.
Vive Le Autist!
Vive Le Diamond Hands!

Time to rock and roll Fetch.ai FETFET looks ready to fly. Potential areas shown, take profits on the way up!
Good luck everyone!

Fetch.io #fetusdtEN :
- End traingle pattern FETUSDT
- Trend following long term
FR :
- Fin de triangle pour FETUSDT
- Continuation de la tendance long terme
- Canal haussier clair

RSI Bullish Divergence?RSI Bullish Divergence,
If the price breaks the trend line, I believe the price will resume the range of 0.6569 - $ 1.

FET/USD BIG FAN OF THE PROJECT - TO THEMOON!!!Hey guys, back after lurking in the background, risk management is key as always, crypto has proven to be amazing for me. :)

Fetch.AI FETUSDT - Elliott Wave +Ascending Channel breaking out!- Impulse Elliott Wave has been completed with 5 successful waves.
- Now the main ascending channel is being destroyed by bears.
- Looks like the bull market is over for 90% of all altcoins.
- Only few altcoins can survive long term, maybe FET can be one of them, but we need a correction first before another push to the upside.
- HODL Is a bad strategy for altcoins, HODL can work only with Bitcoin. Altcoins need to be traded instead.

$FET/BTC 12h (Binance Spot) Descending channel break & pull-backFetch is looking good for another rally after regaining 50MA support, let's enter on the retest!
Current Price= 0.00001143
Buy Entry= 0.00001122 - 0.00001040
Take Profit= 0.00001374 | 0.00001635 | 0.00002045
Stop Loss= 0.00000914
Risk/Reward= 1:1.75 | 1:3.32 | 1:5.77
Expected Profit= +27.10% | +51.25% | +89.18%
Possible Loss= -15.45%
Fib. Retracement= 0.382 | 0.559 | 0.786
Margin Leverage= 1x
Estimated Gain-time= 2 months
Websites: fetch.ai docs.fetch.ai
Contract:
#ERC20 0xaea46A60368A7bD060eec7DF8CBa43b7EF41Ad85

Fetch ($FET) FIBFetch ($FET) FIB: $FET mini-pump is full on target and does not look like it will stop anytime soon

FET Flag Formation 1H %18Hello everyone,
I am observing a flag formation on the 1-hour chart. It can be bought if it retests the resistance (0.5185).
The target (90.6142) will again be the upper resistance.
Just in case, the lower support (0.4572) 10% stop-loss should not be ignored.
Farewell

Update Fet USDT FET refuses to close below the trend line. Which is always a strong sign for the bulls.
Wait for confirmation at the green lines or box.
Target is red box.
